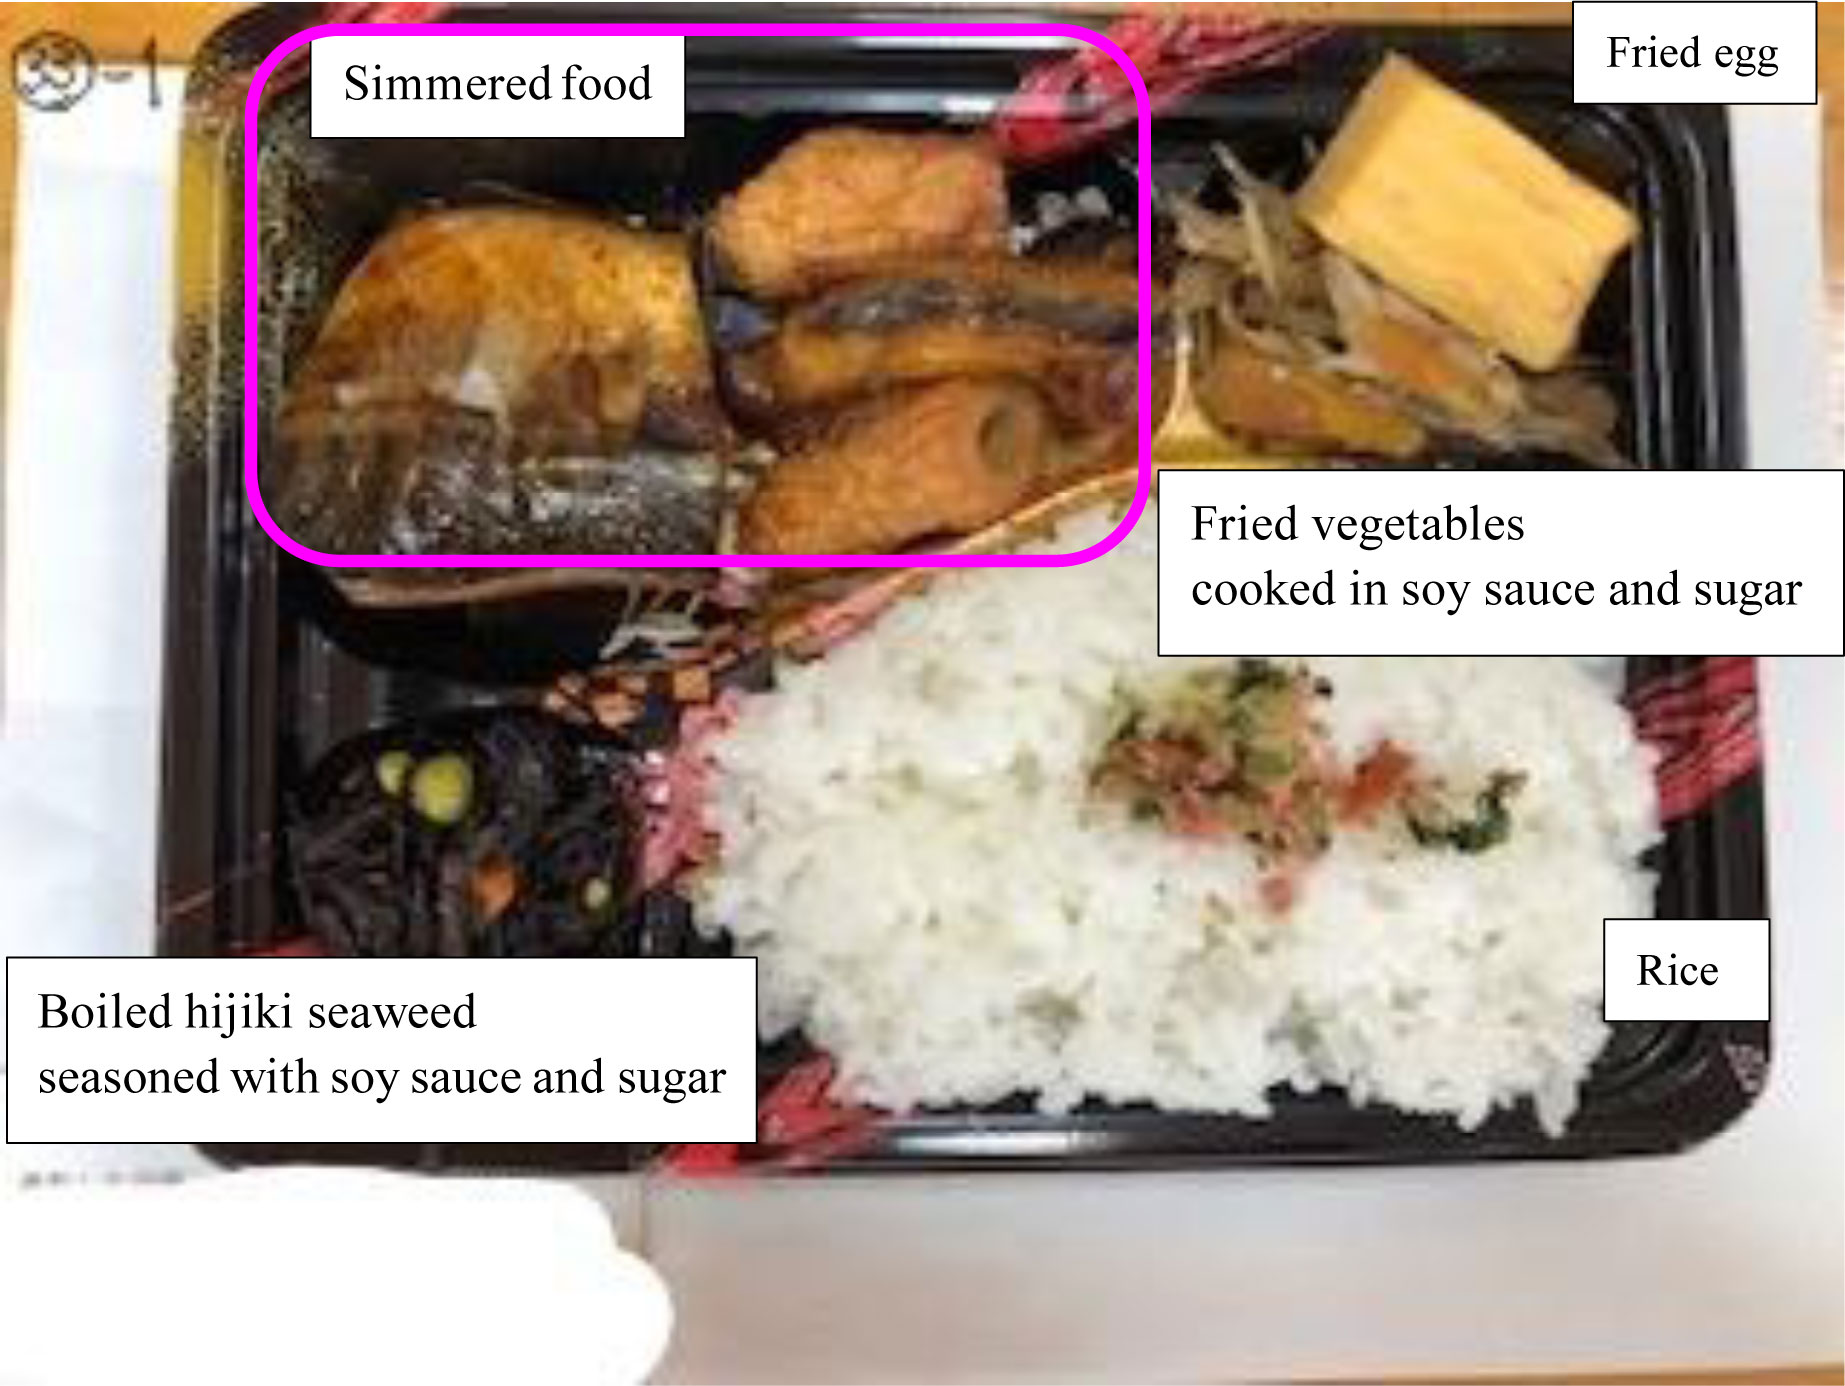
The primary goal was to evaluate the validity of food photographic estimation for nutritional assessment compared with weighed food record (WFR).
We evaluated the validity and reproducibility of photographic estimation of foods provided in evacuation shelters. We analyzed 35 meals served at 12 shelters in Kumamoto Prefecture in Japan, affected by a heavy rain disaster in 2020. In this context, we compared 21 senior students' portion size estimation by food photographs to WFR. In addition, we assigned five meals for each of the 21 senior students, and the same meal photograph was estimated by three students to test reproducibility.
No statistically significant difference was detected between the two methods regarding energy, the total grams of meal, the protein, and vitamins B1, B2, and C, except for salt. In addition, the students who never self-cooked underestimated the total grams.
Food photographic estimation could simplify the nutritional assessment in evacuation shelters. However, unclear photographs and food items served by weight could weaken the estimation accuracy. According to previous studies and the applied postestimation questionnaire, photographs taken from specified angles and reference food photobooks for portion size estimation may improve accuracy.
Citation: Haruka Kobayashi, Noriko Sudo, Nobuyo Tsuboyama-Kasaoka, Ikuko Shimada, Keiichi Sato. Validity and reproducibility of food photographic estimation for evaluating meals in evacuation shelters[J]. AIMS Public Health, 2023, 10(1): 169-182. doi: 10.3934/publichealth.2023013
The primary goal was to evaluate the validity of food photographic estimation for nutritional assessment compared with weighed food record (WFR).
We evaluated the validity and reproducibility of photographic estimation of foods provided in evacuation shelters. We analyzed 35 meals served at 12 shelters in Kumamoto Prefecture in Japan, affected by a heavy rain disaster in 2020. In this context, we compared 21 senior students' portion size estimation by food photographs to WFR. In addition, we assigned five meals for each of the 21 senior students, and the same meal photograph was estimated by three students to test reproducibility.
No statistically significant difference was detected between the two methods regarding energy, the total grams of meal, the protein, and vitamins B1, B2, and C, except for salt. In addition, the students who never self-cooked underestimated the total grams.
Food photographic estimation could simplify the nutritional assessment in evacuation shelters. However, unclear photographs and food items served by weight could weaken the estimation accuracy. According to previous studies and the applied postestimation questionnaire, photographs taken from specified angles and reference food photobooks for portion size estimation may improve accuracy.

| [1] | Small and Medium Enterprise AgencyWhite Papers Small and Medium Enterprise in Japan (2019). Available from: https://www.chusho.meti.go.jp/pamflet/hakusyo/2019/PDF/chusho/05Hakusyo_part3_chap2_web.pdf. |
| [2] | Itoh K, Kikumoto M, Shimono K, et al. (2017) A study on application of world risk index to Japan and comparison with other countries. J JSNDS 36: 73-86. |
| [3] |
Sudo N, Shimada I, Tsuboyama-Kasaoka N, et al. (2021) Revising “nutritional reference values for feeding at evacuation shelters” according to nutrition assistance by public health dietitians based on past major natural disasters in Japan: a qualitative study. Int J Environ Res Public Health 18: 10063. https://doi.org/10.3390/ijerph181910063 
|
| [4] | Gibson RS (2005) Principles of nutritional assessment. Oxford: Oxford University Press 45. |
| [5] |
Hawkins KR, Apolzan JW, Myers CA, et al. (2017) The assessment of food intake with digital photography. Advances in the Assessment of Dietary Intake . Boca Raton (FL): CRC Press 85-111. https://doi.org/10.1201/9781315152288
|
| [6] |
Saeki K, Otaki N, Kitagawa M, et al. (2020) Development and validation of nutrient estimates based on a food-photographic record in Japan. Nutr J 19: 1-13. https://doi.org/10.1186/s12937-020-00615-y
|
| [7] | Itakura H, Watanabe S, Kondo K (2011) Food and Nutritional Problems Following the Great East Japan Earthquake and Tsunami disaster. Tokyo: Kenpakusha Co., Ltd. 97-98. |
| [8] | Ministry of Health, Labour and WelfareNutritional Reference Values to be used as Near-Term Targets for the Planning and Assessment of Meal Provision in Evacuation Shelters (2011). Available from: https://www.pref.yamanashi.jp/kenko-zsn/kenkozukuri/documents/21-4-1-1sankousiryou.pdf. |
| [9] | Ministry of Education, Culture, Sports, Science and TechnologyStandard tables of food composition in Japan (2020). Available from: https://www.mext.go.jp/en/policy/science_technology/policy/title01/detail01/sdetail01/sdetail01/1385122.htm. |
| [10] |
Nelson M, Atkinson M, Darbyshire S (1994) Food photography I: the perception of food portion size from photographs. Br J Nutr 72: 649-663. https://doi.org/10.1079/BJN19940069
|
| [11] |
Williamson DA, Allen HR, Martin PD, et al. (2003) Comparison of digital photography to weighed and visual estimation of portion sizes. J Am Diet Assoc 103: 1139-1145. https://doi.org/10.1016/S0002-8223(03)00974-X
|
| [12] |
Martin C, Han H, Coulon S, et al. (2008) A novel method to remotely measure food intake of free-living individuals in real time: the remote food photography method. Br J Nutr 101: 446-456. https://doi.org/10.1017/S0007114508027438
|
| [13] |
Wang DH, Kogashiwa M, Ohta S, et al. (2002) Validity and reliability of a dietary assessment method: the application of a digital camera with a mobile phone card attachment. J Nutr Sci Vitaminol 48: 498-504. https://doi.org/10.3177/jnsv.48.498
|
| [14] | Nishimura M, Shimada S (2018) Association between food weight measurement with the eye and dietary survey method (the photograph method). J Yasuda Women's Univ 46: 225-230. |
| [15] | Miyachi Y, Sasaki H (2000) A study on weighing in cooking: On visual measurement of food weights. B Sendai Shirayuri Women's Coll 4: 67-75. |
| [16] | Ohmori A, Harada S (2013) Actual condition of food weight in campus. B Toyama Coll 47: 103-106. |
| [17] |
Du CJ, Sun DW (2004) Recent developments in the applications of image processing techniques for food quality evaluation. Trends Food Sci Tech 15: 230-249.
|
| [18] | World Health OrganizationDisaster evacuation shelters in the context of COVID-19 (2020). Available from: https://apps.who.int/iris/bitstream/handle/10665/336856/WPR-DSE-2020-033-eng.pdf?sequence=1&isAllowed=y. |

Figures(2) / Tables(5)

Haruka Kobayashi, Noriko Sudo, Nobuyo Tsuboyama-Kasaoka, Ikuko Shimada, Keiichi Sato. Validity and reproducibility of food photographic estimation for evaluating meals in evacuation shelters[J]. AIMS Public Health, 2023, 10(1): 169-182. doi: 10.3934/publichealth.2023013


 DownLoad: