


As COVID-19 continues to spread across the world and causes hundreds of millions of infections and millions of deaths, medical institutions around the world keep facing a crisis of medical runs and shortages of medical resources. In order to study how to effectively predict whether there are risks of death in patients, a variety of machine learning models have been used to learn and predict the clinical demographics and physiological indicators of COVID-19 patients in the United States of America. The results show that the random forest model has the best performance in predicting the risk of death in hospitalized patients with COVID-19, as the COVID-19 patients' mean arterial pressures, ages, C-reactive protein tests' values, values of blood urea nitrogen and their clinical troponin values are the most important implications for their risk of death. Healthcare organizations can use the random forest model to predict the risks of death based on data from patients admitted to a hospital due to COVID-19, or to stratify patients admitted to a hospital due to COVID-19 based on the five key factors this can optimize the diagnosis and treatment process by appropriately arranging ventilators, the intensive care unit and doctors, thus promoting the efficient use of limited medical resources during the COVID-19 pandemic. Healthcare organizations can also establish databases of patient physiological indicators and use similar strategies to deal with other pandemics that may occur in the future, as well as save more lives threatened by infectious diseases. Governments and people also need to take action to prevent possible future pandemics.
Citation: Qian Shen. Research of mortality risk prediction based on hospital admission data for COVID-19 patients[J]. Mathematical Biosciences and Engineering, 2023, 20(3): 5333-5351. doi: 10.3934/mbe.2023247
| [1] | Carina Ladeira, Lenka Smajdova . The use of genotoxicity biomarkers in molecular epidemiology: applications in environmental, occupational and dietary studies. AIMS Genetics, 2017, 4(3): 166-191. doi: 10.3934/genet.2017.3.166 |
| [2] | Eun Jeong Kim, Yong-Ku Kim . Panic disorders: The role of genetics and epigenetics. AIMS Genetics, 2018, 5(3): 177-190. doi: 10.3934/genet.2018.3.177 |
| [3] | Agnès Collet, Julien Tarabeux, Elodie Girard, Catherine Dubois DEnghien, Lisa Golmard, Vivien Deshaies, Alban Lermine, Anthony Laugé, Virginie Moncoutier, Cédrick Lefol, Florence Copigny, Catherine Dehainault, Henrique Tenreiro, Christophe Guy, Khadija Abidallah, Catherine Barbaroux, Etienne Rouleau, Nicolas Servant, Antoine De Pauw, Dominique Stoppa-Lyonnet, Claude Houdayer . Pros and cons of HaloPlex enrichment in cancer predisposition genetic diagnosis. AIMS Genetics, 2015, 2(4): 263-280. doi: 10.3934/genet.2015.4.263 |
| [4] | Cecilia Rodríguez, Marcelo H. Cassini, Gabriela del V. Delgado, Argentinian Integron Study Group, María S. Ramírez, D. Centrón . Analysis of class 2 integrons as a marker for multidrug resistance among Gram negative bacilli. AIMS Genetics, 2016, 3(4): 196-204. doi: 10.3934/genet.2016.4.196 |
| [5] | M. Reza Jabalameli, Ignacio Briceno, Julio Martinez, Ignacio Briceno, Reuben J. Pengelly, Sarah Ennis, Andrew Collins . Aarskog-Scott syndrome: phenotypic and genetic heterogeneity. AIMS Genetics, 2016, 3(1): 49-59. doi: 10.3934/genet.2016.1.49 |
| [6] |
Hossein Mozdarani, Sohail Mozdarani .
De novo cytogenetic alterations in spermatozoa of subfertile males might be due to genome instability associated with idiopathic male infertility: Experimental evidences and Review of the literature . AIMS Genetics, 2016, 3(4): 219-238. doi: 10.3934/genet.2016.4.219 |
| [7] | Jeffrey M. Marcus . Our love-hate relationship with DNA barcodes, the Y2K problem, and the search for next generation barcodes. AIMS Genetics, 2018, 5(1): 1-23. doi: 10.3934/genet.2018.1.1 |
| [8] | Dawei Liu, Zeeshan Shaukat, Rashid Hussain, Mahwish Khan, Stephen L. Gregory . Drosophila as a model for chromosomal instability. AIMS Genetics, 2015, 2(1): 1-12. doi: 10.3934/genet.2015.1.1 |
| [9] | Seoyoung Yoon, Yong-Ku Kim . The role of immunity and neuroinflammation in genetic predisposition and pathogenesis of Alzheimer's disease. AIMS Genetics, 2015, 2(3): 230-249. doi: 10.3934/genet.2015.3.230 |
| [10] | Ruthie Su, Margaret P. Adam, Linda Ramsdell, Patricia Y. Fechner, Margarett Shnorhavorian . Can the external masculinization score predict the success of genetic testing in 46,XY DSD?. AIMS Genetics, 2015, 2(2): 163-172. doi: 10.3934/genet.2015.2.163 |
As COVID-19 continues to spread across the world and causes hundreds of millions of infections and millions of deaths, medical institutions around the world keep facing a crisis of medical runs and shortages of medical resources. In order to study how to effectively predict whether there are risks of death in patients, a variety of machine learning models have been used to learn and predict the clinical demographics and physiological indicators of COVID-19 patients in the United States of America. The results show that the random forest model has the best performance in predicting the risk of death in hospitalized patients with COVID-19, as the COVID-19 patients' mean arterial pressures, ages, C-reactive protein tests' values, values of blood urea nitrogen and their clinical troponin values are the most important implications for their risk of death. Healthcare organizations can use the random forest model to predict the risks of death based on data from patients admitted to a hospital due to COVID-19, or to stratify patients admitted to a hospital due to COVID-19 based on the five key factors this can optimize the diagnosis and treatment process by appropriately arranging ventilators, the intensive care unit and doctors, thus promoting the efficient use of limited medical resources during the COVID-19 pandemic. Healthcare organizations can also establish databases of patient physiological indicators and use similar strategies to deal with other pandemics that may occur in the future, as well as save more lives threatened by infectious diseases. Governments and people also need to take action to prevent possible future pandemics.
Genetic epidemiology studies how genetic factors determine health and disease in families and populations and their interactions with the environment. Classical epidemiology usually studies disease patterns and factors associated with disease etiology, with a focuson prevention, whereas molecular epidemiology measures the biological response to environmental factors by evaluating the response in the host (e.g., somatic mutations and gene expression) [1].
Interest in how the environment triggers a biological response started in the mid-nineteenth century, but approximately 100 years passed until epidemiologists and genetic epidemiologists had adequate analytical methods at their disposal to understand how genes and the environment interact [2]. The beginning of genetic epidemiology as a stand-alone discipline started with Morton in the 1980s with one of the most accepted definitions: “a science which deals with the etiology, distribution, and control of disease in groups of relatives and with inherited causes of disease in a population” [3]. However, epidemiology is clearly a multidisciplinary area that examines the role of genetic factors and environmental contributors to disease. Equal attention has to be given to the differential impact of environmental agents (familial and non-familial) on different genetic backgrounds [4] to detect how the disease is inherited, and to determine related genetic factors.
With advances in molecular biology techniques in the last 15 years, our ability to survey the genome, give a functional meaning to the variants found, and compare it among individuals has increased dramatically [5]. Although there is still a long way to go to fully understanding rare diseases and how genetic variability influences phenotype, these technological advances allow more in depth biological knowledge of epidemiology [6] (Figure 1).
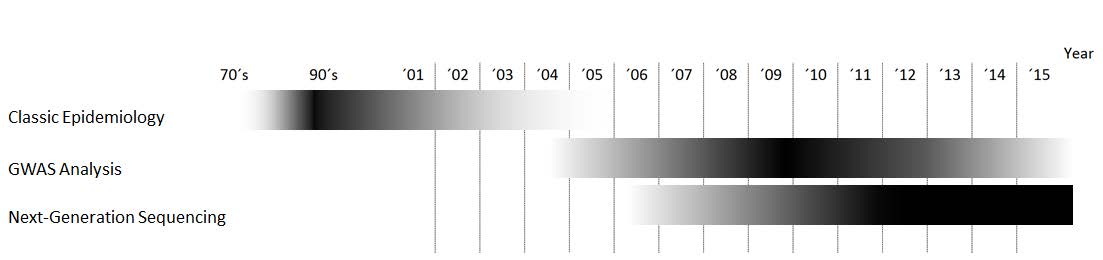 Figure 1. Relative importance of each methodology over time.
Here, wepresent an overview of approaches in genetic epidemiology studies, ranging from classical family studies/segregation analysis and population studies tothe more recent genome-wide association studies (GWAS) and next-generation sequencing (NGS), which have fueled research on this area by allowing more precise data to be obtained in less time.
Genetic epidemiology was born in the 1960s as a combination of population genetics, statistics and classical epidemiology, and applied the methods of biologicalstudy available at that time. Generally, the studies included the following steps:establish genetic factor involvement inthe disorder, measure the relative size of the contribution of the genetic factors in relation to other sources of variability (e.g., environmental, physical, chemical, or social factors), andidentify the responsible genes/genomic areas. or that, family studies (e.g., segregation or linkage analysis) or population (association) studies are usually performed. Approachesinclude genetic risk studies to determine the relative contribution of the genetic basis and ambience by utilizing monozygotic and dizygotic twins [7]; segregation analysesto determine the inheritance modelby studying family trees [8]; linkage studies to determine the coordinates of the implicated gene(s) by studying its cosegregation; and association studies to determine the precise allele associated with the phenotype byusing linkage disequilibrium analysis [9].
Genetic risk studiesrequire a family-based approach in order to evaluate the distribution of traits in familiesand identify the risk factors that cause a specific phenotype. Traditionally, twin studies have been used to estimate the influence of genetic factors underlying the phenotype by comparing monozygotic (sharing all of their genes) and dizygotic (sharing half of their genes) twins. In order to standardize the measurement of similarity, aconcordance rate is used. Monozygotic twins generally being more similar than dizygotic twins is usually considered evidence of the importance of genetic factors in the final phenotype, but several studies have questioned this view [10]. Importantly, twin studies make some preliminary assumptions, such as random mating, in which all individuals in the population are potential partners, andthat genetic or behavioral restrictions are absent, meaning that all recombinations are possible [11]. win studies also assume that the two types of twins share similar environmental experiences relevantto the phenotype being studied [12]. Concordance rates of less than 100% in monozygotic twins indicate the importance of environmental factors [13,14].
The objective of segregation analysis is to determine the method of inheritance of a given disease or phenotype. his approach can distinguish between Mendelian (i.e., autosomal or sex-linked, recessive or dominant) and non-Mendelian (no clear pattern [15]) inheritance patterns. For the non-Mendelian patterns, factors interfering with genotype-phenotype correlation, such as incomplete penetrance, variable expressivity and locus heterogeneity, and the variable effect of environmental factors can complicate the segregation analysis [16]. Thus, families with large pedigrees and many affected individuals can be particularly informative for these studies [17].
Linkage studies aim to obtain the chromosomal location of the gene or genes involved in the phenotype of interest. Genetic Linkage was first used by William Bateson, Edith Rebecca Saunders, and Reginald Punnett, and later expanded by Thomas Hunt Morgan [18]. One ofthe main conceptsinlinkage studies is the recombination fraction, which is the fraction of births in whichrecombination occurred between the studied genetic marker and the putative gene associated with the disease. If the loci are far apart, segregation will be independent; the closer the loci, the higher the probability ofcosegregation [19,20]. Classically, the percent of recombinants has been used to measure genetic distance: one centimorgan (cM), named after the geneticist Thomas Hunt Morgan, is equal to a 1% chance of recombination between two loci. ith this information, linkage maps can be constructed. A linkage map is a genetic map of a species in which the relative positions of its genes or genetic markers areshown based on the frequencies of recombination between markers during the crossover of homologous chromosomes [21]. The more frequent the recombination, the farther both loci are. Linkage maps are not physical maps, but relative maps. Translating the me asure into a physical unit of distance, 1cM is approximately 1 million bases [22].
Linkage analysis is based on the likelihood ratio, also called the logarithm of odds (LOD) score, which is the statistical estimate of whether two genes are likely to be located near each other on a chromosome and, therefore, their likelihood of being inherited together. This analysis can be either parametric (if the relationship between genotype and phenotype is assumed to be known) or non-parametric (if the relationship between phenotype and genotype is not established) [23].
Association studies, which are frequently mixed up with linkage studies, focus on populations. This approach tests whether a locus differs between two groups of individuals with phenotypic differences. The loci are usually susceptibility markers that increase the probability of having the phenotype or disease, but for which there is not necessarily linkage, as it can be neither necessary nor sufficient for phenotype/disease expression [24]. Due to the increased number of individuals in such a study, the statistical power of this approach is greaterthan that of linkage analysis andmore prone to detect genes with a low effect on the phenotype [25].
Although the current approaches to epidemiology studiesrelyonthose discussed above, advances in biotechnology have brought significant changes to genetic epidemiology and how these studies areperformed. Technological improvements have accelerated data gathering and interpretation [5], broadening our understanding of disease etiology.
In the last 10 years, GWAS have transformed the world of genetic epidemiology, with a large number of research studies and publications on complex diseases, allowing the identification of a great number of phenotype-associated genomic loci [26]. ypically, linkage studies in combination with information from family pedigrees are used to broadly estimate the position of the disease-associated loci [27]. With the advent and popularization of array technology, GWAS have become a widespread tool for genetic epidemiology studies. This approachallows the simultaneous and highly accurateinterrogation ofmillions of genomic markers at a reasonable cost and speed. The first GWAS was published by Klein et al [28], and to date more than 2000 articles have been published based on this methodology [29]. These studies allow the determination of thousands of disease-associated genomic loci, which could serve as risk predictors if a large enough discovery sample size is provided [30]. In addition, these dense, genome-wide markers allow a reasonable approximation to understand narrow-sense heritability [31].
In order to find a genetic association with a given phenotype, GWAS need the effect of the variant(s) to be notorious and/or to have strong linkage disequilibrium with previously genotyped markers [32]. GWAS are mostly useful under the common-disease common-variant hypothesis [33]. Therefore, this approach may not be adequate for some common diseases for which rare variants with additive effects are the underlying mechanism [34].
GWAS have been useful forobtaining genomic information about the basis of several diseases, but they have some limitations. First, as genetic markers are only being surveyed in this approach, it is difficult to interpret the results, partially due to our current lack of understanding of genomic function. The use of non-random associations of variants at different loci (i.e., linkage disequilibrium) as a correlation tool also impacts the interpretation of results [35]. GWAS identify blocks of variants, not necessarily the real functional variants [36]. Second, and related to the first point, we miss part of the heritability because of a gap between the variance explained by the significant single nucleotide polymorphisms (SNPs) identified and the estimated heritability [37]. This could be explained, at least partially, bythe limited info obtained from the genome by GWAS. Small insertions and deletions, large structural variants, epigenetic factors, gene interactions, and gene by environment interactions could be playing a role in that [38,39,40].
In the last 8 years, the advent of NGS has helped fill the gap in understanding the genome. As with sequencing each individual base is interrogated, it may help in screening rare variants.
NGS promises great opportunities for finding the answers to questions raised byarray technology, as it has the potential to provide additional biological insight into disease etiology. As we move into an era of personalized medicine and complex genomic databases, the demand for new and existing sequencing technologies is constant. Although it is not yet possible to routinely sequence an individual genome for $1000, novel approaches are reducing the cost per base and increasing throughput on a daily basis [41,42]. Moreover, advances in sequencing methodologies are changing the ways in which scientists analyze and understand genomes, whereas the results that they yield are being disseminated widely through science news magazines [43].
Advances in knowledge on the genetic basis of pathologies have changed the way in which such entities are understood. Thus, diseases have gone from being individual-specific to a familial phenomenon in which genetic alterations (mutations) can be genealogically traced to the molecular level.
NGS can be used to identify several types of alterations in the genome, the most common of which are SNPs, structural variants, and epigenetic variations on very large regions of the genome [44,45,46,47,48]. Because of the capacity of NGS to detect many types of genomic and epigenetic variations on a genome scale in a hypothesis-free manner with great coverage and accuracy, it is starting to explain the missing heritability gap left by GWAS [37,49]. With these tools, it is currently possible to obtain a more comprehensive view of how phenotypic variance works in genetic epidemiology.
NGS allows researchers to study all of the SNPs in each individual directly [50]. This is a large amount of information, which requires large data analysis resources. Inwhole genome and whole exome analysis, the number of rare variants that is revealed can be overwhelmingly large. Most of these variants have no known functional relevance. Therefore, it is not yet easy or straightforward to filter and identify the causal variants, even after accurate variant calling has been performed. Targeted resequencing of candidate genes could be a feasible optionfor avoidingthe high number of variants obtained by whole genome and whole exome sequencing in cases in which there is already a strong knowledge basis regardingphenotypeetiology, but the number of genes is still large for traditional Sanger sequencing [51,52,53]. This type of study significantly reduces analysis costs, as samples could be multiplexed for the analysis, and simultaneously reduces the number of variants found in the regions of interest. Therefore, the analysis will be comparatively easier and the amount of information given per individual less, though more focused on targeted genes. Another option would be to sequence family trios in order to allow filtering of shared variants and speed up the identification of de novo mutations on the affected individual [54,55,56,57].
Thus, NGS can be applied to the study of both rare and common diseases. For rare monogenic diseases, genes can be directly sequenced and variants identified with a small sample size [58,59,60]. Depending on the genetic heterogeneity, finding the involved allele could still be challenging. Rare diseases are usually identified by symptoms, which could be shared by completely different diseases, as the mechanisms underlying the phenotype could be different. This is one of the most difficult points when analyzing rare diseases with genetic heterogeneity. For these cases, larger sample sizes are usually required in order to find the genomic loci implicated in the phenotypeetiology [6,55,61,62,63,64]. Time of appearance and disease severity are often ruled by the residual enzymatic activity of mutated proteins and the influence of the individual genomic background. Therefore, the type of causal variants could be diverse (e.g., coding, splicing, non-coding, missense, epigenetic alterations), as well as the influence on final protein activity. To make it even more complex, those alterations could be shared between individuals with different phenotypesdepending on the penetrance of the variant, background, or environment [65].
As advances in technology imply generating a larger amount of data, genomic annotation is crucialfor variant prioritization and the interpretation of results. With theuse of adequate tools, random and systematic noise, false positives, and false negatives can be reduced, easing the final analysis. Study design can also influence the analysis, as it is a compromise between the amount of data to be generatedand the scope of the study; whole genome sequencing is expected to provide hundreds of thousands of variants, most with yet unknown significance, in intronic or non-coding regions. Whole exome sequencing will still result in a large number of variants, but the annotation of exonic regions is much more curated than that of intronic regions. In the case of a gene-panel targeted study, the list of variants could be reduced to several hundred, depending on the number of genes included, making the analysis and filtering easier, but the data will be limited to the previously selected genes.
The Human Reference Genome established in 2001 [66,67] and the achievements of large sequencing projects such as the 1000 Genome Project [68] are catalyzing advances in human genetics. Large samples obtained with these projects allow adequate statistical power to shed light into rare variant effects [6,64,69] and empower the usage of analysis tools for automatic variant annotation.
Methods for variant analysis and effect prediction have been developed in order to speed up this process. A complete list of software and tools is available online [70]. These methods focus mostly on coding regions in the human genome. Although 98% of the human genome is non-coding [71], these regions are less well known [72]. Thus, there are annotation tools extending the scope to the non-coding and regulatory areas, such asHaploReg [73], RegulomeDB [74], CADD [75], VariantDB [76], GWAVA [77], and ANNOVAR [78], among others [79]. However, the final judgment regarding potential variants is in the hands of the user.
Large consortia, such as the ENCODE project, have generated a large amount of information on the human genome [80], including information on transcriptional binding sites, histone modifications, and DNA methylation, in order to explain the influence on overall phenotype.
Technological advances are playing a crucial role in the evolution of genetic epidemiology as a discipline, as theyallow usto addressmore complex biological questions. The spread and popularization of NGS due to its reduction on the cost per sequenced base is democratizing access to these technologies, allowing researchers to continue on the path opened by previous tools, such as GWAS. This has been observed by the increasing number of research groups and publications using these technologies.
Currently, NGS has the potential to move genetic epidemiology forward, as it allows the assessment of common and rare SNPs, as well as other diverse types of genomic and epigenetic variations using a hypothesis-free whole genome analysis. The elucidation of genome variabilityforincreasing our understanding of living systemsis crucial.
Nonetheless, advances would not be possible without the appropriate mathematical algorithms to transform the sequences into meaningful information or without databases to annotate the identified variants. To fill this gap in information, large programs have been established (1000 Genomes Project consortium [81] and the NHGRI Genome Sequencing Program (GSP) [82]) to provide annotation data on the variations in the human genome.
Overall, newtechnologies such as GWAS and NGS constitute an opportunity for researchers to understand the genetic variability underlying complex phenotypes and provide unprecedented tools in their investigation.
The authors declare that they have no competing interest.
| [1] |
G. Gabutti, E. d'Anchera, F. De Motoli, M. Savio, A. Stefanati, The epidemiological characteristics of the COVID-19 pandemic in Europe: Focus on Italy, Int. J. Environ. Res. Public Health, 18 (2021), 2942. https://doi.org/10.3390/ijerph18062942 doi: 10.3390/ijerph18062942

|
| [2] |
Y. Mahendradhata, N. L. P. E. Andayani, E. T. Hasri, M. D. Arifi, R. G. M. S. Siahaan, D. A. Solikha, et al., The capacity of the Indonesian healthcare system to respond to COVID-19, Front. Public Health, 9 (2021), 887. https://doi.org/10.3389/fpubh.2021.649819 doi: 10.3389/fpubh.2021.649819
|
| [3] | A. Johnson, A. B. Amin, A. R. Ali, B. Hoots, B. L. Cadwell, S. Arora, et al. COVID-19 incidence and death rates among unvaccinated and fully vaccinated adults with and without booster doses during periods of Delta and Omicron variant emergence-25 US Jurisdictions, April 4–December 25, 2021, Morb. Mortal. Wkly. Rep., 71 (2022). https://doi.org/10.15585/mmwr.mm7104e2 |
| [4] |
A. Notari, G. Torrieri, COVID-19 transmission risk factors, Pathog. Glob. Health, 116 (2020), 146–177. https://doi.org/10.1080/20477724.2021.1993676 doi: 10.1080/20477724.2021.1993676
|
| [5] |
M. Coccia, Optimal levels of vaccination to reduce COVID-19 infected individuals and deaths: A global analysis, Environ. Res., 204 (2022), 112314. https://doi.org/10.1016/j.envres.2021.112314 doi: 10.1016/j.envres.2021.112314
|
| [6] | I. Benati, M. Coccia, Global analysis of timely COVID-19 vaccinations: improving governance to reinforce response policies for pandemic crises, Int. J. Health Governance, 27 (2022). https://doi.org/10.1108/IJHG-07-2021-0072 |
| [7] |
B. V. Duong, P. Larpruenrudee, T. Fang, S. I. Hossain, S. C. Saha, Y. Gu, et al., Is the SARS CoV-2 omicron variant deadlier and more transmissible than delta variant?, Int. J. Environ. Res. Public Health, 19 (2022), 4586. https://doi.org/10.3390/ijerph19084586 doi: 10.3390/ijerph19084586
|
| [8] |
M. Hung, B. Mennell, A. Christensen, A. Mohajeri, H. Azabache, R. Moffat, Trends in COVID-19 inpatient cases and hospital capacities during the emergence of the omicron variant in the United States, COVID, 2 (2022), 1207–1213. https://doi.org/10.3390/covid2090087 doi: 10.3390/covid2090087
|
| [9] |
M. E. Shipe, S. A. Deppen, F. Farjah, E. L. Grogan, Developing prediction models for clinical use using logistic regression: An overview, J. Thorac. Dis., 11 (2019), S574. https://doi.org/10.21037/jtd.2019.01.25 doi: 10.21037/jtd.2019.01.25
|
| [10] |
E. Christodoulou, J. Ma, G. S. Collins, E. W. Steyerberg, J. Y. Verbakel, B. V. Calster, A systematic review shows no performance benefit of machine learning over logistic regression for clinical prediction models, J. Clin. Epidemiol., 110 (2019), 12–22. https://doi.org/10.1016/j.jclinepi.2019.02.004 doi: 10.1016/j.jclinepi.2019.02.004
|
| [11] |
W. Shaban, A. Rabie, A. Saleh, M. Abo-Elsoud, A new COVID-19 patients detection strategy (CPDS) based on hybrid feature selection and enhanced KNN classifier, Knowl.-Based Syst., 205 (2020), 106270. https://doi.org/10.1016/j.knosys.2020.106270 doi: 10.1016/j.knosys.2020.106270
|
| [12] |
V. Singh, R. C. Poonia, S. Kumar, P. Dass, P. Agarwal, V. Bhatnagar et al., Prediction of COVID-19 corona virus pandemic based on time series data using support vector machine, J. Discret. Math. Sci. Cryptogr., 23 (2020), 1583–1597. https://doi.org/10.1080/09720529.2020.1784535 doi: 10.1080/09720529.2020.1784535
|
| [13] | L. Breiman, Random forests, in Machine learning, 45 (2001), 5–32. https://doi.org/10.1023/A:1010933404324 |
| [14] |
M. Khalilia, S. Chakraborty, M. Popescu, Predicting disease risks from highly imbalanced data using random forest, BMC Med. Inf. Decis. Making, 11 (2011), 1–13. https://doi.org/10.1186/1472-6947-11-51 doi: 10.1186/1472-6947-11-51
|
| [15] | M. Ezzoddin, H. Nasiri, M. Dorrigiv, Diagnosis of COVID-19 cases from chest X-ray images using deep neural network and LightGBM, in 2022 International Conference on Machine Vision and Image Processing (MVIP), (2022), 1–7. https://doi.org/10.1109/MVIP53647.2022.9738760 |
| [16] | T. Chen, C. Guestrin, Xgboost: A scalable tree boosting system, in Proceedings of the 22nd ACM SIGKDD International Conference on Knowledge Discovery and Data Mining, (2016), 785–794. https://doi.org/10.1145/2939672.2939785 |
| [17] |
S. Li, X. Zhang, Research on orthopedic auxiliary classification and prediction model based on XGBoost algorithm, Neural Comput. Appl., 32 (2020), 1971–1979. https://doi.org/10.1007/s00521-019-04378-4 doi: 10.1007/s00521-019-04378-4
|
| [18] |
M. Covino, C. Sandroni, M. Santoro, L. Sabia, B. Simeoni, M. Bocci, et al., Predicting intensive care unit admission and death for COVID-19 patients in the emergency department using early warning scores, Resuscitation, 156 (2020), 84–91. https://doi.org/10.1016/j.resuscitation.2020.08.124 doi: 10.1016/j.resuscitation.2020.08.124
|
| [19] |
Y. Allenbach, D. Saadoun, G. Maalouf, M. Vieira, A. Hellio, J. Boddaert et al., Development of a multivariate prediction model of intensive care unit transfer or death: A French prospective cohort study of hospitalized COVID-19 patients, PloS one, 15 (2020), e0240711. https://doi.org/10.1371/journal.pone.0240711 doi: 10.1371/journal.pone.0240711
|
| [20] |
S. Mirri, G. Delnevo, M. Roccetti, Is a COVID-19 second wave possible in emilia-romagna (Italy)? Forecasting a future outbreak with particulate pollution and machine learning, Comput., 8 (2020), 74. https://doi.org/10.3390/computation8030074 doi: 10.3390/computation8030074
|
| [21] |
H. Estiri, Z. Strasser, S. Murphy, Individualized prediction of COVID-19 adverse outcomes with MLHO, Sci. Rep., 11 (2021), 5322. https://doi.org/10.1038/s41598-021-84781-x doi: 10.1038/s41598-021-84781-x
|
| [22] |
A. S. Yadaw, Y. Li, S. Bose, R. Iyengar, S. Bunyavanich, G. Pandey, Clinical features of COVID-19 mortality: Development and validation of a clinical prediction model, Lancet Digital Health, 2 (2020), 516–525. https://doi.org/10.1016/S2589-7500(20)30217-X doi: 10.1016/S2589-7500(20)30217-X
|
| [23] |
D. J. Altschul, S. R. Unda, J. Benton, R. de la Garza Ramos, P. Cezayirli, M. Mehler, et al. A novel severity score to predict inpatient mortality in COVID-19 patients, Sci. Rep., 10 (2020), 1–8. https://doi.org/10.1038/s41598-020-73962-9 doi: 10.1038/s41598-020-73962-9
|
| [24] | H. Wang, H. Ai, Y. Fu, Q. Li, R. Cui, X. Ma, et al., Development of an early warning model for predicting the death risk of coronavirus disease 2019 based on data immediately available on admission, Front. Med., (2021), 1302. https://doi.org/10.3389/fmed.2021.699243 |
| [25] | L. Zhang, A. Xu, L. An, M. Li, Bayesian inference of system reliability for multicomponent stress-strength model under marshall-olkin weibull distribution, Systems, (2022). https://doi.org/10.3390/systems10060196 |
| [26] |
Y. Wang, W. Wang, Y. Tang, A Bayesian semiparametric accelerate failure time mixture cure model, Int. J. Biostat., 18 (2021), 473–485. https://doi.org/10.1515/ijb-2021-0012 doi: 10.1515/ijb-2021-0012
|
| [27] | L. Zhuang, A. Xu, B. Wang, Y. Xue, S. Zhang, Data analysis of progressive‐stress accelerated life tests with group effects, Qual. Technol. Quant. Manage., (2022), 1–21. https://doi.org/10.1080/16843703.2022.2147690 |
| [28] | G. S. Rao, M. Aslam, Inspection plan for COVID-19 patients for weibull distribution using repetitive sampling under indeterminacy, BMC Med. Res. Methodol., 21 (2021). https://doi.org/10.1186/s12874-021-01387-7 |
| [29] |
A. Caillon, K. Zhao, K. O. Klein, C. M. T. Greenwood, Z. Lu, P. Paradis, et al., High systolic blood pressure at hospital admission is an important risk factor in models predicting outcome of COVID-19 patients, Am. J. Hypertens., 34 (2021), 282–290. https://doi.org/10.1093/ajh/hpaa225 doi: 10.1093/ajh/hpaa225
|
| [30] |
M. V. Blagosklonny, From causes of aging to death from COVID-19, Aging, 12 (2020), 10004–10021. https://doi.org/10.18632/aging.103493 doi: 10.18632/aging.103493
|
| [31] | G. Wang, C. Wu, Q. Zhang, F. Wu, B. Yu, J. Lv et al., C-Reactive protein level may predict the risk of COVID-19 aggravation, Open Forum Infect. Dis., 7 (2020). https://doi.org/10.1093/ofid/ofaa153 |
| [32] |
F. Ok, O. Erdogan, E. Durmus, S. Carkci, A. Canik, Predictive values of blood urea nitrogen/creatinine ratio and other routine blood parameters on disease severity and survival of COVID‐19 patients, J. Med. Virol., 93 (2020), 786–793. https://doi.org/10.1002/jmv.26300 doi: 10.1002/jmv.26300
|
| [33] |
G. Lippi, C. Lavie, F. Sanchis-Gomar, Cardiac troponin I in patients with coronavirus disease 2019 (COVID-19): Evidence from a meta-analysis, Prog. Cardiovasc. Dis., 63 (2020), 390–391. https://doi.org/10.1016/j.pcad.2020.03.001 doi: 10.1016/j.pcad.2020.03.001
|
| [34] |
B. P. Nguyen, W. Tay, C. Chui, Robust biometric recognition from palm depth images for gloved hands, IEEE Trans. Hum.-Mach. Syst., 45 (2015), 799–804. https://doi.org/10.1109/THMS.2015.2453203 doi: 10.1109/THMS.2015.2453203
|
| [35] |
C. Chang, C. Lin, LIBSVM: A library for support vector machines, ACM Trans. Intell. Syst. Technol., 2 (2011), 1–27. https://doi.org/10.1145/1961189.1961199 doi: 10.1145/1961189.1961199
|
| [36] | G. Ke, Q. Meng, T. Finley, T. Wang, W. Chen, W. Ma, et al., Lightgbm: A highly efficient gradient boosting decision tree, in Proceedings of the 31st International Conference on Neural Information Processing Systems, (2017), 3149–3157. |
| [37] |
N. V. Chawla, K. W. Bowyer, L. O. Hall, W. P. Kegelmeyer, SMOTE: synthetic minority over-sampling technique, J. Artif. Intell. Res., 16 (2002), 321–357. https://doi.org/10.1613/jair.953 doi: 10.1613/jair.953
|
| [38] | F. Pedregosa, G. Varoquaux, A. Gramfort, V. Michel, B. Thirion, O. Grisel, et al., Scikit-learn: sklearn. preprocessing. robustscaler, J. Mach. Learn. Res., 12 (2011), 2825–2830. |
Figures(4) / Tables(6)

Qian Shen. Research of mortality risk prediction based on hospital admission data for COVID-19 patients[J]. Mathematical Biosciences and Engineering, 2023, 20(3): 5333-5351. doi: 10.3934/mbe.2023247

 DownLoad: