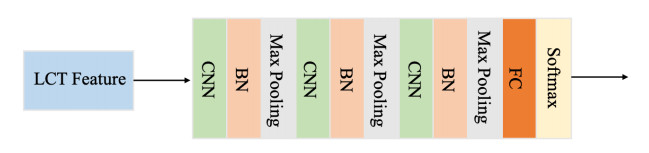
Arrhythmia is one of the common cardiovascular diseases. Nowadays, many methods identify arrhythmias from electrocardiograms (ECGs) by computer-aided systems. However, computer-aided systems could not identify arrhythmias effectively due to various the morphological change of abnormal ECG data. This paper proposes a deep method to classify ECG samples. Firstly, ECG features are extracted through continuous wavelet transform. Then, our method realizes the arrhythmia classification based on the new lightweight context transform blocks. The block is proposed by improving the linear content transform block by squeeze-and-excitation network and linear transformation. Finally, the proposed method is validated on the MIT-BIH arrhythmia database. The experimental results show that the proposed method can achieve a high accuracy on arrhythmia classification.
Citation: Yuni Zeng, Hang Lv, Mingfeng Jiang, Jucheng Zhang, Ling Xia, Yaming Wang, Zhikang Wang. Deep arrhythmia classification based on SENet and lightweight context transform[J]. Mathematical Biosciences and Engineering, 2023, 20(1): 1-17. doi: 10.3934/mbe.2023001
Related Papers:
[1]
Paula Barrett-Brown, Donovan McGrowder, Dalip Ragoobirsingh .
Diabetes education—Cornerstone in management of diabetes mellitus in Jamaica. AIMS Medical Science, 2021, 8(3): 189-202.
doi: 10.3934/medsci.2021017
[2]
Sanaa El–Jamal, Houda Elfane, Imane Barakat, Khadija Sahel, Mohamed Mziwira, Aziz Fassouane, Rekia Belahsen .
Association of socio-demographic and anthropometric characteristics with the management and glycemic control in type 1 diabetic children from the province of El Jadida (Morocco). AIMS Medical Science, 2021, 8(2): 87-104.
doi: 10.3934/medsci.2021010
[3]
Mujeeb Ur Rehman Parrey, Hanaa El-Sayed Bayomy, Fawaz Salah M Alanazi, Asseel Farhan K Alanazi, Abdullah Hamoud M Alanazi, Abdulelah Raka A Alanazi .
Diabetic retinopathy: knowledge, attitudes, and practices among diabetic patients. AIMS Medical Science, 2025, 12(2): 210-222.
doi: 10.3934/medsci.2025013
[4]
Burcin Meryem Atak Tel, Ramiz Tel, Tuba Duman, Satilmis Bilgin, Hamza Kaya, Halil Bardak, Gulali Aktas .
Evaluation of the relationship between the prealbumin/fibrinogen ratio and diabetic nephropathy in patients with type 2 diabetes mellitus. AIMS Medical Science, 2024, 11(2): 90-98.
doi: 10.3934/medsci.2024008
[5]
Hidetaka Hamasaki .
Dog ownership: is it beneficial for physical activity, cardiovascular disease, and diabetes?. AIMS Medical Science, 2020, 7(4): 311-327.
doi: 10.3934/medsci.2020021
[6]
Hidetaka Hamasaki .
Functional Foods for Type 2 Diabetes. AIMS Medical Science, 2016, 3(3): 278-297.
doi: 10.3934/medsci.2016.3.278
[7]
Abdulah Saeed, Alhanouf AlQahtani, Abdullah AlShafea, Abdrahman Bin Saeed, Meteb Albraik .
The impact of telemedicine on cardiac patient outcomes: A study in Saudi Arabian hospitals. AIMS Medical Science, 2024, 11(4): 439-451.
doi: 10.3934/medsci.2024030
[8]
Fatemeh keshavarzi, Mohsen Askarishahi, Maryam Gholamniya Foumani, Hossein Falahzadeh .
Parametric and the Cox risk model in the analysis of factors affecting the time of diagnosis of retinopathy with patients type 2 diabetes. AIMS Medical Science, 2019, 6(2): 170-178.
doi: 10.3934/medsci.2019.2.170
[9]
Marina A. Darenskaya, Elena V. Chugunova, Sergey I. Kolesnikov, Natalja V. Semenova, Olga A. Nikitina, Lyubov I. Kolesnikova .
Lipid peroxidation processes in men with type 1 diabetes mellitus following α-lipoic acid treatment. AIMS Medical Science, 2021, 8(4): 291-300.
doi: 10.3934/medsci.2021024
[10]
Sylvia Kirchengast .
Diabetes and Obesity—An Evolutionary Perspective. AIMS Medical Science, 2017, 4(1): 28-51.
doi: 10.3934/medsci.2017.1.28
Abstract
Arrhythmia is one of the common cardiovascular diseases. Nowadays, many methods identify arrhythmias from electrocardiograms (ECGs) by computer-aided systems. However, computer-aided systems could not identify arrhythmias effectively due to various the morphological change of abnormal ECG data. This paper proposes a deep method to classify ECG samples. Firstly, ECG features are extracted through continuous wavelet transform. Then, our method realizes the arrhythmia classification based on the new lightweight context transform blocks. The block is proposed by improving the linear content transform block by squeeze-and-excitation network and linear transformation. Finally, the proposed method is validated on the MIT-BIH arrhythmia database. The experimental results show that the proposed method can achieve a high accuracy on arrhythmia classification.
1.
Introduction
Nitrogen removal from wastewater is a critical process in environmental engineering, particularly due to the adverse effects of nitrogenous compounds on aquatic ecosystems and human health. Traditional methods, such as nitrification and denitrification, have been widely employed to mitigate nitrogen pollution. However, these processes often require significant energy inputs and can lead to the production of greenhouse gases, such as nitrous oxide (N2O). In recent years, the anammox (anaerobic ammonium oxidation) process has gained attention as a more sustainable alternative, allowing for the direct conversion of ammonium and nitrite into nitrogen gas under anaerobic conditions, thereby reducing the overall energy demand and greenhouse gas emissions associated with nitrogen removal [1,2,3,4,5]. Although this innovative biological strategy holds significant technological and economic promise, its application is challenging primarily due to the slow growth rate of anammox bacteria and their sensitivity to various external factors. Combining nitritation and anammox in biofilm or granular reactors has been suggested as a strategy to overcome these challenges [6,7].
Membrane aerated biofilm reactors (MABRs) have emerged as a new type of biological wastewater treatment process for enhancing nitrogen removal efficiency. They utilize a gas-permeable membrane to supply oxygen directly to the biofilm from the membrane substratum against the concentration gradients of carbon and nitrogen substrate within the biofilm. The counter-diffusion mass transfer characteristics allow MABRs to establish an aerobic zone adjacent to the membrane substratum and an anoxic/aerobic region close to the bulk liquid/biofilm interface to achieve simultaneous nitrification and nitrogen removal within the biofilm. The typical nitrogen removal pathways include conventional nitrification and denitrification (CND) (NH+4−N→NO–3N⟶N2), the shortcut nitrogen removal or more concisely the nitritation-denitritation (ND) (NH+4−N→NO–2N→N2), and partial nitritation-anammox (PN/A) (NH+4−N+NO–2N→N2). Compared to CND, ND can save 25% of oxygen for nitrification and 40% of organic carbon substrate for denitrification, while PN/A can reduce oxygen consumption by 62% and organic carbon substrate consumtion by 100% [8,9]. Studies have shown that MABRs can achieve 30% to 97% nitrogen removal for influent total nitrogen concentrations ranging from 15gm−3 to 2500gm−3, Chemical Oxygen Demand (COD) (the amount of oxygen required to chemically oxidize organic and inorganic substances in a water sample) concentrations from 7gm−3 to 5620gm−3, MABR aeration pressure from 0.3 to 152kPa via pathways including CND, ND, and PN/A [8]. Furthermore, a variety of studies have demonstrated that with proper control of the oxygen supply and carbon to nitrogen ratio, MABRs can achieve effective nitrogen removal via ND and anammox [10,11,12,13]. While the counter-diffusion characteristics of MABRs have been shown to effectively support the growth of bacteria involved in nitrogen removal, controlling the distribution of oxygen and substrates within the biofilm in practical applications remains challenging. This control is crucial for stimulating ecological niches that promote ND and PN/A nitrogen removal functions within the biofilm. For instance, surpassing the growth of nitrite-oxidizing bacteria (NOB) is necessary to foster efficient ND and PN/A nitrogen removal. On the other hand, the enrichment of NOB, influenced by substrate and oxygen supply as well as biofilm thickness, can shift nitrogen removal pathways from ND and PN/A to CND, reducing overall nitrogen removal efficiency. Therefore, to optimize energy-efficient ND and PN/A nitrogen removal with MABRs, a comprehensive understanding of the interactions between oxygen and substrate supply, the distribution of oxygen and nitrogenous intermediates within the biofilm, and the underlying nitrogen removal mechanisms is essential.
Since it is challenging to experimentally characterize the distributions of oxygen, substrates, microbial populations, and their physiological interactions within the biofilm, along with biofilm thickness, mathematical modeling is pivotal for studying the potential of the anammox process and understanding the mechanisms responsible for maintaining high anammox activity. Existing theoretical studies frequently utilize one-dimensional biofilm models within the framework of the 1D Wanner–Gujer model [14], which operates under the assumption that biomass volume fractions sum to unity (a reasonable assumption for well-developed, homogeneously stratified biofilms with co-diffusional substrate supply), or they employ kinetic-based models [11,13,15,16,17,18,19]. Among these works, Li et al. [11] developed a one-dimensional multispecies model that included anammox bacteria, AOB, NOB, and aerobic heterotrophic bacteria (HB) to study the effects of temperature, aeration pressure, and COD/N ratio on nitrogen removal mechanisms in MABRs. Their results demonstrated that increasing the C/N ratio and controlling aeration pressure could balance the competition between AOB, NOB, and aerobic heterotrophs for oxygen, ultimately enhancing ND nitrogen removal. Hao et al. [16] developed a model to evaluate the influence of variable temperature, ammonium loading rates, and dissolved oxygen concentrations on a full autotrophic N-removal process in an aerated biofilm reactor. Their results indicated that temperature and inflow variations negatively influence the N-removal efficiency due to limited activity of anammox bacteria and an unbalance between applied ammonium surface load and required oxygen concentration, respectively. Moreover, they showed that at a constant temperature and a defined ammonium surface load, there is an optimal biofilm thickness to achieve the maximal N-removal efficiency. Recently, Liu et al. [18] proposed a one-dimensional model that considered the impact of anammox and nitrite/nitrate-dependent anaerobic methane oxidation (n-DAMO) on nitrogen removal in MABRs. Their findings revealed that the distribution of anammox and n-DAMO within the biofilm, along with controlled methane supply under regulated partial pressure, could enhance nitrogen removal efficiency.
The assumption in the 1D Wanner-Gujer model is often valid, particularly for well-developed biofilms in nutrient-rich environments. Studies have shown that under these conditions, biofilm models without this assumption still predict biomass volume fractions close to unity [20]. Nevertheless, it is well-known that the biomass in biofilms does not uniformly reach the same volume fraction throughout, particularly in cases of cell lysis or nutrient limitation, which lead to the development of internal regions with significantly reduced cell density. Models that assume the total biomass volume fraction is constant and sums to unity at all locations are inherently unable to capture this phenomenon and will instead predict biofilm shrinkage or contraction [21,22]. Moreover, studies have revealed that extracellular polymeric substances (EPS) which play a crucial role in determining biofilm density are not uniformly distributed across the biofilm thickness and, additionally, the chemical composition of EPS can be influenced by the oxygen loading rates [23]. Furthermore, imposing the constraint that the sum of all biomass volume fractions must equal unity significantly restricts the model's ability to accurately predict the spatial distribution and interactions of different microbial species within the biofilm [24]. The limitation of kinetic-based models lies in their insufficient spatial resolution, which hinders their ability to accurately describe the heterogeneity of biofilms. Therefore, implementing a high-dimensional, comprehensive mathematical model, without the limitations of the Wanner-Gujer model, is essential to capture biofilm heterogeneity driven by counter-diffusion mechanisms. This approach will provide insights into the fundamental processes governing the behavior of MABRs and facilitate the investigation of anammox's role in nitrogen removal under diverse environmental conditions. Considering these factors and addressing the existing gap in the literature, where, to the best of our knowledge, no comprehensive study has been conducted on nitrogen removal and the potential of anammox, this study employs a two-dimensional partial differential equation (PDE) model to investigate the influence of environmental conditions on nitrogen removal in MABRs, with particular emphasis on anammox processes.
2.
Mathematical model
For a comprehensive analysis of nitrogen removal, particularly incorporating the anammox process in MABRs, we extend the model proposed in [25] to account for the roles of anammox and NOB in the nitrogen removal process. The model is governed by a system of degenerate reaction-diffusion equations over the computational domain Ω⊂R2, which describes biofilm growth and substrate dynamics. To formulate the model, the multi-component biofilm is assumed to consist of inert bacteria (In), ammonium oxidizing bacteria (AOB), aerobic heterotrophic bacteria (HB), anaerobic heterotrophic bacteria (AHB), NOB, and anammox. We also assume that oxygen is supplied through the boundary of the domain on which the biofilm forms, mimicking a membrane there, while the other substrates are introduced from the opposing boundary of the domain indicating that a counter-diffusion mechanism is involved. Since flow field calculations are often significantly more computationally expensive than simulating the actual biofilm growth process, we neglect the hydrodynamic effects and the convective contribution to substrate transport in the aqueous phase. Instead, we consider a hydrostatic environment where nutrients are supplied or removed through the membrane and the concentration boundary layer (introduced in the boundary conditions, Eq (2.2)). Hence, we assume that nutrients are transported to the biofilm from the aqueous phase by a diffusion gradient, more specifically by Fickian diffusion. The dependent variables include the volume fractions of bacterial species: I (In), Ba (AOB), Bh1 (HB), Bh2 (AHB utilizing nitrite), Bh3 (AHB utilizing nitrate), Bn (NOB), and Ban (anammox). Additionally, the model tracks the concentrations of dissolved substrates, including ammonium nitrogen N1, nitrite nitrogen N2, nitrate nitrogen N3, oxygen O, and organic substrate acetate A. The independent variables are time and spatial location which are denoted by t≥0 and (x,y)∈Ω respectively. A summary of biofilm components, dissolved substrates, and the corresponding variables is given in Table 1.
Table 1.
Summary of the biofilm components, dissolved substrates, and the corresponding variables used in the model.
The two-dimensional computational domain, denoted as Ω, is composed of two regions:
Ω1(t)={(x,y)∈Ω⊂R2:M(x,y,t)>0},
which characterizes the biofilm with positive biomass density, and
Ω2(t)={(x,y)∈Ω⊂R2:M(x,y,t)=0},
representing the aqueous phase (bulk liquid, channels, and biofilm pores without biomass), c.f. Figure 1. These regions are separated by the biofilm-liquid interface Γ(t)=∂ˉΩ1(t)∩∂ˉΩ2(t). Ω1 may consist of several disconnected sub-regions, each representing a distinct biofilm colony, which can merge as they grow. Hence, the regions Ω1 and Ω2 are not necessarily connected and Γ can consist of several disjoint segments, c.f. Figure 1b. The time-dependence of these regions arises from biofilm structural changes due to growth. Following the previous studies [20,26,27,28,29], etc. The diffusion coefficient for all biomass fractions is defined as D(M)=δM4(1−M)4m2d−1, where δm2d−1 is the biomass motility coefficient, which is positive but significantly smaller than the diffusion coefficients of dissolved substrates in the liquid phase. The function D(M) exhibits two non-linear effects: (ⅰ) a power-law degeneracy similar to the porous medium equation, such that D(M) approaches zero as M≈0, and (ⅱ) a super-diffusion singularity as M approaches unity. The porous medium degeneracy term, M4, ensures that biofilm spreading is minimal when biomass density is low, i.e., 0<M≪1, and is responsible for the formation of a sharp interface between the biofilm and the surrounding liquid. This guarantees that initial conditions with compact support lead to solutions with compact support. The second effect, (ⅱ), enforces an upper bound on the solution, ensuring that M remains below unity, as demonstrated in [30]. This is counteracted by the degeneracy as M=0 at the interface. Consequently, M becomes concentrated within the biofilm region and approaches its maximum value 1. Hence, the interaction between these non-linear diffusion effects and the growth term is essential for accurately describing the spatial spread of biomass [31]. The diffusion coefficients for substrates are also dependent on biomass density, however in a less critical manner. These are expressed as
Figure 1.
Schematic of the computational domain Ω⊂R2 with liquid and biofilm region for (a) flat layer and (b) sparse biofilm inoculation. The arrows show the direction of substrate fluxes through the boundaries.
where D0(n1,n2,n3,o,a)>0 represents the diffusion coefficient in water, and ρ(n1,n2,n3,o,a), with 0<ρ(n1,n2,n3,o,a)≤1, denotes the biofilm-to-water diffusivity ratio. As a result, these diffusion coefficients are bounded from below and above by finite values within one order of magnitude.
The reactions included in our model are:
● R1, R2: These terms represent biomass loss occurring through two primary mechanisms: lysis and endogenous respiration. Lysis is characterized as a first-order process with a constant loss rate denoted by d(a,h1,h2,h3,n,an), while endogenous respiration follows Monod kinetics with maximum oxidation rates r(a,h,n) and half-saturation constants κao, κho, and κno for autotrophic, heterotrophic, and nitrite oxidizing bacteria, respectively. Note that shear-induced deformation and detachment have been excluded in this model. Although the concentration boundary layer, which will be incorporated into the boundary conditions for substrates, is qualitatively related to the bulk flow velocity, it will be set to a value that does not simulate rapid flow in subsequent simulations. Therefore, together with the size of the computational domain used in this study, it is reasonable to neglect shear induced deformation and detachment and account for biomass loss only through lysis and endogenous respiration [32].
● R3: Growth of ammonium oxidizing bacteria (Ba) which is regulated by ammonium and oxygen and is characterized by dual Monod kinetics with the maximum growth rate μa and half-saturation constants κao for oxygen and κn1 for ammonium.
● R4: Growth of aerobic heterotrophic bacteria (Bh1) controlled by availability of oxygen and acetate. This is described by dual Monod kinetics with the maximum growth rate μh and half-saturation constants κho and κa for oxygen and acetate respectively.
● R5, R6: Growth of anaerobic heterotrophic bacteria (Bh2, Bh3) utilizing nitrite and nitrate in the presence of acetate under anoxic condition. These terms are described by oxygen inhibition and acetate, nitrite, and nitrate dependent Monod kinetics with ηdμh as the maximum growth rate and κho, κa, κhn2, and κhn3 as oxygen, acetate, nitrite, and nitrate half saturation constants respectively.
● R7: Growth of nitrite oxidizing bacteria (Bn) regulated by oxygen and nitrite and characterized by dual Monod kinetics with the maximum growth rate μn and half saturation constants κno for oxygen and κnn2 for nitrite.
● R8: Growth of anammox that occurs under anoxic condition and in the presence of ammonium and nitrite and is described by oxygen inhibition and ammonium and nitrite dependent Monod kinetics with μan as the maximum growth rate and κano, κann1 and κann2 as half saturation constants for oxygen, ammonium and nitrite respectively.
● R9−1: Ammonium consumption by AOB and conversion into nitrite with the yield coefficient Ya.
● R9−2: Degradation of ammonium via anammox with the yield coefficient Yan.
● R10−1, R10−2: Degradation of nitrite and its conversion into nitrate through NOB and anammox with the yield coefficients Yn and Yan respectively.
● R10−3: Shortcut nitrogen removal (ND) with the yield coefficient Yh2.
● R11: CND with the yield coefficient Yh3.
● R12, R13: Oxygen and acetate consumption.
To study the mathematical model (2.1) we restrict ourselves to the rectangular domain Ω=[0,L]×[0,H]. The substratum, i.e., the membrane surface on which biofilm colonies form and through which oxygen is supplied is the bottom boundary, y=0. We assume that the substratum is impermeable to biomass and dissolved substrates (N1, N2, N3, A) cannot diffuse out of the domain through this segment. For the remaining three sides of the domain, y=H, x=0,L, we use the open boundaries conditions discussed in [33]. At the lateral boundaries, x=0 and x=L, we assume a symmetry boundary condition for biomass species and substrates, which allows us to view the domain as a part of a continuously repeating larger domain. The condition posed at these boundaries is a homogeneous Neumann condition. To mimic the counter-diffusion substrate delivery, non-homogeneous Robin conditions are specified for ammonium and acetate at the top boundary while the homogeneous Neumann condition is imposed at the bottom boundary to reflect a hydrophobic membrane which does not permit these substances to diffuse through the membrane. The Robin conditions at the top boundary quantify mass transfer into the system, c.f. [33]. For oxygen, the boundary conditions at the top and bottom are non-homogeneous Robin conditions. Oxygen is added through the bottom and removed through the top boundary. However, we assume that it is not completely washed out at the top segment of the domain. Additionally, it is assumed that nitrite and nitrate are washed out through the top boundary, hence a homogeneous Neumann boundary condition is imposed. Biomass is assumed to be unable to exit the domain through the top and bottom boundaries, thus homogeneous Neumann conditions are defined, as in [33]. These conditions introduce the counter-diffusion effect on which membrane aerated biofilm reactors are based. The boundary conditions on domain Ω=[0,L]×[0,H] are defined as:
Here, λ(⋅)mm represents the concentration boundary layer thickness, which accounts for the influence of bulk hydrodynamics on mass transfer into and out of the simulation domain. Smaller values of λ indicate rapid bulk flow, whereas low bulk flow velocity leads to a thicker concentration boundary layer [33]. Typically, the concentration boundary layer thickness varies between y=0 and y=H. However, for the sake of simplicity, we assume that all substrates share the same concentration boundary layer thickness at both the top and bottom boundaries, denoted as λo=λn1=λn2=λn3=λa=λ.
3.
Numerical treatment
For the numerical simulation, we first non-dimensionalize the partial differential equation (PDE) system described in Eq (2.1). We use the height of the computational domain and the maximum growth rate of AOB as scaling factors for space and time, respectively, defined as ˜x=x/H and ˜t=tμa. The substrate concentrations are non-dimensionalized using the following scaling factors:
˜N1=N1N1∞,˜N2=N2N1∞,˜N3=N3N1∞,˜O=OO∞ and ˜A=AA∞.
Note that the biomass volume fractions I, Ba, Bh1, Bh2, Bh3, Bn, and Ban have already been defined as dimensionless variables relative to the maximum cell density M∞. Subsequently, we introduce a uniform grid for the rectangular domain [0,1]×[0,H/L] to discretize the dimensionless PDE model by cell centered finite difference-based finite volume scheme. For time integration of the resulting semi-discrete model, we employ the time-adaptive, error-controlled embedded Rosenbrock-Wanner method ROS3PRL, as introduced by Rang [34]. The method requires in each time-step the solution of several sparse, large, nonsymmetirc linear systems, for which we use the stabilized bi-conjugate gradient method. The numerical method has been implemented in Fortran 95. OpenMP was used for the parallelization of selected computationally expensive tasks, such as the linear solver and the formation of the Jacobian matrix within the Rosenbrock-Wanner method, and for the evaluation of non-linear reaction terms. The method's ability to proceed with efficient time-steps for interface moving problems with similar nonlinearities as those in model (2.1) has been extensively studied in [22,29,35] and we refer the reader to these references for detailed description of numerical challenges and the applied numerical algorithm.
Remark 3.1.Note that the model represented in Eq (2.1) is a two-dimensional PDE model capable of capturing biofilm heterogeneity arising from an initially sparse inoculation (Figure 1b). Previous studies [25,26,36,37] have demonstrated the advantages of using high-dimensional models to accurately depict biofilm development from a realistic initial inoculum and to characterize internal biofilm heterogeneity in MABRs. However, as the overall performance of MABRs is generally not highly sensitive to initial inoculation or internal biofilm heterogeneity [26,36], we simplified our approach in this study by assuming that biofilm layers homogeneously cover the substratum. This scenario can be effectively captured by a one-dimensional reduced model derived from the proposed PDE system while avoiding the limitations of the Wanner-Gujer model. Although this study primarily focuses on the impact of operational and environmental conditions on nitrogen removal pathways, it lays a strong foundation for future model development that accounts for internal heterogeneity and spatial variations within the biofilm. This will be essential for addressing questions where spatial heterogeneity plays a critical role.
The parameters and their values used in computer simulations are summarized in Table 2.
Table 2.
Model parameters for system (2.1) used for computer simulation.
It has been shown in [26,36] that while variations in the initial biofilm inoculation and internal heterogeneity may influence its internal structure, these factors generally do not have a substantial impact on the overall performance of MABRs. Therefore, in this study, we employ a flat layer coverage of the substratum to investigate nitrogen removal through different pathways as it is a more relevant case from a biofilm reactor performance perspective. Although biofilm structure is highly sensitive to environmental conditions, making the formation of a specific structure challenging, the counter-diffusion mechanism inherent in MABRs allows for layered configurations to be utilized in experimental studies [41]. Consequently, we assume that the substratum is initially covered by a flat layer of Ba, Bh1, Bh2, Bh3, Bn, and Ban, arranged from the membrane surface (bottom segment of the domain) to the top, respectively. The initial thickness of each bacterial layer is set to 10μm. Furthermore, since varying the sequence of biofilm layers has minimal impact on nitrogen removal [26], we adopted the AOB-HB-AHB-NOB-anammox layer configuration to enhance the clarity of AHB distribution within the biofilm and to better observe the development of biofilm layers over time. For the numerical simulations, the bulk concentration of oxygen, O∞, is varied from 0.25gm−3 to 5gm−3, and the bulk concentrations of ammonium nitrogen and acetate are selected within the ranges N1∞=5−400gm−3 and A∞=6−100gm−3, respectively. The bulk concentration of oxygen is the dissolved oxygen concentration at the interface of the biofilm and membrane substratum. Since a low oxygen supply is essential to stimulate ND and PN/A nitrogen removal, this study focuses on the relatively low O∞ conditions ranging from 0.25gm−3 to 5gm−3, which corresponds to the oxygen partial pressures of 0.57kPa and 11.3kPa for the Henry's law constant of 0.001378mol/L/atm. The N1∞ and A∞ are the concentrations of ammonium nitrogen and acetate in the bulk liquid. For a complete mix MABR, these concentrations represent the ones in the reactor effluent. The combinations of N1∞ and A∞ used in the simulations include A∞=6gm−3 for N1∞=5,10,15,100,200,400gm−3; and N1∞=15,100gm−3 for A∞=6,30,100gm−3. These combinations are selected to represent the secondary effluent from biological wastewater treatment and the return liquid from the anaerobic digestate and the municipal wastewater. The secondary effluent and the return liquid normally have low readily biodegradable COD and moderate to high ammonium concentrations, while the municipal wastewater has a moderate readily biodegradable COD and ammonium content. The ammonium nitrogen concentration in typical municipal wastewater and in the effluent from secondary treatment processes that do not include nitrification usually ranges from 10gm−3 to 50gm−3. In contrast, the return liquid from anaerobic digestate treating wastewater sludge can contain ammonium nitrogen concentrations between 500gm−3 and 1500gm−3[42]. The concentrations of ammonium and acetate in the effluent discharged from the MABR reactor will depend on the substrate loading rates and the removal efficiency of the reactor. The thickness of the biofilm is a critical factor determining the microbial composition, oxygen transfer efficiency and biological functions of a biofilm in MBfR [43]. An overgrown biofilm will increase the resistance of substrate and oxygen diffusion, which could be deleterious to the micro-environment needed for the growth of bacteria within the biofilm. On the other hand, studies have shown that achieving a biofilm thickness between 500μm to 1000μm can facilitate simultaneous nitrification and denitrification [12,44,45]. With the biofilm thickness in such a range, complete oxygen penetration through the biofilm can be avoided so that an anoxic zone and an aerobic zone can co-exist within the biofilm to promote the growth of heterotrophic denitrifiers and autotrophic nitrifiers. Thus, in the subsequent numerical studies (except in part of Section 4.5), simulations are terminated when the biofilm occupies 30% of the domain, i.e., when the biofilm thickness reaches 600μm.
3.2. Postprocessing and quantities of interest
For better interpretation of simulation results, we will quantify the influence of environmental conditions on biofilm development and the contributions of various nitrogen removal pathways through the definition of the following lumped output variables:
4.1. The effect of ammonium and oxygen concentrations on biomass distribution within the biofilm
To examine the influence of environmental factors, particularly the bulk concentrations of oxygen and ammonium, on the growth dynamics of different biomass species, we implement a systematic variation in the values of N1∞ and O∞. The ammonium bulk concentration is set to N1∞=5,10,15,100,200,400gm−3 and oxygen bulk concentration is adjusted to O∞=0.25,0.5,1,2.5,5gm−3 for each ammonium concentration. The acetate bulk concentration is maintained at a constant A∞=6gm−3 and the system is analyzed once the biofilm reaches a thickness of 600μm. The results, depicted in Figure 2, indicate that at the lowest oxygen concentration (O∞=0.25gm−3), biofilm growth is limited and it predominantly consists of heterotrophic bacteria (Bh1), which have a competitive advantage under oxygen-limited conditions over AOB (Ba). Although increasing ammonium concentration leads to an increase in AOB, their contribution remains minimal relative to other species, with Bh1 continuing to be the dominant component. Increasing the oxygen concentration from 0.25gm−3 to 0.5gm−3 enhances biofilm growth and AOB production, however the rate of AOB production is still insignificant across all ammonium concentrations, and the biofilm remains largely occupied by other species mainly Bh1. Further elevation of oxygen to 1gm−3 facilitates formation of more AOB, which, through oxygen depletion and nitrite production, stimulates the growth of Bh2 and Bh3. Increasing oxygen to 2.5gm−3 promotes AOB growth, leading to greater nitrite and nitrate production and subsequently supporting the growth of Bh2 and Bh3, which utilize acetate and thereby reduce the growth rate of Bh1. Under ammonium-limited condition (N1∞=5gm−3), further increase in oxygen concentration from 2.5gm−3 results in an overall decrease in total biomass. At higher oxygen concentration (O∞=5gm−3), the activity of Ba increases, resulting in greater N2 production. However, since the growth of Ba is limited due to ammonium shortage, high oxygen inhibits the formation of an anoxic zone and reduces the activity of Bh2, which competes with Bn for N2. This leads to increased formation of Bn and, consequently, more N3 production. Nevertheless, under high oxygen concentration, the growth rate of Bh3, which occurs in the anoxic zone, decreases. This results in the formation of less Bh3 compared to the lower oxygen condition (O∞=2.5gm−3), and a reduction in the total biomass. Oxygen availability for Bh1 increases at O∞=5gm−3 which competes with Bh2 and Bh3 for acetate. This leads to Bh1 and Bh3 becoming the dominant heterotrophic species within the biofilm at O∞=5gm−3. Results in Figure 2 demonstrate that higher ammonium concentrations at O∞=5gm−3 correlate with a monotonic increase in total biomass volume fraction, albeit with varying contributions from each species. Increased oxygen concentrations enhance the formation of AOB and Bh3, while causing slight modification in the production of Bn. In summary, at a concentration of A∞=6gm−3, AOB is enriched at O∞≥1gm−3, shortcut denitrifier (Bh2) at O∞ between 1gm−3 and 2.5gm−3, and denitrifier (Bh3) at O∞≥2.5gm−3. The fractions of anammox and NOB (Bn) remain consistently low across all tested bulk concentrations of ammonium nitrogen and oxygen.
Figure 2.
Total amount of biomass volume fractions within the biofilm for different values of oxygen bulk concentration and N1∞=5, 10, 15, 100, 200, and 400gm−3.
4.2. The influence of oxygen and ammonium nitrogen bulk concentrations on nitrogen removal
In MABRs, nitrogen is removed through various pathways. The biofilm's sensitivity to environmental conditions, coupled with the counter-diffusion mechanism in MABRs, makes it challenging to predict which pathway will dominate and how the others can be optimized to enhance the reactor's performance. To explore how environmental factors influence total nitrogen removal and the activity of each bacterial species, we vary the bulk concentrations of oxygen and ammonium and compute the total nitrogen degradation/conversion through the pathways incorporated in model (2.1) when the biofilm occupies 30% of the computational domain (biofilm thickness = 600μm). Ammonium nitrogen and oxygen concentrations are set to N1∞=5,10,15,100,200,400gm−3 and O∞=0.25,0.5,1,2.5,5gm−3, respectively, while the acetate bulk concentration is held constant at A∞=6gm−3. As illustrated in Figures 3 and 4, the minimum nitrogen removal occurs at O∞=0.25gm−3 across all ammonium concentrations, primarily via the anammox pathway, underscoring the importance of sufficient oxygen availability for effective nitrogen removal. Increasing the oxygen concentration to O∞=0.5gm−3 and ammonium nitrogen concentration enhance the activity of autotrophic bacteria, slightly improving nitrification and making PN/A and ND (via Bh2) the primary contributors to nitrogen removal. Further increase in oxygen concentration promotes the growth rate of AOB, which enhances nitrification and the metabolism of Bh2 and anammox (due to increased nitrite nitrogen formation), thereby improving total nitrogen removal mainly through ND and PN/A pathways. As oxygen concentration reaches O∞=2.5gm−3, the metabolic activity of AOB further increases, resulting in higher nitrification rates and more nitrite nitrogen production. This leads to increased nitrogen removal via ND, followed by CND at N1∞=5gm−3 (due to promotion of conversion of NO2 to NO3 via NOB) and PN/A at higher ammonium concentrations. Note that NOB activity decreases as N1∞ increases due to the outgrowth of Bh2 in competition with other species for nitrite nitrogen and acetate. When the oxygen concentration is further increased to O∞=5gm−3, the formation of an anoxic zone is delayed, thereby reducing the activity of Bh2 and Bh3, which lead to a decrease in total nitrogen removal despite increased nitrification. Under ammonium-limited (N1∞=5gm−3) and oxygen-rich conditions, NOB outgrow species competing for nitrite, promoting the growth of Bh3 and making CND the major pathway for nitrogen removal. As N1∞ increases, NOB activity declines, reducing nitrogen removal via CND due to the decreased growth of Bh3, and shifting the main nitrogen removal pathways to PN/A and ND. Overall, the simulation results indicate that effective nitrogen removal is only achievable at O∞>1gm−3, with an optimal range for ND and PN/A nitrogen removal observed between O∞=1gm−3 and 2.5gm−3 under the conditions of N1∞=10−400gm−3 and A∞=6gm−3.
Figure 3.
Nitrogen removal via anammox (PN/A), shortcut denitrification (ND), and CND (NR1, NR2, and NR3 respectively) at different values of oxygen bulk concentrations and N1∞=5, 10, 15, 100, 200, and 400gm−3.
Figure 4.
Nitrification, total amount of conversion of nitrite nitrogen to nitrate nitrogen through NOB, and total nitrogen removal (NRT) at different values of oxygen bulk concentrations and N1∞=5, 10, 15, 100, 200, and 400gm−3.
To facilitate comparison of the results shown in Figures 3 and 4, the numerical data are summarized in Table 3, where NR1NRT, NR2NRT, and NR3NRT represent the contributions of PN/A, ND, and CND nitrogen removal, respectively, to total nitrogen removal and NRTNitrification is the ratio of total nitrogen removal to nitrification. Key trends observed from the simulations under varying concentrations of N1∞ include (1) approximately 95% nitrogen removal occurs via the PN/A pathway at O∞=0.25gm−3; (2) PN/A and ND contribute equally at O∞=0.5gm−3; (3) at O∞=1gm−3, 80%–90% of nitrogen removal is achieved via ND, although its contribution decreases as N1∞ increases; (4) at O∞=2.5gm−3, the PN/A pathway contributes 4.1%–22.5%, while ND accounts for 50.8%–74.4% of total nitrogen removal. The contribution of PN/A increases as N1∞ rises, while the effect of ND reduces for N1∞>5gm−3, and (5) at O∞=5gm−3, 99% of nitrogen removal is achieved via CND at N1∞=5gm−3, but its contribution decreases to 82.9% at N1∞=10gm−3, and further to 52.4%, 25.2%, 24.2%, and 23.9% at N1∞=15,100,200,400gm−3, respectively. When nitrogen removal is dominated by the PN/A and ND pathways, the value of NRTNitrification can be equal to or exceed 1 due to the contribution of the PN/A pathway. Furthermore, it is important to note that the impact of N1∞ on nitrogen removal pathways and NRTNitrification becomes negligible for N1∞>100gm−3.
Table 3.
Nitrogen removal efficiency and contribution of each pathway in total nitrogen removal.
4.3. Oxygen consumption under varying ammonium concentrations
Aeration is the most energy-intensive process in biological nutrient removal wastewater treatment plants, accounting for approximately 50%–90% of the total energy consumption [46]. Consequently, oxygen demand emerges as a critical factor influencing the overall energy efficiency of MABRs. Since providing higher concentrations of oxygen results in higher energy usage which is not cost-effective, it is essential to elucidate the impact of oxygen levels on nitrogen removal mechanisms and to develop strategies for enhancing MABR performance without increasing oxygen input. In this section, we investigate oxygen consumption through different oxygen dependent mechanisms within the proposed model to identify the primary contributors under different environmental conditions. Specifically, we vary the bulk concentrations of ammonium and oxygen as N1∞=5,10,15,100,200,400gm−3 and O∞=0.25,0.5,1,2.5,5gm−3, while maintaining the acetate bulk concentration at A∞=6gm−3.
Figure 5 illustrates the total oxygen consumption and the contributions of each oxygen-dependent mechanism at a biofilm thickness of 600μm. At O∞=0.25gm−3, oxygen consumption is minimal, with heterotrophic bacteria (Bh1) being the primary oxygen consumers due to their competitive growth advantage over autotrophic bacteria under oxygen-limited conditions. As the oxygen concentration increases to O∞=0.5gm−3, AOB growth is stimulated, particularly at higher ammonium nitrogen concentrations, leading to increased total oxygen consumption. Further increasing the oxygen concentration to O∞=1gm−3 enhances AOB activity, promoting the growth of acetate-utilizing anaerobic heterotrophic bacteria (AHB), which in turn reduces the abundance of HB and establishes AOB as the dominant oxygen consumers. A subsequent increase in oxygen concentration marginally boosts the growth of nitrifying organisms (NOB), especially at higher ammonium nitrogen levels, resulting in increased total oxygen consumption, nevertheless AOB production continues to be the major pathway for oxygen uptake.
Figure 5.
Total amount of oxygen consumption and contribution of each pathway at different values of oxygen bulk concentrations and N1∞=5, 10, 15, 100, 200, and 400gm−3.
In conclusion, the simulation results indicate that oxygen consumption is insensitive to the increase in N1∞ from 10gm−3 to 400gm−3. At O∞=0.25gm−3, where anammox nitrogen removal is the dominant pathway, the oxygen consumption is approximately 0.1gO2/m2/d. When nitrogen removal occurs primarily through PN/A and ND pathways at O∞=0.5gm−3, oxygen utilization increases to about ≈0.2gO2/m2/d. At O∞=1gm−3 and O∞=2.5gm−3, where ND nitrogen removal is dominant, oxygen uptake reaches approximately 0.4 and 1.1gO2/m2/d, respectively. The highest oxygen consumption, approximately ≈2.2gO2/m2/d, occurs at O∞=5gm−3 when the conventional nitrogen removal is dominant. Noteworthy here is that the contribution of endogenous respiration remains negligible across all scenarios.
4.4. Impact of organic substrate on nitrogen removal under varying ammonium and oxygen levels
To thoroughly assess the impact of environmental conditions on nitrogen removal, this section explores how variations in acetate bulk concentration influence the efficiency of each nitrogen degradation pathway. Specifically, we calculate nitrogen removal via different mechanisms at N1∞=15,100gm−3, O∞=0.25,0.5,1,2.5,5gm−3, and A∞=6,30,100gm−3. Results obtained at the biofilm thickness 600μm are illustrated in Figures 6 and 7. Moreover, a summary of total nitrogen removal (NRT) for different scenarios, is provided in Table 4. At A∞=6gm−3, the highest nitrogen removal rates are 0.16gN/m2/d for N1∞=15gm−3 and 0.17gN/m2/d for N1∞=100gm−3, both occurring at O∞=2.5gm−3. When A∞ is increased to 30gm−3, the maximum nitrogen removal rates rise to 0.47gN/m2/d and 0.54gN/m2/d for N1∞=15gm−3 and N1∞=100gm−3, respectively, at O∞=5gm−3. However, further increases in A∞ to 100gm−3, lead to significant reductions in maximum nitrogen removal rates, falling to 0.076gN/m2/d for N1∞=15gm−3 and 0.089gN/m2/d for N1∞=100gm−3 at O∞=5gm−3. At A∞=6gm−3, nitrogen removal increases by increasing O∞ from 0.25gm−3 to 2.5gm−3, driven primarily by ND nitrogen removal and enhanced nitrification. However, at O∞=5gm−3, CND becomes dominant due to increased NO2 to NO3 conversion by NOB (Bn) at N1∞=15gm−3. Conversely, at N1∞=100gm−3, oxygen concentration is reduced by the growth of AOB, which limits NOB activity, making ND the dominant pathway and decreasing total nitrogen removal. The results suggest that at A∞=6gm−3, total nitrogen removal is sensitive to oxygen availability across N1∞ values from 15gm−3 to 100gm−3. At A∞=30gm−3, nitrogen removal rates remain low until O∞>2.5gm−3, limited by AOB growth and nitrification. At O∞=0.25 to 1gm−3, increasing A∞ from 6gm−3 to 30gm−3 leads to increased growth of aerobic heterotrophic bacteria (Bh1), which outcompete AOB for oxygen, making nitrification the limiting step in nitrogen removal. Increasing O∞ to 2.5gm−3, enhances the nitrification rate due to the proliferation of AOB. However, raising A∞ from 6gm−3 to 30gm−3 promotes the growth of aerobic heterotrophic bacteria (Bh1), which surpass AOB and NOB in oxygen competition. This competition reduces the contribution of CND, thereby decreasing nitrogen removal. Nonetheless, nitrogen removal improves at O∞=5gm−3. At A∞=100gm−3, although nitrification increases with increase in O∞, nitrogen removal rates across O∞=0.25gm−3 to 5gm−3 are significantly lower than those achieved at A∞=6 and 30gm−3. This reduction is due to low nitrification at low O∞ (0.25 to 1gm−3) and inefficient denitrification at O∞=2.5 and 5gm−3. The high growth rate of aerobic heterotrophic bacteria (Bh1) surpasses that of anaerobic bacteria (Bh2 and Bh3) under conditions where both oxygen and acetate are non-limiting factors for Bh1. Thus, nitrogen removal by MABR biofilms is highly sensitive to both oxygen (O∞) and acetate (A∞) concentrations. Figure 6 and Table 4 highlight that optimal nitrogen removal occurs at O∞=5gm−3 and A∞=30gm−3 for N1∞=15 to 100gm−3. For A∞=100gm−3 and higher, the elevated carbon substrate concentration stimulates aerobic heterotrophic growth and reduces the oxygen available for nitrification. This leads to a significant reduction in nitrogen removal across all pathways.
Figure 6.
Nitrogen removal via anammox (PN/A), shortcut denitrification (ND), and CND (NR1, NR2, and NR3 respectively) at different values of oxygen bulk concentrations and N1∞=15, and 100gm−3. Results are for A∞=6,30,100gm−3 from the top to the bottom respectively. Note that the range of the y-axes is different.
Figure 7.
Nitrification, total amount of conversion of nitrite nitrogen to nitrate nitrogen through NOB, and total nitrogen removal (NRT) at different values of oxygen and N1∞=15, and 100gm−3. Results are for A∞=6,30,100gm−3 from the top to the bottom respectively. Note that the range of the y-axes is different.
4.5. Effect of temperature on biofilm composition and nitrogen removal pathways
The reaction rates of biological processes occurring within the membrane significantly influence the performance of MABRs. Therefore, accurately estimating bacterial growth rates is essential for evaluating MABR efficiency. Among the microbial species involved, anammox bacteria are particularly noted for their slow growth rates. To improve the precision of anammox growth rate estimation, Zhang et al. reevaluated the maximum specific growth rate by directly measuring the exponential increase in 16S rRNA gene copy numbers of two distinct anammox species, Ca. Brocadia sinica and Ca. Jettenia caeni[47]. Their study, conducted at 37℃, reported the maximum growth rate of 0.33±0.02d−1 for Ca. B. sinica and 0.18d−1 for Ca. J. caeni, both higher than previously recorded values. To assess how these growth rates affect substrate removal in MABRs, we use the average of the reported anammox growth rates and update the growth rates of heterotrophic and autotrophic bacteria using the Hoff-Arrhenius equation as μ(Ba,Bh1,Bh2,Bh3,Bn)(T)=μ(Ba,Bh1,Bh2,Bh3,Bn)20θT−20, where μ(Ba,Bh1,Bh2,Bh3,Bn)20 represents the rates at 20℃, T[∘ C] is temperature and θ is the dimensionless temperature coefficient. This formulation is used to estimate the growth rates of all microbial species at 37℃. The results obtained at 20℃ and 37℃ under the condition that maximizes the total nitrogen removal (N1∞=100gm−3, O∞=5gm−3, and A∞=30gm−3) and the biofilm thickness 600μm are summarized in Table 5.
Table 5.
Substrate removal at temperatures 20℃ and 37℃ and N1∞=100gm−3, O∞=5gm−3, A∞=30gm−3.
Substrate removal
20℃
37℃
Total nitrogen removal (NRT)
0.54
0.71
Nitrogen removal via anammox (NR1)
0.016
0.14
Nitrogen removal via shortcut denitrification (NR2)
0.50
0.54
Nitrogen removal via conventional denitrification (NR3)
Results in Table 5 show that increasing temperature from 20℃ to 37℃ increases the total nitrogen removal by 31.5%, nitrification by 16.4%, and acetate consumption by 10.4% and reduces the oxygen consumption by 1.6%. The nitrogen removal fraction by PN/A, ND, and CND are 3.0%, 92.6%, and 4.8% at 20℃, respectively, while they change to 19.7%, 76.1%, and 4.5% at 37℃, respectively. The most modified pathway for nitrogen removal is degradation trough anammox due to more increase in the maximum growth rate of anammox. For further investigation of the effect of increasing temperature on nitrogen removal, we let biofilm grow to occupy 70% of the computational domain and record degradation of nitrogen via incorporated mechanisms in this study within the biofilm, i.e., with respect to biofilm thickness. Spatial spreading of biofilm occurs when total biomass density, M, approaches maximum cell density (1 after non-dimensionalization). Therefore, mass of the developed biofilm and its volume are equivalent and can be computed as the product of the biofilm thickness and area (i.e., biofilm thickness = mass/area). Using the total amount of biomass computed in Section 3.2, we can calculate the biofilm thickness and record the amount of biofilm species and substrate degradation within the biofilm. Results are depicted in Figures 8 and 9.
Figure 8.
Total amount of biomass species within the biofilm at temperatures 20℃ and 37℃. Results are for N1∞=100gm−3, A∞=30gm−3, and O∞=5gm−3.
Figure 9.
Total nitrogen degradation (NRT) and its removal through different pathways within the biofilm at temperatures 20℃ and 37℃. Results are for N1∞=100gm−3, A∞=30gm−3, and O∞=5gm−3.
Increasing the temperature from 20℃ to 37℃ leads to an increase in the volume fractions of Ba, Bh2, Bh3, and Ban, while decreasing the volume fractions of Bh1 and Bn within the biofilm. Notably, the volume fraction of anammox bacteria (Ban) grows exponentially with biofilm thickness, whereas Bh1 decreases sharply once the biofilm thickness reaches approximately 0.4 mm at 20℃ and 0.2 mm at 37℃. The reduction in Bh1 suggests the development of an effective anoxic zone within the biofilm, which promotes the growth of anoxic bacteria Bh2, Bh3, and anammox. Figure 9 illustrates the changes in nitrification and nitrogen removal rates with increasing biofilm thickness at both 20℃ and 37℃. At 20℃, nitrification, nitrogen removal via ND, and total nitrogen removal exhibit similar trends as biofilm grows. These trends are characterized by a rapid rise with the biofilm thickness increasing from 0.1 mm to 0.42 mm, followed by a transition period between the biofilm thickness 0.42 mm to 0.8 mm, and finally reaching a steady state for the biofilm thickness beyond about 0.8 mm. This alignment suggests that ND nitrogen removal plays a dominant role in total nitrogen removal, with a well-coordinated relationship between AOB activity and nitrite reduction bacteria (Bh2) at 20℃. At 37℃, both nitrification and total nitrogen removal are higher than those at 20℃. However, the rate of ND nitrogen removal decreases once biofilm thickness exceeds 0.4 mm. Despite this decline, total nitrogen removal continues to increase due to the sustained rise in PN/A nitrogen removal. CND contributes minimally to total nitrogen removal under both temperature conditions. Initially, denitrification rates increase but then quickly drop after reaching a peak, reflecting the variable growth rates of Bh3 and Bn during the early stages of biofilm development. Thus, the increase in temperature promotes the dominance of nitrogen removal via ND and PN/A, with anammox becoming increasingly important as biofilm thickness increases.
5.
Discussion
This study developed a two-dimensional, multi-species biofilm model to investigate the roles of ND, PN/A, and CND in nitrogen removal within a membrane aerated biofilm reactor (MABR) under various operational conditions. At 20℃, the highest nitrogen removal rate of 0.54gN/m2/d was achieved at bulk oxygen concentration (O∞) of 5gm−3, ammonium nitrogen concentration (N1∞) of 100gm−3, and acetate concentration (A∞) of 30gm−3. Reducing N1∞ from 100gm−3 to 15gm−3 resulted in only a slight decrease in nitrogen removal (from 0.54gN/m2/d to 0.47gN/m2/d). However, decreasing the bulk oxygen concentrations to 2.5gm−3, lowering A∞ to 6gm−3, or increasing A∞ to 100gm−3 led to reductions in nitrogen elimination by 72%, 70%, and 83.6%, respectively. Overall, nitrogen removal was limited by nitritation at low O∞ (≤2.5gm−3), denitritation at low A∞ (≤6gm−3), or the overgrowth of heterotrophic bacteria (HB) at high A∞ (>100gm−3). These findings suggest that O∞ and A∞ exert a more significant influence on nitrogen removal rates and pathways than N1∞. This observation contrasts with previous studies, which emphasized the importance of the COD-to-nitrogen ratio as a key factor affecting nitrogen removal in MABRs, often based on variations in COD concentrations while maintaining constant nitrogen levels and surface loading rates [11,12]. The results of this study suggest that independent control of A∞ and O∞ is likely more effective for optimizing MABR nitrogen removal performance than controlling the ratio of A∞ to N1∞. From a practical perspective, O∞ can be effectively regulated through the supply of oxygen. Although A∞ is primarily governed by the intrinsic characteristics of the wastewater, it can be controlled to some extent by adjusting influent feed strategies, managing liquid recirculation between bioreactor chambers, and adding external carbon sources.
In this study, ND is identified as the dominant nitrogen removal pathway under most tested conditions. For moderate acetate concentrations (A∞ between 30gm−3 and 100gm−3), ND dominance is observed at oxygen concentrations (O∞) between 2.5gm−3 and 5gm−3. At low acetate levels (A∞=6gm−3), ND is the primary pathway for O∞ values between 1gm−3 and 2.5gm−3. CND becomes dominant only under specific conditions, namely A∞=6gm−3, O∞gm−3, and ammonium nitrogen concentrations (N1∞) between 5gm−3 and 15gm−3. These results indicate that maintaining O∞≤5gm−3 promotes ND while effectively inhibiting the CND pathway in scenarios with moderate bulk acetate and ammonium concentrations. Under conditions yielding the highest nitrogen removal rate at 20℃ (O∞=5gm−3, N1∞=100gm−3, A∞=30gm−3), approximately 92% of nitrogen removal occurred via the ND pathway, 3% through anammox, and 5% through conventional denitrification.
Nitrogen reduction processes are primarily determined by oxygen and acetate distribution within the biofilm. The simulation results obtained under the conditions of O∞=5gm−3, N1∞=100gm−3, A∞=30gm−3, and biofilm thickness = 1 mm show that oxygen is consumed within a 0.4 mm depth from the membrane surface, while acetate is depleted within 0.6 mm from the liquid-biofilm interface (c.f. Figure A1). The establishment of aerobic and anoxic/anaerobic zones in the biofilm facilitates ammonium oxidation to nitrite by AOB in the aerobic zone near the membrane. Controlling O∞≤5gm−3 create a balance between nitrite and oxygen concentrations in the aerobic zone for the ND pathway at a level that NOB may not be able to compete with AOB for oxygen and Bh2 for nitrite. This occurs because NOB have significantly lower affinities for both oxygen (κno=2.2gm−3 vs. κao=0.6gm−3) and nitrite (κnn2=5.5gm−3 vs. κhn2=0.5gm−3) compared to AOB and Bh2. As shown in Figure A1, with a balanced supply of oxygen and acetate, NO−2 is rapidly consumed by Bh2 in the anaerobic zone upon the availability of acetate as an electron donor. Thus, controlling oxygen and acetate supply is critical to synchronizing nitritation and denitritation, establishing ND as the dominant nitrogen removal pathway in MABR biofilms.
Under all conditions tested at 20℃ in this study, anammox biomass constitutes only a minor fraction of the total biofilm biomass. The simulation results demonstrate that oxygen concentration (O∞=0.25−5gm−3) and nitrogen concentrations (N1∞=5−400gm−3) influence PN/A nitrogen removal under three acetate dosing conditions (A∞=6,30,100gm−3). At A∞=6gm−3, where carbon limitation may restrict conventional denitrification, the PN/A pathway is enhanced as O∞ increases from 0.25gm−3 to 2.5gm−3, particularly for N1∞ values in the range of 10gm−3 and 400gm−3 (c.f. Figure 3). At A∞=30 and 100gm−3, PN/A nitrogen removal exhibits an increasing trend with O∞ ranging from 0.25gm−3 to 5gm−3 for nitrogen concentrations of N1∞=15 and 100gm−3 (c.f. Figure 6). PN/A becomes the dominant pathway only when nitrification is markedly limited by low oxygen availability, specifically at O∞=0.25gm−3 across all conditions, and for oxygen levels between 0.25gm−3 and 1gm−3 when A∞ is between 30gm−3 and 100gm−3 (c.f. Figures 3 and 6). As O∞ increases to 2.5gm−3 or 5gm−3, short-cut nitrogen removal pathways dominate in most scenarios, except under the conditions of A∞=6gm−3, O∞=5gm−3, and N1∞≤15gm−3, where conventional denitrification remains dominant. These findings underscore that precise control of oxygen supply at low concentrations is critical for promoting PN/A-dominated nitrogen removal. Nonetheless, even under conditions where PN/A performs optimally, its overall nitrogen removal rate remains significantly lower than that achieved by ND under higher oxygen levels. This limitation is primarily due to reduced nitrification efficiency at low O∞, which restricts the availability of nitrite for the anammox process. Increasing the temperature from 20℃ to 37℃ raises the contribution of PN/A to total nitrogen removal from 3% to 19.7%, driven by the increased growth rate of anammox bacteria at higher temperatures [47]. Nevertheless, this temperature increase does not substantially reduce oxygen or acetate consumption. This indicates that increasing temperature to promote the PN/A pathway offers limited benefits in terms of reducing energy and carbon requirements. Additionally, elevating the temperature of one cubic meter of water from 20℃ to 37℃ consumes approximately 20.0 kWh of energy. Given the typical energy consumption of MABR systems around 6Kg−O2/kWh, the energy required for municipal wastewater treatment is only about 0.004kWh/m3, according to Peeters and Moran [48]. Therefore, raising the temperature of water to 37℃ is not a practical approach, except when treating already-heated water, such as return liquid from anaerobic digesters. While anammox is generally considered the most energy- and carbon-efficient nitrogen removal pathway, the nitrogen removal rate achievable through PN/A alone in MABR biofilms is limited. Therefore, operating MABRs to favor ND-dominant or ND and PN/A co-dominant nitrogen removal is likely to be more practical and beneficial, maximizing nitrogen removal while reducing energy and carbon inputs.
6.
Conclusions
In conclusion, this study successfully develops a comprehensive two-dimensional, multi-species biofilm model that elucidates the intricate dynamics of nitrogen removal processes in MABRs. By systematically varying environmental factors such as bulk concentrations of oxygen, ammonium, and acetate, as well as temperature and biofilm thickness, we have demonstrated their influence on the growth dynamics of various biomass species and the overall efficiency of nitrogen removal pathways, including shortcut denitrification (ND), anammox (PN/A), and conventional denitrification (CND). Our findings indicate that shortcut nitrogen removal is the predominant pathway under most operational conditions, with anammox thriving in oxygen-limited environments. Conversely, conventional denitrification becomes significant primarily at elevated oxygen levels and low ammonium concentrations. Notably, temperature emerged as a key factor enhancing overall nitrogen removal efficiency, primarily by promoting anammox activity. The simulation results further reveal that biofilm thickness plays a vital role in maintaining stable nitrogen elimination efficiencies, with thicker biofilms favoring the dominance of ammonium-oxidizing bacteria and shortcut denitrifiers.
The results obtained in this study demonstrate that the distribution and fate of oxygen, acetate, ammonium, NO−3, and NO−2 within the biofilm are influenced by the bulk concentrations of dissolved substrates and the biofilm thickness. While understanding the spatial distribution and transformation of these chemical species is essential for uncovering the nitrogen removal mechanisms in MABR biofilms, such insights are difficult to obtain through experimental studies alone due to the complexity and micro-scale structure of biofilms. This study demonstrates that mathematical modeling is a powerful tool for exploring these pathways. Moreover, the model developed here can be integrated with MABR process models to simulate the system's dynamic performance. The insights gained through the simulations provide a foundation for optimizing MABR design and operational strategies, ultimately contributing to more effective and sustainable wastewater treatment solutions.
Use of Generative-AI tools declaration
The authors declare they have not used Artificial Intelligence (AI) tools in the creation of this article.
Conflict of interest
The authors declare no conflicts of interest.
Appendix
Spatial distribution of biomass volume fractions and substrates in biofilm
Figure A1.
Distribution of biomass volume fractions (a) and substrates (b) within the biofilm of thickness 1 mm and liquid region. Results are for N1∞=100gm−3, A∞=30gm−3, and O∞=5gm−3.
H. Chen, L. Shi, M. Xue, N. Wang, X. Dong, Y. Cai, et al., Geographic variations in in-hospital mortality and use of percutaneous coronary intervention following acute myocardial infarction in China: A nationwide cross-sectional analysis, J. Am. Heart Assoc., 7 (2018), e008131. https://doi.org/10.1161/JAHA.117.008131 doi: 10.1161/JAHA.117.008131
[2]
S. Yang, H. Shen, Heartbeat classification using discrete wavelet transform and kernel principal component analysis, in IEEE 2013 Tencon-Spring., Sydney, Australia, (2013), 34–38. https://doi.org/10.1109/TENCONSpring.2013.6584412
[3]
J. Park, S. M. Hwang, J. W. Baek, Y. N. Kim, J. H. Lee, Cardiac arrhythmias auto detection in an electrocardiogram using computer-aided diagnosis algorithm, in Applied Mechanics and Materials., (2014), 2728–2731. https://doi.org/10.4028/www.scientific.net/AMM.556-562.2728
[4]
T. Xia, M. Shu, H. Fan, L. Ma, Y. Sun, The development and trend of ECG diagnosis assisted by artificial intelligence, in Proceedings of the 2019 2nd International Conference on Signal Processing and Machine Learning, ACM, New York, USA, (2019), 103–107. https://doi.org/10.1145/3372806.3372807
[5]
S. Kaplan Berkaya, A. K. Uysal, E. S. Gunal, S. Ergin, S. Gunal, M. B. Gulmezoglu, A survey on ECG analysis, Biomed. Signal Process. Control, 43 (2018), 216–235. https://doi.org/10.1016/j.bspc.2018.03.003 doi: 10.1016/j.bspc.2018.03.003
[6]
A. Çınar, S. A. Tuncer, Classification of normal sinus rhythm, abnormal arrhythmia and congestive heart failure ECG signals using LSTM and hybrid CNN-SVM deep neural networks, Comput. Methods Biomech. Biomed. Eng., 24 (2021), 203–214. https://doi.org/10.1080/10255842.2020.1821192 doi: 10.1080/10255842.2020.1821192
[7]
Z. Wang, H. Li, C. Han, S. Wang, L. Shi, Arrhythmia classification based on multiple features fusion and random forest using ECG, J. Med. Imaging Health Inf., 9 (2019), 1645–1654. https://doi.org/10.1166/jmihi.2019.2798 doi: 10.1166/jmihi.2019.2798
[8]
S. Sabut, O. Pandey, B. S. P. Mishra, M. Mohanty, Detection of ventricular arrhythmia using hybrid time–frequency-based features and deep neural network, Phys. Eng. Sci. Med., 44 (2021), 135–145. https://doi.org/10.1007/s13246-020-00964-2 doi: 10.1007/s13246-020-00964-2
[9]
H. Zhang, K. Dana, J. Shi, Z. Zhang, X. Wang, A. Tyagi, et al., Context encoding for semantic segmentation, in 2018 IEEE/CVF Conference on Computer Vision and Pattern Recognition, Salt Lake City, USA, (2018), 7151–7160. https://doi.org/10.1109/CVPR.2018.00747
[10]
K. Xu, J. Ba, R. Kiros, K. Cho, A. Couville, R. Salakhutdinov, et al., Show, attend and tell: Neural image caption generation with visual attention, in International Conference on Machine Learning, PMLR, (2015), 2048–2057.
[11]
J. Hu, L. Shen, G. Sun, Squeeze-and-excitation networks, in IEEE Transactions on Pattern Analysis and Machine Intelligence, IEEE, 42 (2018), 7132–7141. https://doi.org/10.1109/TPAMI.2019.2913372
[12]
X. Chu, B. Zhang, R. Xu, MoGA: Searching beyond mobilenetv3, in 2020 IEEE International Conference on Acoustics, Speech and Signal Processing (ICASSP), IEEE, Barcelona, Spain (2020), 4042–4046. https://doi.org/10.1109/ICASSP40776.2020.9054428
[13]
D. Ruan, J. Wen, N. Zheng, M. Zheng, Linear context transform block, in Proceedings of the AAAI Conference on Artificial Intelligence, AAAI, New York, USA 34 (2020), 5553–5560. https://doi.org/10.1609/aaai.v34i04.6007
[14]
M. S. Moustafa, S. A. Sayed, Satellite imagery super-resolution using squeeze-and-excitation-based GAN, Int. J. Aeronaut. Space Sci., 22 (2021), 1481–1492. https://doi.org/10.1007/s42405-021-00396-6 doi: 10.1007/s42405-021-00396-6
[15]
S. Woo, J. Park, J. Y. Lee, I. S. Kweon, CBAM: Convolutional block attention module, in Proceedings of the European conference on computer vision (ECCV), (2018), 3–19. https://doi.org/10.1007/978-3-030-01234-2_1
[16]
M. F. Guo, X. D. Zeng, D. Y. Chen, N. C. Yang, Deep-learning-based earth fault detection using continuous wavelet transform and convolutional neural network in resonant grounding distribution systems, IEEE Sens. J., 18 (2017), 1291–1300. https://doi.org/10.1109/JSEN.2017.2776238 doi: 10.1109/JSEN.2017.2776238
[17]
Z. Wu, T. Lan, C. Yang, Z. Nie, A novel method to detect multiple arrhythmias based on time-frequency analysis and convolutional neural networks, IEEE Access, 7 (2019), 170820–170830. https://doi.org/10.1109/ACCESS.2019.2956050 doi: 10.1109/ACCESS.2019.2956050
[18]
T. Wang, C. Lu, Y. Sun, M. Yang, C. Liu, C. Ou, Automatic ECG classification using continuous wavelet transform and convolutional neural network, Entropy, 23 (2021), 119. https://doi.org/10.3390/e23010119 doi: 10.3390/e23010119
[19]
A. Ajit, K. Acharya, A. Samanta, A review of convolutional neural networks, in 2020 International Conference on Emerging Trends in Information Technology and Engineering (ic-ETITE), IEEE, Vellore, India, (2020), 1–5. https://doi.org/10.1109/ic-ETITE47903.2Vellore,India020.049
[20]
Y. Lu, M. Jiang, L. Wei, J. Zhang, Z. Wang, B. Wei, et al., Automated arrhythmia classification using depthwise separable convolutional neural network with focal loss, Biomed. Signal Process. Control, 69 (2021), 102843. https://doi.org/10.1016/j.bspc.2021.102843 doi: 10.1016/j.bspc.2021.102843
[21]
G. B. Moody, R. G. Mark, The impact of the MIT-BIH arrhythmia database, IEEE Eng. Med. Biol. Mag., 20 (2001), 45–50. https://doi.org/10.1109/51.932724 doi: 10.1109/51.932724
T. Mar, S. Zaunseder, J. P. Martínez, M. Llamedo, R. Poll, Optimization of ECG classification by means of feature election, IEEE Trans. Biomed. Eng., 58 (2011), 2168–2177. https://doi.org/10.1109/TBME.2011.2113395 doi: 10.1109/TBME.2011.2113395
[24]
V. Mondéjar-Guerra, J. Novo, J. Rouco, M. G. Penedo, M. Ortega, Heartbeat classification fusing temporal and morphological information of ECGs via ensemble of classifiers, Biomed. Signal Process. Control, 47 (2019), 41–48. https://doi.org/10.1016/j.bspc.2018.08.007 doi: 10.1016/j.bspc.2018.08.007
[25]
P. D. Chazal, M. O'Dwyer, R. B. Reilly, Automatic classification of heartbeats using ECG morphology and heartbeat interval features, IEEE Trans. Biomed. Eng., 51 (2004), 1196–1206. https://doi.org/10.1109/TBME.2004.827359 doi: 10.1109/TBME.2004.827359
This article has been cited by:
1.
Hosam Almetahr, Ethar Almutahar, Yahia Alkhaldi, Ibrahim Alshehri, Ali Assiri, Shehata Shehata, Abdullah Alsabaani,
Impact of Diabetes Continuing Education on Primary Healthcare Physicians’ Knowledge, Attitudes, and Practices
Bashair K Alshahri, Manar Bamashmoos , Mona I Alnaimi, Shaykhah Alsayil, Shymaa Basaqer, Mohammed T Al-Hariri, Christopher Amalraj Vallaba Doss,
Assessment of Self-Management Care and Glycated Hemoglobin Levels Among Type 2 Diabetes Mellitus Patients: A Cross-Sectional Study From the Kingdom of Saudi Arabia,
2020,
2168-8184,
10.7759/cureus.11925
3.
Alaa Hamza Hermis, Fakhria Jaber Muhaibes,
Evaluating the effect of a training program on type 2 diabetic patient’s self-care: A quasi-experimental study,
2024,
13,
2277-9531,
10.4103/jehp.jehp_353_23
4.
Omer Abdullah AsSaigal, Abdullah Mohammed Al-Saigul, Khalid MA Almutairi,
Impact of a diabetes educator-led clinic on the control of type 1 diabetes among adults,
2023,
82,
0017-8969,
850,
10.1177/00178969231202751
5.
Riham Saud Alhazmy, Asmaa Hamdi Khalil, Hayfa Almutary, Nimesh Lageju,
Effects of an instructional WhatsApp group on self-care and HbA1c among female patients with Type 2 diabetes mellitus,
2024,
19,
1932-6203,
e0305845,
10.1371/journal.pone.0305845
6.
Abdulaziz Yahya Sharahili, Shabir Ahmad Mir, Sahar ALDosari, Md Dilshad Manzar, Bader Alshehri, Ayoub Al Othaim, Fayez Alghofaili, Yahya Madkhali, Kamal Shaker Albenasy, Jazi S. Alotaibi,
Correlation of HbA1c Level with Lipid Profile in Type 2 Diabetes Mellitus Patients Visiting a Primary Healthcare Center in Jeddah City, Saudi Arabia: A Retrospective Cross-Sectional Study,
2023,
11,
2079-9721,
154,
10.3390/diseases11040154


 DownLoad: