


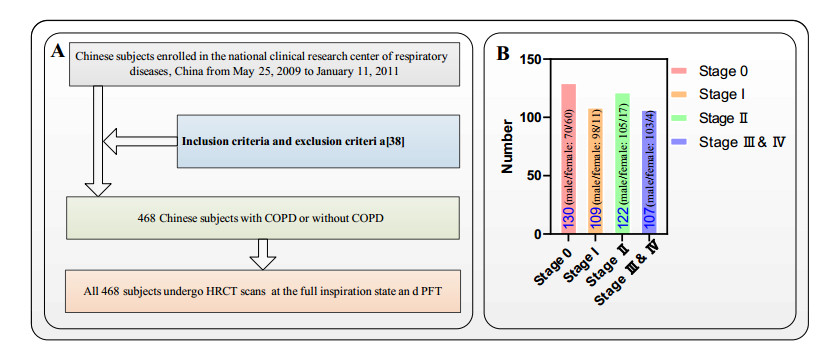
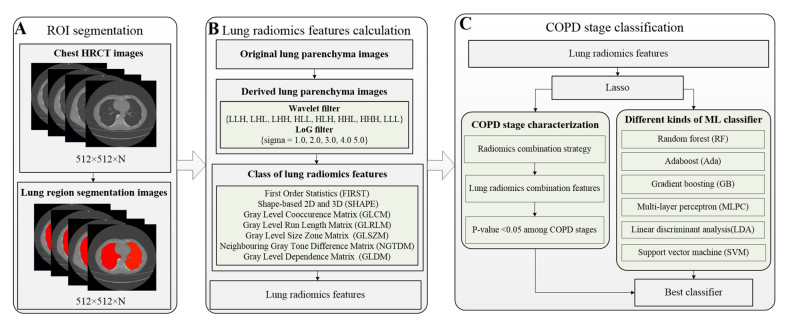
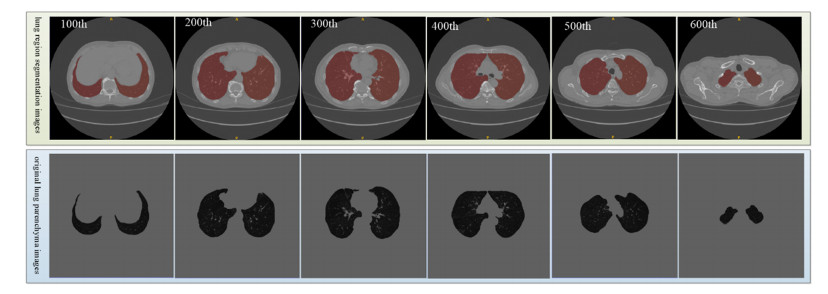
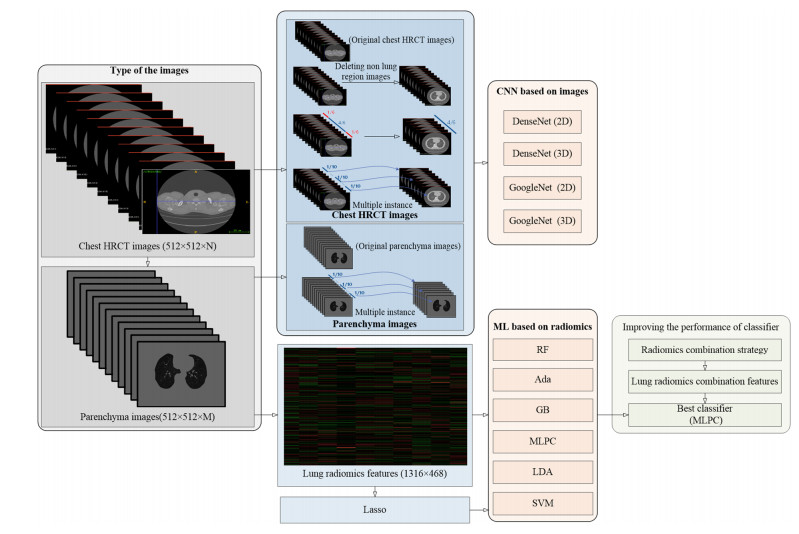
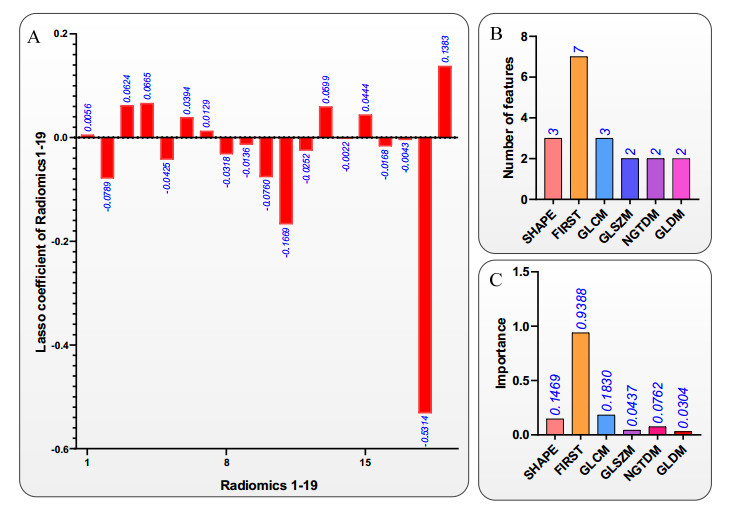
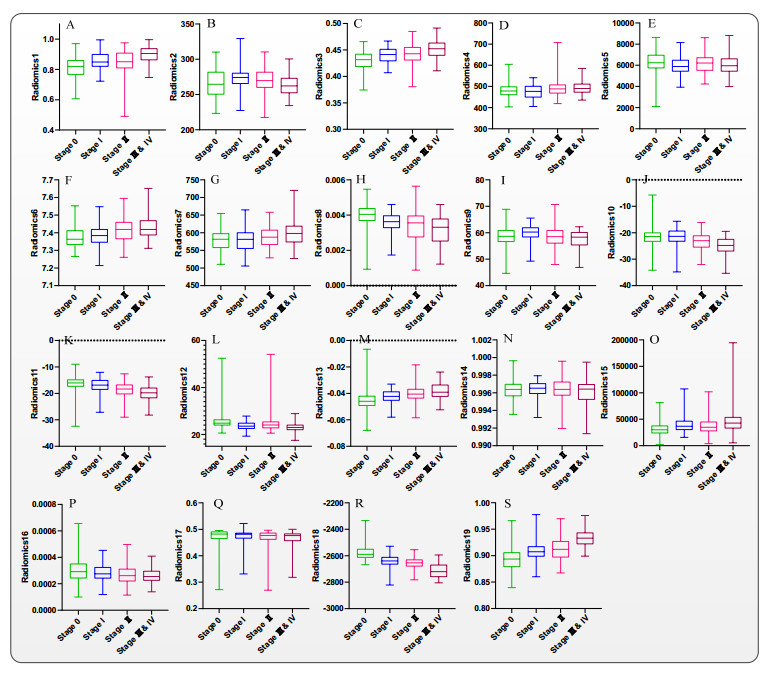
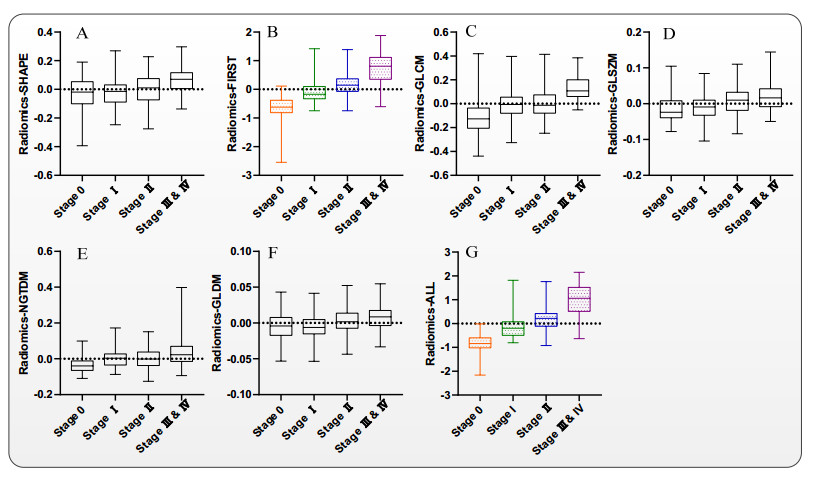
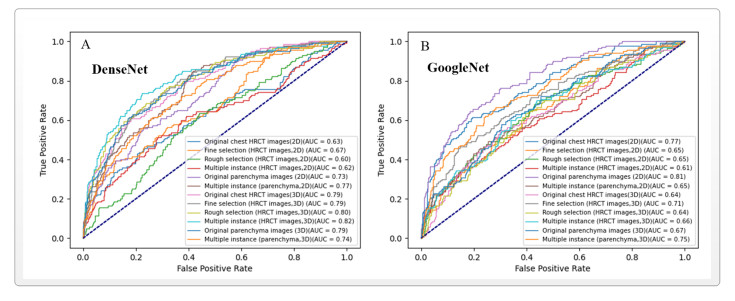
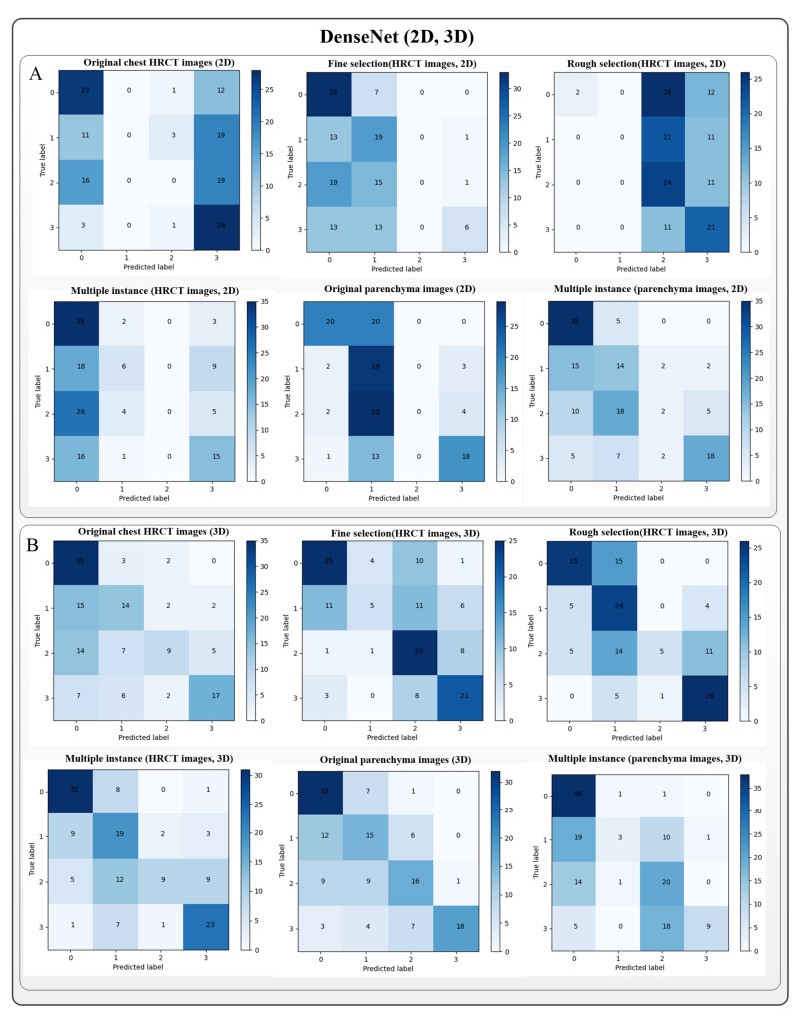
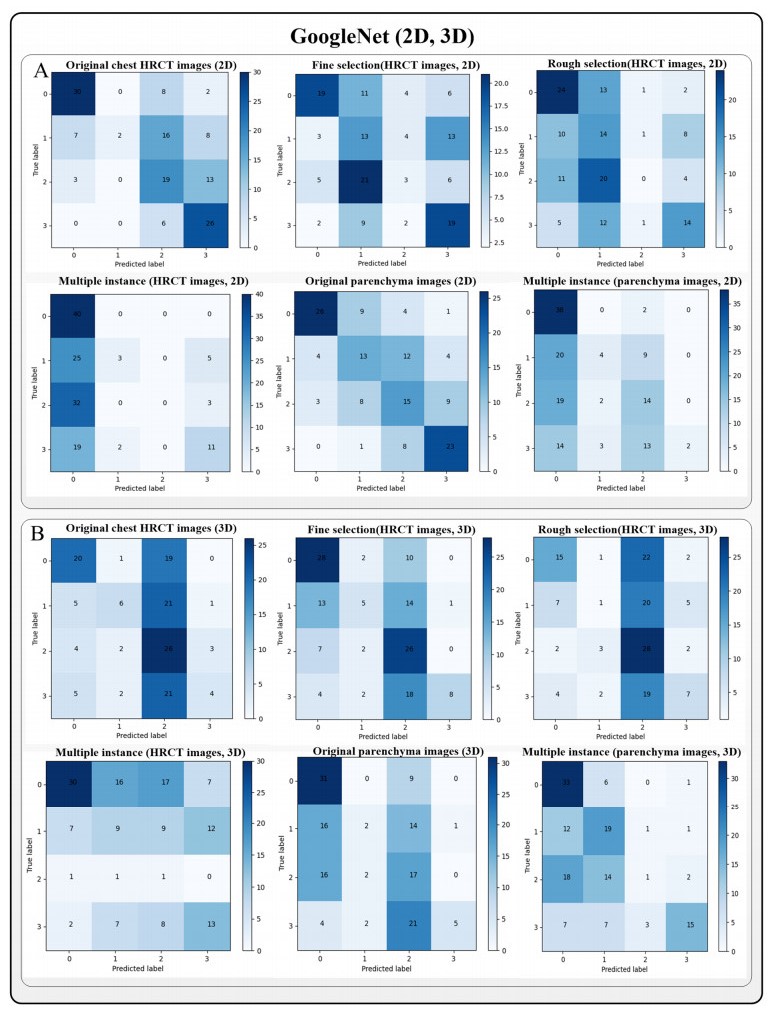
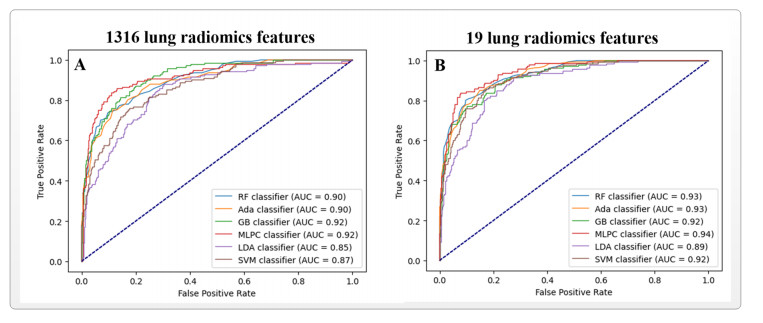
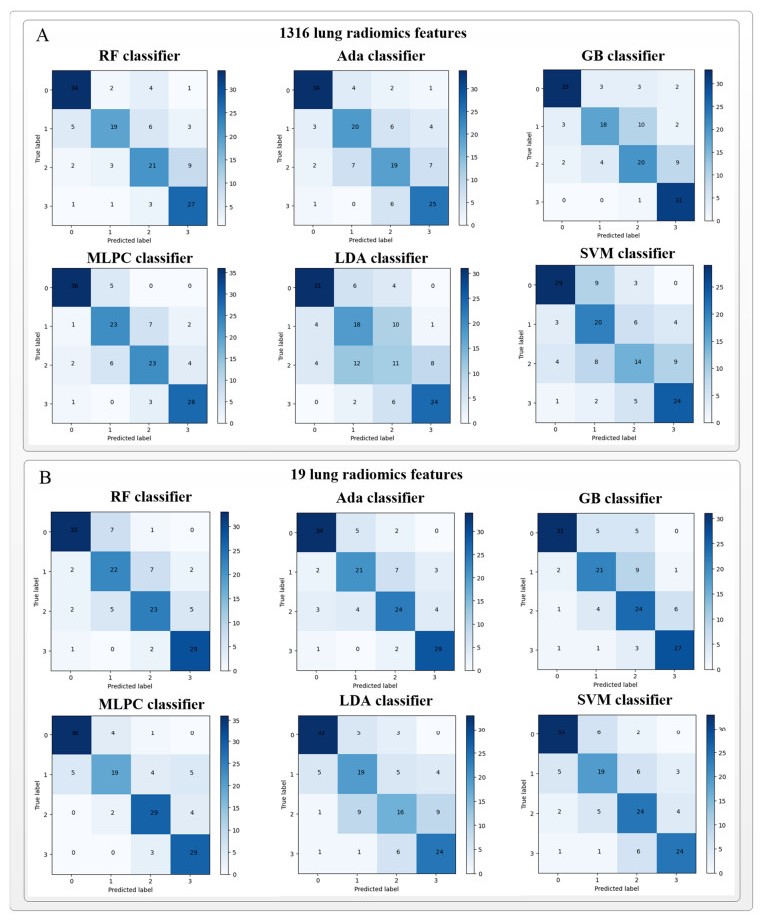
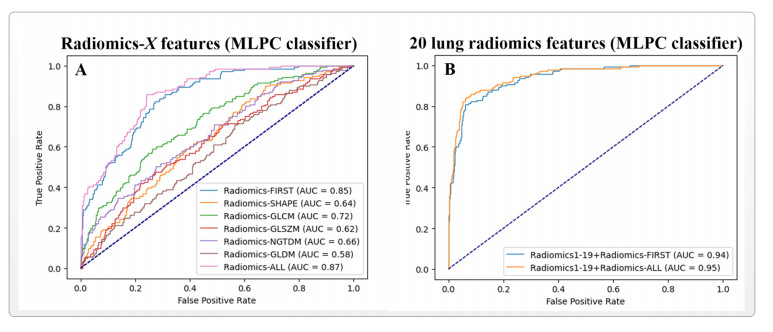
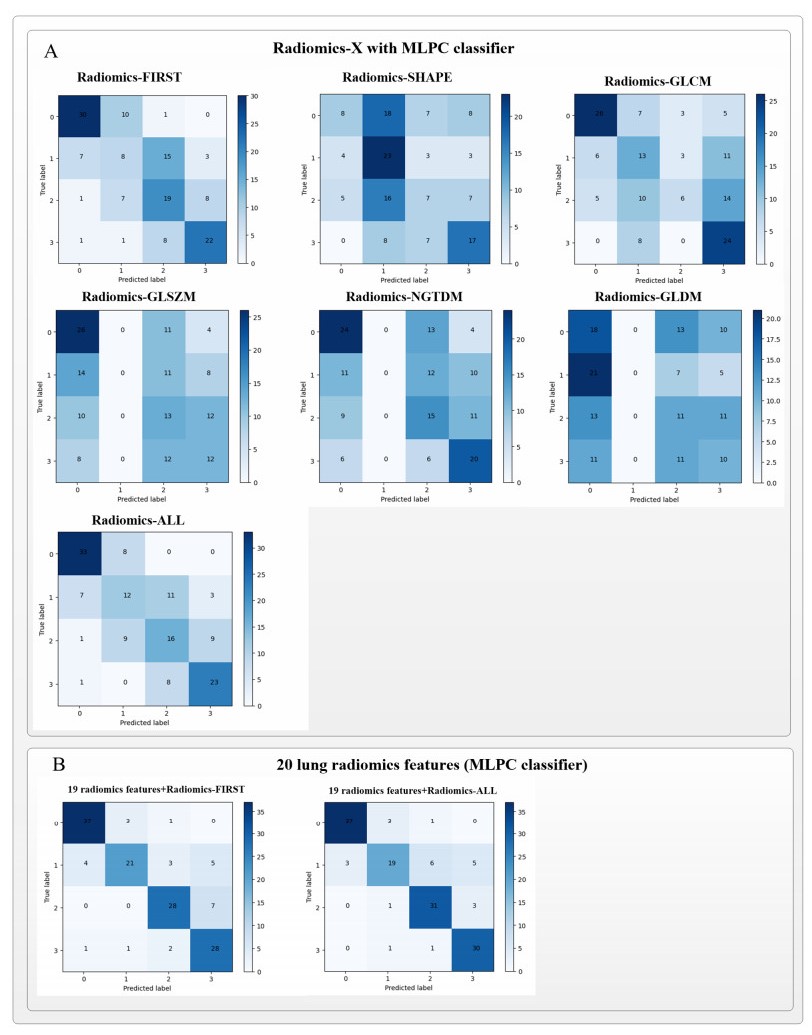
Computed tomography (CT) has been the most effective modality for characterizing and quantifying chronic obstructive pulmonary disease (COPD). Radiomics features extracted from the region of interest in chest CT images have been widely used for lung diseases, but they have not yet been extensively investigated for COPD. Therefore, it is necessary to understand COPD from the lung radiomics features and apply them for COPD diagnostic applications, such as COPD stage classification. Lung radiomics features are used for characterizing and classifying the COPD stage in this paper. First, 19 lung radiomics features are selected from 1316 lung radiomics features per subject by using Lasso. Second, the best performance classifier (multi-layer perceptron classifier, MLP classifier) is determined. Third, two lung radiomics combination features, Radiomics-FIRST and Radiomics-ALL, are constructed based on 19 selected lung radiomics features by using the proposed lung radiomics combination strategy for characterizing the COPD stage. Lastly, the 19 selected lung radiomics features with Radiomics-FIRST/Radiomics-ALL are used to classify the COPD stage based on the best performance classifier. The results show that the classification ability of lung radiomics features based on machine learning (ML) methods is better than that of the chest high-resolution CT (HRCT) images based on classic convolutional neural networks (CNNs). In addition, the classifier performance of the 19 lung radiomics features selected by Lasso is better than that of the 1316 lung radiomics features. The accuracy, precision, recall, F1-score and AUC of the MLP classifier with the 19 selected lung radiomics features and Radiomics-ALL were 0.83, 0.83, 0.83, 0.82 and 0.95, respectively. It is concluded that, for the chest HRCT images, compared to the classic CNN, the ML methods based on lung radiomics features are more suitable and interpretable for COPD classification. In addition, the proposed lung radiomics combination strategy for characterizing the COPD stage effectively improves the classifier performance by 12% overall (accuracy: 3%, precision: 3%, recall: 3%, F1-score: 2% and AUC: 1%).
Citation: Yingjian Yang, Wei Li, Yingwei Guo, Nanrong Zeng, Shicong Wang, Ziran Chen, Yang Liu, Huai Chen, Wenxin Duan, Xian Li, Wei Zhao, Rongchang Chen, Yan Kang. Lung radiomics features for characterizing and classifying COPD stage based on feature combination strategy and multi-layer perceptron classifier[J]. Mathematical Biosciences and Engineering, 2022, 19(8): 7826-7855. doi: 10.3934/mbe.2022366
| [1] | Saad Eddin Lachhab, A. Bliya, E. Al Ibrahmi, L. Dlimi . Theoretical analysis and mathematical modeling of a solar cogeneration system in Morocco. AIMS Energy, 2019, 7(6): 743-759. doi: 10.3934/energy.2019.6.743 |
| [2] | Joanna McFarlane, Jason Richard Bell, David K. Felde, Robert A. Joseph III, A. Lou Qualls, Samuel Paul Weaver . Performance and Thermal Stability of a Polyaromatic Hydrocarbon in a Simulated Concentrating Solar Power Loop. AIMS Energy, 2014, 2(1): 41-70. doi: 10.3934/energy.2014.1.41 |
| [3] | Xian-long Meng, Cun-liang Liu, Xiao-hui Bai, De-hai Kong, Kun Du . Improvement of the performance of parabolic trough solar concentrator using freeform optics and CPV/T design. AIMS Energy, 2021, 9(2): 286-304. doi: 10.3934/energy.2021015 |
| [4] | Daniel Chuquin-Vasco, Cristina Calderón-Tapia, Nelson Chuquin-Vasco, María Núñez-Moreno, Diana Aguirre-Ruiz, Vanesa G. Lo-Iacono-Ferreira . Mathematical modeling of a binary ORC operated with solar collectors. Case study—Ecuador. AIMS Energy, 2023, 11(6): 1153-1178. doi: 10.3934/energy.2023053 |
| [5] | Chao-Jen Li, Peiwen Li, Kai Wang, Edgar Emir Molina . Survey of Properties of Key Single and Mixture Halide Salts for Potential Application as High Temperature Heat Transfer Fluids for Concentrated Solar Thermal Power Systems. AIMS Energy, 2014, 2(2): 133-157. doi: 10.3934/energy.2014.2.133 |
| [6] | Nassir D. Mokhlif, Muhammad Asmail Eleiwi, Tadahmun A. Yassen . Experimental evaluation of a solar water heater integrated with a corrugated absorber plate and insulated flat reflectors. AIMS Energy, 2023, 11(3): 522-539. doi: 10.3934/energy.2023027 |
| [7] | Hayder S. Al-Madhhachi, Ahmed M. Ajeena, Nihad A. Al-Bughaebi . Dynamic simulation and energy analysis of forced circulation solar thermal system in two various climate cities in Iraq. AIMS Energy, 2021, 9(1): 138-149. doi: 10.3934/energy.2021008 |
| [8] | Cristiana Brasil Maia, Gisele Mol da Silva, Luiz Felippe Guardia Bianchi, André Guimarães Ferreira . Performance study of a baffled solar dryer. AIMS Energy, 2021, 9(6): 1136-1146. doi: 10.3934/energy.2021052 |
| [9] | Wei An, Yifan Zhang, Bo Pang, Jun Wu . Synergistic design of an integrated pv/distillation solar system based on nanofluid spectral splitting technique. AIMS Energy, 2021, 9(3): 534-557. doi: 10.3934/energy.2021026 |
| [10] | Thomas Wetzel, Julio Pacio, Luca Marocco, Alfons Weisenburger, Annette Heinzel, Wolfgang Hering, Carsten Schroer, Georg Muller, Jurgen Konys, Robert Stieglitz, Joachim Fuchs, Joachim Knebel, Concetta Fazio, Markus Daubner, Frank Fellmoser . Liquid metal technology for concentrated solar power systems: Contributions by the German research program. AIMS Energy, 2014, 2(1): 89-98. doi: 10.3934/energy.2014.1.89 |
Computed tomography (CT) has been the most effective modality for characterizing and quantifying chronic obstructive pulmonary disease (COPD). Radiomics features extracted from the region of interest in chest CT images have been widely used for lung diseases, but they have not yet been extensively investigated for COPD. Therefore, it is necessary to understand COPD from the lung radiomics features and apply them for COPD diagnostic applications, such as COPD stage classification. Lung radiomics features are used for characterizing and classifying the COPD stage in this paper. First, 19 lung radiomics features are selected from 1316 lung radiomics features per subject by using Lasso. Second, the best performance classifier (multi-layer perceptron classifier, MLP classifier) is determined. Third, two lung radiomics combination features, Radiomics-FIRST and Radiomics-ALL, are constructed based on 19 selected lung radiomics features by using the proposed lung radiomics combination strategy for characterizing the COPD stage. Lastly, the 19 selected lung radiomics features with Radiomics-FIRST/Radiomics-ALL are used to classify the COPD stage based on the best performance classifier. The results show that the classification ability of lung radiomics features based on machine learning (ML) methods is better than that of the chest high-resolution CT (HRCT) images based on classic convolutional neural networks (CNNs). In addition, the classifier performance of the 19 lung radiomics features selected by Lasso is better than that of the 1316 lung radiomics features. The accuracy, precision, recall, F1-score and AUC of the MLP classifier with the 19 selected lung radiomics features and Radiomics-ALL were 0.83, 0.83, 0.83, 0.82 and 0.95, respectively. It is concluded that, for the chest HRCT images, compared to the classic CNN, the ML methods based on lung radiomics features are more suitable and interpretable for COPD classification. In addition, the proposed lung radiomics combination strategy for characterizing the COPD stage effectively improves the classifier performance by 12% overall (accuracy: 3%, precision: 3%, recall: 3%, F1-score: 2% and AUC: 1%).
The fluctuation in the cost of fuel prices, the increasing dem and for energy, and the evident signs of climate change, have fostered the development of technologies that utilize renewable energy sources. Concentrated solar thermal systems continue to be one of the most attractive options to produce power to meet utility-scale needs in certain regions of the U.S. However, in order to reduce levelized cost of solar power, solar thermal systems that can operate at higher temperatures, i.e. 450-600 °C, while remaining thermally stable, are needed.
Previous studies have based improvements of solar thermal system performance by configuring the structure of solar collectors, adjusting the selective coating for higher absorptivity, or preventing heat loss from the collectors. More recently, studies have based improvements of solar thermal systems performance by experimenting with different working fluids such as ammonia, air, silicon oil and organic working fluids. However, there are downfalls to using these fluids. Working fluids, such as CFC113, CFC114 and CFC11 can deplete the ozone layer [1], so they have been phased out. In addition, ammonia is a health hazard, air has poor thermophysical properties, and silicon oil's high viscosity made it difficult to h and le at low temperatures.
There are a few studies that have been conducted considering carbon dioxide(R-744)as the working fluid. Carbon dioxide has a high volumetric capacity, heat transfer coefficients tend to be higher than for other fluids, it is readily available, and it is thermally stable for a wide range of temperatures. Carbon dioxide has a critical pressure and temperature of 7.38 MPa and 31.1 °C, respectively, which is lower than other working fluids. In addition, it is abundant in nature, non-toxic, non-flammable and environmentally safe. This makes carbon dioxide a good c and idate for a working fluid in advanced solar thermal systems [1,2,3,4]. CO2 is a greenhouse gas when released to the atmosphere but its global warming potential index is far lower than other working fluids.
Non-imaging-optics based external compound parabolic concentrating reflectors(XCPC)combined with evacuated-tube collectors featuring a metal absorber and a glass-to-metal seal have been shown to obtain efficiencies higher than 40 % operating near 200 °CC without the need of tracking [5,6]. However, these results have been obtained using thermal oil(Duratherm 600) and there is very little information of the performance using alternative working fluids such as CO2. Yamaguchi et al. [2] carried out an experimental study of solar energy powered Rankine cycle using supercritical CO2. They found an estimated power generation efficiency of 0.25 and heat recovery efficiency of 0.65.
For higher temperatures, parabolic trough concentrators(PTC)with an absorber inside an evacuated-tube have been simulated and experimentally tested with operating temperatures up to 400 °CC using thermal oils such as silicon oil, biphenyl/diphenyl ether(VP-1) and Syltherm 800. Temperatures up to 500 °C have been reached using steam [7,8,9,10]. Above 400 °CC, the properties of thermal oils degrade significantly causing molecular bond breakdown, excessive system pressure, and an increase in viscosity that can reduce heat transfer efficiency [7,11]. In addition, thermal oils can be costly and dangerous due to their high flammability and toxicity [7,9]. Steam as working fluid produced equivalent results compared to thermal oils, however, water can only be used above 0 °CC and has to be operated under high working pressure.
This paper presents numerical simulations of XCPC and PTC collectors operating with CO2 as a working fluid for a range of temperatures that covers the medium and high range.
The mathematical model of the XCPC used to simulate the performance of CO2 under medium temperatures followed the analysis performed by Tovar-Fonseca [12]. A sketch of the XCPC concentrator and the evacuated tube collector is shown in Figure 1. The collector consists of a glass envelope that has a metal absorber inserted inside that acts as a fin contouring a coaxial pipe. A selective coating is applied to the exterior of the copper-fin absorber. One end of the glass tube is rounded, as shown in Figure 2, and the other end consists of a glass to metal seal that is used to ensure that the vacuum inside the glass tube is not lost. The coaxial pipes consist of concentric external and internal copper pipes with the inlet fluid to the collector flowing in the interior pipe and the exit fluid flowing in the annulus formed in between the two pipes. The absorber fin and the external copper pipe are welded together, so the heat reaching the absorber fin is transferred by conduction to the external pipe that transfers the heat to the working fluid by heat convection. The input dimensions and properties used to simulate the XCPC collector are shown in Table 1.
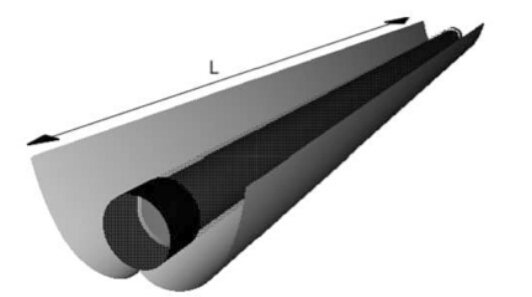 Figure 1. Sketch of XCPC with an absorber [12].
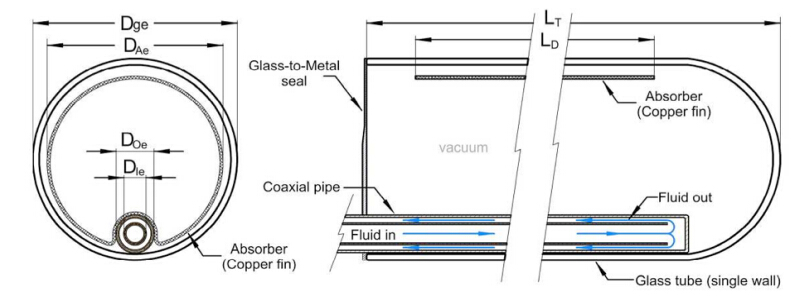 Figure 2. Detailed schematic of the evacuated glass tube with metal absorber and glass-to-metal seal [12].
| Component | Material | Symbol | Value |
| Glass tube | Pyrex 7740 | ||
| Outer diameter | Dge | 65 mm | |
| Inner diameter | Dg | 61 mm | |
| Thermal Conductivity | kg | 1.4 W/m·K | |
| Emissivity | eg | 0.92 | |
| Metal absorber/fin | Copper | ||
| Outer diameter | DAe | 56 mm | |
| Thickness | t0 | 1 mm | |
| Effective length | LD | 1, 640 mm | |
| Absorptivity | aA | 0.95 | |
| Emissivity | eA | 0.01 | |
| Selective coating | Metal aluminum nitride cermet | ||
| Thermal conductivity | kA | 200 W/m·K | |
| Coaxial pipes | Copper | ||
| External pipe, outer diameter | DOe | 30 mm | |
| External pipe, inner diameter | Do | 26.6 mm | |
| Internal pipe, outer diameter | DIe | 8 mm | |
| Internal pipe, inner diameter | DI | 6 mm | |
| Hydraulic diameter | Dh | 3.5 mm | |
| Thermal conductivity | kCu | 320 W/m·K |
 DownLoad: CSV
A mathematical model to represent the XCPC collector was implemented using the thermal analysis in [12,13] which was implemented in Engineering Equation Solver(EES)[14] to simulate the behavior of CO2 as the working fluid.
The following assumptions were made: uniform heat flux on absorber, incompressible fluid, constant properties of fluid, constant heat transfer coefficients, negligible fouling factor, negligible potential and kinetic energy changes, and fully developed conditions.
An energy balance applied to the glass cover is given by:
| αgGc+11εA+1−εgεg(DAe+t0Dg)σ(T4A−T4g)−h0(Tg−T∞)−εgσ(T4g−T4sky)=0 |
(1) |
where αg is the absorption coefficient of the glass, and Gc is the irradiance incident on the metal absorber(Gc = Total irradiance incident on concentrator aperture × Concentration ratio = Gs × Cmax). TA is the temperature of the absorber, Tg is the temperature at the glass, T∞ is the temperature of the ambient air, and σ is the Stefan-Boltzmann constant. Tsky is the sky temperature and can be related to the ambient temperature by Tsky = 0.0552T∞1.5 [15]. h0 is the convection heat transfer coefficient between the outside exterior of the glass and the ambient air, and is given by the empirical equation: h 0 =2.8 + 3v, where v is the velocity of the ambient air nearby the surface of the exterior glass [12,15]. Finally, eg is the emissivity of the glass, eA is the emissivity of the absorber, DAe is the outer diameter of the metal absorber, Dg is the inner diameter of the external glass, and t0 is the thickness of the metal absorber.
The energy balance applied to the absorber gives the following equation:
| αAτg1−(1−αA)ρgGc−11εA+1−εgεg(DAe+t0Dg)σ(T4A−T4g)−q″cond=0 |
(2) |
αA is the absorptivity of the absorber, and τg and ρg are the glass transmissivity and reflectivity, respectively. Performing an energy balance at the absorber fin, the expression for the temperature of the fin as a function of the arc length is given by
| T−T∞−S/ULTb−T∞−S/UL=coshcosh(mx)coshcosh(mπDAe/2) |
(3) |
where S = κGs, m = √(UL/t0/kA)
| qcond=−kAAtmλtanhtanh(mπDAe/2) |
(4) |
where λ = Tb - T∞ - S/UL.
The energy collected at the fin is transferred to the working fluid as:
| qcond=(Tb−Tf)/Rtotal |
(5) |
where Tf =(Tin + Tout)/2, Tin, Tout is the inlet and outlet temperature of the fluid, respectively, and Rtotal is the resistance by conduction and convection at the pipe given by Eq. 6 for the XCPC.
The total thermal resistance from the pipe to the fluid is as follows:
| Rtotal=lnln(DOe/Do)2πLDkCu+1πDOLDhfluid |
(6) |
where DO is the inner diameter of the external copper pipe, DOe is the outer diameter of the external copper pipe, LD is the length of the metal copper fin absorber, kCu is the thermal conductivity of copper, and hfluid is the convection coefficient of the working fluid. The outlet temperature can be obtained from
| qcond=˙m·Cp·T |
(7) |
where Cp is specific heat of the working fluid, ∆T = Tout - Tin.
The efficiency, η, is calculated as,
| η=qcondAge·Gs |
(8) |
where Age is the area of the external glass wall.
The numerical model was validated with XCPC collector test data obtained by Winston et al. [16,17] using Duratherm 600 thermal oil as the working fluid. Figure 3 shows the comparison of the thermal efficiency of the collector obtained from experimental data and numerical results for a range of inlet temperatures between 80 °C and 200 °C for a mass flow rate of thermal oil of 0.10 kg/s. The results agree reasonably well with the numerical model slightly under predicting the experimental data. Thus, by changing the thermophysical properties, it is possible to study the performance of such a collector using CO2 as the working fluid. Carbon dioxide does require the operation at high pressure but this paper intends to analyze the thermal performance of such a working fluid so no stress analysis has been performed to adjust pipe wall thicknesses.
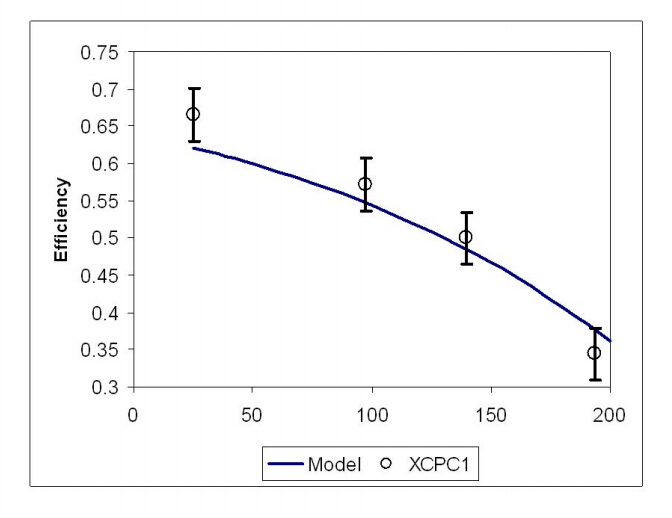 Figure 3. Validation of XCPC collector model with experimental test using Duratherm thermal oil at various input temperatures [17].
 The concentration ratio, the effective aperture area to the glass area, is significantly higher in PTCs than in XCPC systems. The model used in this paper for the high-temperature parabolic trough concentrator with evacuated-tube absorber follows the analysis by Odeh et al. [7] which simulates the LS2 design developed by SEGS(Solar Thermal Electric Generation Systems). The evacuated-tube collector consists of a metal absorber concentric to a glass tube. Figure 4 depicts the cross-sectional view of the assembly. The working fluid directly flows from one end of the metal absorber tube to the other, i.e. single-pass configuration. The metal absorber in this model is made from steel with a total length of 99 meters. This total length is composed of 4-meter long collectors connected in series with metallic bellows at each end, to allow for the expansion of the metal absorber. The annulus between the glass tube and steel absorber is under vacuum and the external surface of the absorber pipe is covered with a selective coating. Input dimensions and parameters for PTC model are presented in Table 2.
 Figure 4. Model of the PTC with evacuated-tube absorber.
| Component | Symbol | Value |
| Glass tube | ||
| Outer diameter | Dge | 115 mm |
| Inner diameter | Dg | 109 mm |
| Thermal conductivity | kg | 1.4 W/m∙K |
| Emissivity | eg | 0.90 |
| Evacuated-tube steel absorber | ||
| Outer diameter | DAe | 70 mm |
| Inner diameter | DA | 66 mm |
| Effective length | LD | 99 mm |
| Absorptivity | αA | 0.906 |
| Selective coating | ||
| Thermal conductivity | kA | 54 W/m∙K |
| Thickness | t0 | 1 mm |
DownLoad: CSVThe mathematical model was implemented in EES to simulate the performance of the PTC with the metal pipe inside an evacuated-tube as described in Odeh et al. [7].
The total heat loss of the glass tube, considering radiation from the glass to the sky, convection from the glass to the surrounding air, and heat loss from the bellows, is given as:
| qtotal,glass=σεg(T4g−T4sky)Age−h0(Tg−T∞)Age−Abh0(TA−T∞)ηb=0 |
(9) |
where Ab is the exposed surface area of the bellows, ηb is the bellows fin efficiency which is estimated to be 70 %, and Tsky is adapted from [18] and approximated to be:
| Tsky=T∞-8 | (10) |
The total heat loss of the absorber due to radiation exchange between the absorber and glass and the convection from the bellows is:
| qtotal,absorber=σ(T4A−T4g)1εAAA−DAeDg(1/εg−1)−h0(TA−T∞)ηb=0 |
(11) |
where the emissivity of the absorber, εA is defined as,
| A=0.00042×Twall−0.0995 |
(12) |
and Twall is the absorber wall temperature. Since we are assuming that the annulus, space between the glass and the absorber, is a perfect vacuum, the heat loss by conduction of the residual gas in the annulus is neglected. The energy from absorber is transferred to the working fluid as:
| qfluid=TA−TfluidRtotal |
(13) |
where Tfluid is the temperature of the fluid and Rtotalis the resistance by conduction and convection of the PTC given by Eq. 14.
The thermal resistance from the absorber pipe wall to the fluid has been calculated as follows:
| Rtotal=lnln(DAE/DA)2πLDkA+1πDALDhfluid |
(14) |
The efficiency formulation is obtained with the correlation provided by Odeh et al. [12]. The heat loss is given as
| q=(a+c·v)·(TA−T∞)+εA(T4A−T4sky) |
(15) |
where v is the wind velocity, and a, b, and c are coefficients. This formulation was developed to fit the LS2 collector type. This heat loss formulation is convenient since it depends solely on wind speed, absorber temperature, and ambient temperature. From S and ia National Laboratory testing on the LS2 collector, the parameters are a = 1.9182 × 10⁻² W/m2∙K, b = 2.02 × 10⁻⁹ W/m2∙K-4, and c = 6.612 × 10⁻³ J/m-3∙K. The efficiency formulation can be expressed in terms of the heat loss formulation from Eq. 15. The development of the efficiency formulation is in terms of absorber temperature rather than working input temperature in order to consider performance of other working fluids. The efficiency is given by:
| η=ηopt·Kτα−(a+c·v)·TA−T∞I−εA·b·T4A−T4skyI |
(16) |
where ηopt is the optical efficiency of the collector, I is solar irradiance, and Kτα is the incident angle modifier. From LS2 collector tests ran by Dudley et al. [19], ηopt is given as 73.3 % where incident angle modifier is
| Kτα=coscos(θ)+0.000994(θ)−0.00005369(θ)2 |
(17) |
where θ is the beam incidence angle to the collector normal.
Three cases were simulated to assess the performance of CO2 as the working fluid in the XCPC collector with a metal absorber. The ranges of values used for the operating parameters in the model are provided in Table 3. The first case analyzes the thermal efficiency of the collector as a function of working fluid inlet temperature for the range between 50 °C and 220 °C at three different mass flow rates(0.01, 0.02, and 0.03 kg/s). Figure 5 shows that efficiencies higher than 40 % can be obtained at operating temperatures near 200 °C. It is observed that the thermal efficiency is not a strong function of the mass flow rate for the range of values considered in this simulation. The second case, presents the analysis of the thermal efficiency as a function of inlet temperatures of CO2 at three different operating pressures, i.e. 9, 10, and 12 MPa. Figure 6, shows that the effect of operating pressure on the thermal efficiency is negligible for the three values of operating pressures modeled. Further reduction in pressure will cause a significant reduction in density of the working fluid so very high flow velocities would be required to maintain a fixed mass flow rate. Lastly, the third case analyzes the effect of solar irradiance on the difference between outlet and inlet fluid temperature(∆T = Tout - Tin)to the collector. Solar irradiance covers the range between 300 and 1, 000 W/m2 for three different pressures(8, 9 and 10 MPa). Figure 7 indicates that ∆T varies linearly with solar irradiance for the range of values considered in this simulation. A reduction in operating pressure decreases the density of the working fluid resulting in a larger temperature difference, especially at high values of solar irradiance.
| Case 1: Efficiency vs. input temperature at different flow rates | |
| Parameter | Range/Values |
| Temperature | 50 °C to 220 °C |
| Flow rate,
⋅m | 0.01, 0.02, 0.03 kg/s |
| Solar irradiance | 900 W/m2 |
| Case 2: Efficiency vs. input temperature at different pressures | |
| Parameter | Range/Values |
| Temperature | 50 °C to 220 °C |
| Pressure, P | 8, 9, 10 MPa |
| Solar irradiance | 900 W/m2 |
| Case 3: ∆T vs. solar irradiance at different pressures | |
| Parameter | Range/Values |
| Solar irradiance | 300 - 1000 W/m2 |
| Pressure, P | 8, 9, 10 MPa |
| Inlet temperature | 150 °C |
DownLoad: CSV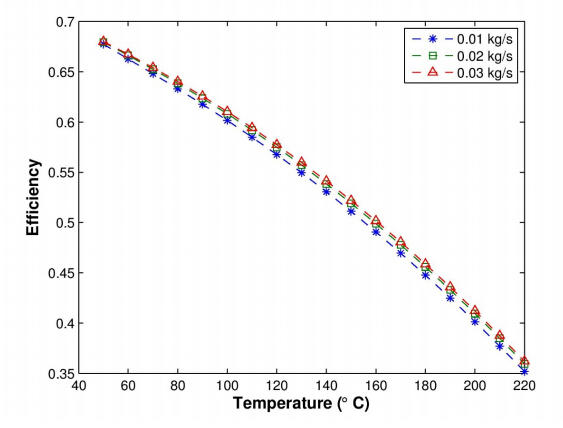 Figure 5. Thermal efficiency of XCPC with metal absorber for a range of inlet fluid temperatures between 50 °C and 200 °C, for three different mass flow rates of: 0.01 kg/s, 0.02 kg/s, and 0.03 kg/s and fixed value of pressure of 10 MPa.
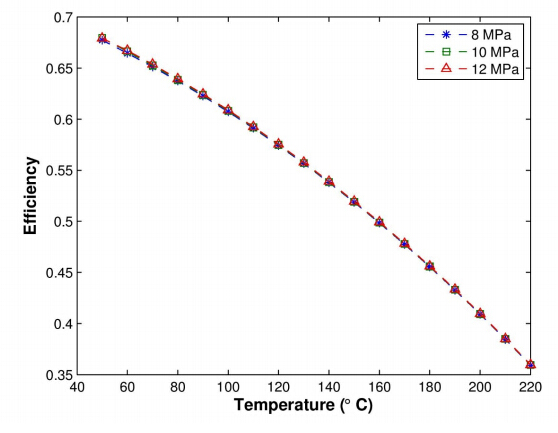 Figure 6. Thermal efficiency of XCPC with metal absorber for a range of inlet fluid temperatures between 50 °C and 200 °C, for three different operating pressures of CO2: 8 MPa, 10 MPa, and 12 MPa and fixed mass flow rate of 0.01 kg/s.
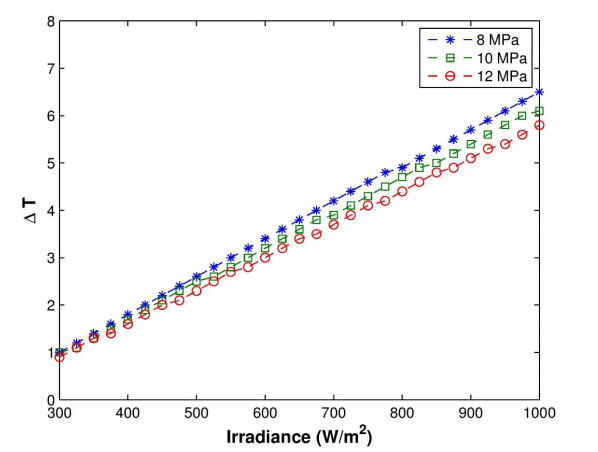 Figure 7. Variation between outlet and inlet fluid temperature(∆T = Tout - Tin)for an XCPC collector with metal absorber for an inlet temperature of Tin = 150 °C. The range of solar irradiation varies between 300 to 1000 W/m2 and three different operating pressures of CO2 have been simulated: 8 MPa, 10 MPa, and 12 MPa and for a fixed mass flow rate of 0.01 kg/s.
The analysis compares the overall heat loss of Syltherm 800 thermal oil and CO2 for a range of fluid temperatures above ambient, i.e. Tfluid - T∞. The ranges of values used for the operating parameters in the model are provided in Table 4. Because of the properties of Syltherm 800, the maximum physical operable temperature is 400 °C. From Figure 8, it is seen that below 400 °C, the heat loss using CO2 is comparable to Syltherm 800 at the same mass flow rate of 0.8 kg/s. The main difference is that the thermophysical properties of CO2 remain stable so the simulation can be extended to a range of ∆T near 600 °C. Due to the high operating pressure, it is desirable to minimize the CO2 charge on the system. Thus, it is of interest to study the effect of lower mass flow rates on the total heat loss. Figure 8, shows total heat loss as a function of CO2 mass flow rate for 0.8 kg/s, 0.2 kg/s and 0.08 kg/s. It is observed that at 600 °C above ambient temperature, the total heat loss for the CO2 system increased approximately 10 % at 0.2 kg/s and 20 % at 0.08 kg/s compared to the heat loss at a mass flow rate of 0.8 kg/s.
| Heat loss vs. ∆T for CO2 and Syltherm 800 | |
| Tfluid - T∞ | CO2: 50 °C to 600 °C, Syltherm 800: 50 °C to 400 °C |
| Flow rate,
⋅m | CO2: 0.08, 0.2, and 0.8 kg/s, Syltherm 800: 0.8 kg/s |
| Pressure, P | CO2: 12 MPa |
| Solar irradiance | 1000 W/m2 |
DownLoad: CSV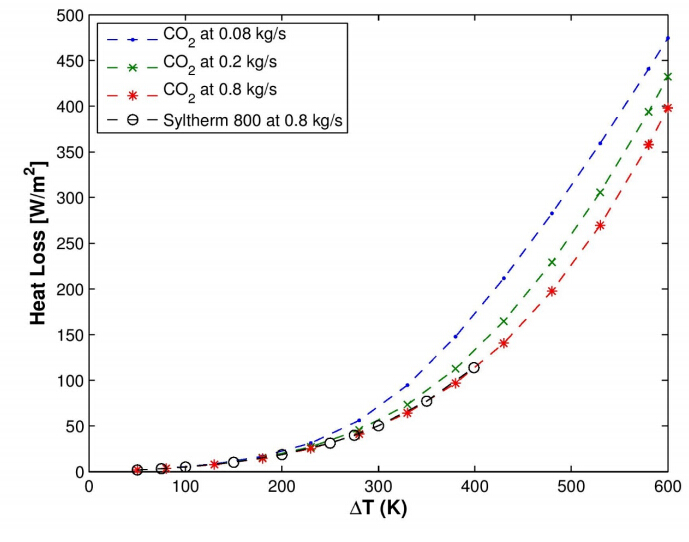 Figure 8. Total heat loss for a PTC with evacuated-tube absorber for a range of fluid temperatures above ambient between 50 °C and 600 °C. Mass flow rates of 0.08, 0.2, and 0.8 kg/s was used for CO2, and 0.8 kg/s for Syltherm 800 with a set pressure of 12 MPa for CO2.
In this study, two models of solar thermal collectors were implemented to analyze the performance of CO2 as a working fluid. The model of the XCPC with metal absorber, for medium operating temperatures, shows that thermal efficiencies comparable to thermal oils can be achieved using CO2 as the working fluid. The main drawback is the high operating pressure needed. For the model of the PTC with evacuated-tube absorber, for high operating temperatures, the heat loses using CO2 were also comparable to the ones obtained using Syltherm 800 but due to the thermal stability of carbon dioxide, a much larger range of fluid temperatures above ambient can be analyzed.
This project has been partially funded by the California Energy Commission, Contract#: POEF01-M04.
Age Area of the external glass wall, [m2]
At Cross-sectional area of the absorber fin, [m2]
Cmax Concentration ratio of reflectors
Cp Specific heat of working fluid, [J/kg∙K] DA Inner diameter of the metal absorber, [m]
DAe Outer diameter of the metal absorber, [m]
Dg Inner diameter of the glass tube, [m]
DO Inner diameter of the external pipe, [m]
DOe Outer diameter of the external pipe, [m]
Gc Total irradiance incident on the absorber, [W/m2]
GS Solar irradiance incident on concentrator aperature, [W/m2]
h0 Convection coefficient on outside of glass cover, [W/m2∙K]
hfluid Convection coefficient of working fluid, [W/m2∙K]
I Solar irradiance, [W/m2]
kA Thermal conductivity of the selective coating on the metal absorber, [W/m∙K]
kCu Thermal conductivity of copper pipe, [W/m∙K]
Kτα Incident angle modifier
LD Effective length of the absorber, [m]
.m
q Heat transfer, [W]
q” Heat flux, [W/m2]
Rtotal Total thermal resistance from the external wall of the pipe to the fluid, [m]
t0 Thickness of selective coating, [m]
T Temperature of working fluid, [K]
TA Temperature of absorber, [K] Tb Temperature of the fin at contact point with the external copper pipe, [K]
Tfluid Temperature of the working fluid, [K]
Tg Temperature of glass cover, [K] Tin Inlet temperature of working fluid, [K]
Tout Outlet temperature of working fluid, [K]
Tsky Temperature of atmosphere, [K]
Twall Absorber wall temperature, [K]
T∞ Tempreature of ambient air, [K]
v Wind velocity, [m/s]
x Arc length of absorber fin, [m]
Greek Symbols
αA Absorptivity of the absorber
αg Absorptivity of the glass
εA Emissivity of the metal absorber
εg Emissivity of the glass
τg Transmissivity of glass
ρg Reflectivity of glass
η Efficiency of the collectors
ηb Fin efficiency of the bellows
ηopt Optical efficiency of the collectors
κ Absorption coefficient of absorber fin
| [1] |
A. G. Mathioudakis, G. A. Mathioudakis, The phenotypes of chronic obstructive pulmonary disease, Arch. Hellenic Med., 31 (2014), 558-569. https://doi.org/10.1080/15412550701629663 doi: 10.1080/15412550701629663

|
| [2] | GOLD 2022: Global initiative for chronic obstructive lung disease, 2022. |
| [3] |
D. A. Suffredini, R. M. Reed, At the twisted heart of nicotine addiction, BMJ Case Rep., 2012. https://doi.org/10.1136/bcr-2012-006240 doi: 10.1136/bcr-2012-006240
|
| [4] |
P. W. Jones, Health status measurement in chronic obstructive pulmonary disease, Thorax, 56 (2001). https://doi.org/10.1201/9780203913406-14 doi: 10.1201/9780203913406-14
|
| [5] |
C. D. Brown, J. O. Benditt, F. C. Sciurba, S. M. Lee, G. J. Criner, Z. Mosenifar, et al., Exercise testing in severe emphysema: association with quality of life and lung function, COPD J. Chron. Obstruct. Pulm. Dis., 5 (2008), 117-124. https://doi.org/10.1080/15412550801941265 doi: 10.1080/15412550801941265
|
| [6] |
D. A. Lynch, Progress in Imaging COPD, 2004-2014, Chron. Obstruct. Pulm. Dis.: J. COPD Found., 1 (2014), 73-82. https://doi.org/10.15326/jcopdf.1.1.2014.0125 doi: 10.15326/jcopdf.1.1.2014.0125
|
| [7] |
P. J. Castaldi, R. S. J. Estépar, C. S. Mendoza, C. P. Hersh, N. Laird, J. D. Crapo, et al., Distinct quantitative computed tomography emphysema patterns are associated with physiology and function in smokers, Am. J. Respir. Crit. Care Med., 188 (2013), 1083-1090. https://doi.org/10.1164/rccm.201305-0873oc doi: 10.1164/rccm.201305-0873oc
|
| [8] |
T. B. Grydeland, A. Dirksen, H. O. Coxson, T. M. Eagan, E. Thorsen, S. G. Pillai, et al., Quantitative computed tomography measures of emphysema and airway wall thickness are related to respiratory symptoms, Am. J. Respir. Crit. Care Med., 181 (2010), 353-359. https://doi.org/10.1164/rccm.200907-1008oc doi: 10.1164/rccm.200907-1008oc
|
| [9] |
V. Kim, A. Davey, A. P. Comellas, M. K. Han, G. Washko, C. H. Martinez, et al., Clinical and computed tomographic predictors of chronic bronchitis in COPD: a cross Sectional analysis of the COPDGene study, Respir. Res., 15 (2014), 1-9. https://doi.org/10.1186/1465-9921-15-52 doi: 10.1186/1465-9921-15-52
|
| [10] |
S. P. Bhatt, N. L. Terry, H. Nath, J. A. Zach, J. Tschirren, M. S. Bolding, et al., Association between expiratory central airway collapse and respiratory outcomes among smokers, Jama, 315 (2016), 498-505. https://doi.org/10.1164/rccm.202008-3122le doi: 10.1164/rccm.202008-3122le
|
| [11] |
C. P. Hersh, G. R. Washko, R. S. J. Estépar, S. Lutz, P. J. Friedman, M. K. Han, et al., Paired inspiratory-expiratory chest CT scans to assess for small airways disease in COPD, Respir. Res., 14 (2013), 1-11. https://doi.org/10.1164/ajrccm-conference.2012.185.1_meetingabstracts.a6539 doi: 10.1164/ajrccm-conference.2012.185.1_meetingabstracts.a6539
|
| [12] |
S. Bodduluri, J. M. Reinhardt, E. A. Hoffman, J. D. Newell Jr, H. Nath, M. T. Dransfield, et al., Signs of gas trapping in normal lung density regions in smokers, Am. J. Respir. Crit. Care Med., 196 (2017), 1404-1410. https://doi.org/10.1164/rccm.201705-0855oc doi: 10.1164/rccm.201705-0855oc
|
| [13] |
C. J. Galbán, M. K. Han, J. L. Boes, K. A. Chughtai, C. R. Meyer, T. D. Johnson, et al. Computed tomography-based biomarker provides unique signature for diagnosis of COPD phenotypes and disease progression, Nat. Med., 18 (2012), 1711-1715. https://doi.org/10.1038/nm.2971 doi: 10.1038/nm.2971
|
| [14] |
S. Bodduluri, S. P. Bhatt, E. A. Hoffman, J. D. Newell, C. H. Martinez, M. T. Dransfield, et al., Biomechanical CT metrics are associated with patient outcomes in COPD, Thorax, 72 (2017), 409-414. https://doi.org/10.1136/thoraxjnl-2016-209544 doi: 10.1136/thoraxjnl-2016-209544
|
| [15] |
S. P. Bhatt, S. Bodduluri, E. A. Hoffman, J. D. Newell Jr, J. C. Sieren, M. T. Dransfield, et al., Computed tomography measure of lung at risk and lung function decline in chronic obstructive pulmonary disease, Am. J. Respir. Crit. Care Med., 196 (2017), 569-576. https://doi.org/10.1164/rccm.201701-0050oc doi: 10.1164/rccm.201701-0050oc
|
| [16] |
G. R. Washko, G. L. Kinney, J. C. Ross, R. S. J. Estépar, M. K. Han, M. T. Dransfield, et al., Lung Mass in Smokers, Acad. Radiol., 24 (2016), 386-392. https://doi.org/10.1016/j.acra.2016.10.011 doi: 10.1016/j.acra.2016.10.011
|
| [17] |
J. M. Wells, G. R. Washko, M. K. Han, N. Abbas, H. Nath, A. J. Mamary, et al., Pulmonary arterial enlargement and acute exacerbations of COPD, N. Engl. J. Med., 367 (2012), 913-921. https://doi.org/10.1136/thoraxjnl-2013-203397 doi: 10.1136/thoraxjnl-2013-203397
|
| [18] |
R. S. J. Estépar, G. L. Kinney, J. L. Black-Shinn, R. P. Bowler, G. L. Kindlmann, J. C. Ross, et al., Computed tomographic measures of pulmonary vascular morphology in smokers and their clinical implications, Am. J. Respir. Crit. Care Med., 188 (2013), 231-239. https://doi.org/10.1164/rccm.201301-0162oc doi: 10.1164/rccm.201301-0162oc
|
| [19] |
P. Lambin, E. Rios-Velazquez, R. Leijenaar, S. Carvalho, R. G. Van Stiphout, P. Granton, et al., Radiomics: Extracting more information from medical images using advanced feature analysis, Eur. J. Cancer, 43 (2007), 441-446. https://doi.org/10.1016/j.ejca.2011.11.036 doi: 10.1016/j.ejca.2011.11.036
|
| [20] |
A. N. Frix, F. Cousin, T. Refaee, F. Bottari, A. Vaidyanathan, C. Desir, et al., Radiomics in lung diseases imaging: State-of-the-art for clinicians, J. Pers. Med., 11 (2021), 1-20. https://doi.org/10.3390/jpm11070602 doi: 10.3390/jpm11070602
|
| [21] |
S. M. Rezaeijo, R. Abedi-Firouzjah, M. Ghorvei, S. Sarnameh, Screening of COVID-19 based on the extracted radiomics features from chest CT images, J. X-Ray Sci. Technol., 29 (2021), 1-15. https://doi.org/10.3233/xst-200831 doi: 10.3233/xst-200831
|
| [22] |
F. Xiao, R. Sun, W. Sun, D. Xu, L. Lan, H. Li, et al., Radiomics analysis of chest CT to predict the overall survival for the severe patients of COVID-19 pneumonia, Phys. Med. Biol., 66 (2021), 1-11. https://doi.org/10.1088/1361-6560/abf717 doi: 10.1088/1361-6560/abf717
|
| [23] |
F. Xiong, Y. Wang, T. You, H. Li, T. Fu, H. Tan, et al., The clinical classification of patients with COVID-19 pneumonia was predicted by Radiomics using chest CT, Medicine, 100 (2021), 1-8. https://doi.org/10.1097/md.0000000000025307 doi: 10.1097/md.0000000000025307
|
| [24] |
M. Tamal, M. Alshammari, M. Alabdullah, R. Hourani, H. A. Alola, T. M. Hegazi, An integrated framework with machine learning and radiomics for accurate and rapid early diagnosis of COVID-19 from chest x-ray, Expert Syst. Appl., 180 (2021), 1-8. https://doi.org/10.1101/2020.10.01.20205146 doi: 10.1101/2020.10.01.20205146
|
| [25] |
Y. Tang, T. Zhang, X. Zhou, Y. Zhao, H. Xu, Y. Liu, et al., The preoperative prognostic value of the radiomics nomogram based on CT combined with machine learning in patients with intrahepatic cholangiocarcinoma, World J. Surg. Oncol., 19 (2021), 1-13. https://doi.org/10.1186/s12957-021-02162-0 doi: 10.1186/s12957-021-02162-0
|
| [26] |
X. Han, J. Yang, J. Luo, P. Chen, Z. Zhang, A. Alu, et al., Application of CT-based radiomics in discriminating pancreatic cystadenomas from pancreatic neuroendocrine tumors using machine learning methods, Front. Oncol., 11 (2021), 1-13. https://doi.org/10.3389/fonc.2021.606677 doi: 10.3389/fonc.2021.606677
|
| [27] | M. F. A. Chaudhary, E. A. Hoffman, A. P. Comellas, J. Guo, S. Fortis, S. Bodduluri, et al., CT texture features predict severe COPD exacerbations in spiromics, in American Thoracic Society 2021 International Conference, (2021), 1122-1122. https://doi.org/10.1164/ajrccm-conference.2021.203.1_meetingabstracts.a1122 |
| [28] |
M. Occhipinti, M. Paoletti, B. J. Bartholmai, S. Rajagopalan, R. A. Karwoski, C. Nardi, et al., Spirometric assessment of emphysema presence and severity as measured by quantitative CT and CT-based radiomics in COPD, Respir. Res., 20 (2019), 1-11. https://doi.org/10.1186/s12931-019-1049-3 doi: 10.1186/s12931-019-1049-3
|
| [29] |
G. Wu, A. Ibrahim, I. Halilaj, R. T. Leijenaar, W. Rogers, H. A. Gietema, et al., The emerging role of radiomics in COPD and lung cancer, Respiration, 99 (2020), 99-107. https://doi.org/10.1159/000505429 doi: 10.1159/000505429
|
| [30] |
G. Maragatham, S. Rajendran, Improving the classifier accuracy with an integrated approach using medical data-a study, Int. J. Med. Eng. Inf., 12 (2020), 313-321. https://doi.org/10.1504/ijmei.2020.10029317 doi: 10.1504/ijmei.2020.10029317
|
| [31] |
D. Lu, Q. Weng, A survey of image classification methods and techniques for improving classification performance, Int. J. Remote Sens., 28 (2007), 823-870. https://doi.org/10.1080/01431160600746456 doi: 10.1080/01431160600746456
|
| [32] |
R. C. Au, W. C. Tan, J. Bourbeau, J. C. Hogg, M. Kirby, Impact of image pre-processing methods on computed tomography radiomics features in chronic obstructive pulmonary disease, Phys. Med. Biol., 66 (2021). https://doi.org/10.2139/ssrn.3349696 doi: 10.2139/ssrn.3349696
|
| [33] |
J. Yun, Y. H. Cho, S. M. Lee, J. Hwang, J. S. Lee, Y. M. Oh, et al., Deep radiomics-based survival prediction in patients with chronic obstructive pulmonary disease, Sci. Rep., 11 (2021), 1-9. https://doi.org/10.1038/s41598-021-94535-4 doi: 10.1038/s41598-021-94535-4
|
| [34] | R. C. Au, W. C. Tan, J. Bourbeau, J. C. Hogg, M. Kirby, Radiomics Analysis to Predict Presence of Chronic Obstructive Pulmonary Disease and Symptoms Using Machine Learning, in TP121 COPD: FROM CELLS TO THE CLINIC, American Thoracic Society, 2021. https://doi.org/10.1164/ajrccm-conference.2021.203.1_meetingabstracts.a4568 |
| [35] | C. Liang, J. Xu, F. Wang, H. Chen, J. Tang, D. Chen, et al., Development of a radiomics model for predicting COPD exacerbations based on complementary visual information, in TP041 DIAGNOSIS AND RISK ASSESSMENT IN COPD, American Thoracic Society, 2021. https://doi.org/10.1164/ajrccm-conference.2021.203.1_meetingabstracts.a2296 |
| [36] |
Y. Yang, W. Li, Y. Guo, Y. Liu, Q. Li, K. Yang, et al., Early COPD risk decision for adults aged from 40 to 79 years based on lung radiomics features, Front. Med., 9 (2022), 1-15. https://doi.org/10.3389/fmed.2022.845286 doi: 10.3389/fmed.2022.845286
|
| [37] |
Y. Yang, W. Li, Y. Kang, Y. Guo, K. Yang, Q. Li, et al., A novel lung radiomics feature for characterizing resting heart rate and COPD stage evolution based on radiomics feature combination strategy, Math. Biosci. Eng., 19 (2022), 4145-4165. https://doi.org/10.3934/mbe.2022191 doi: 10.3934/mbe.2022191
|
| [38] |
Y. Zhou, P. L. Bruijnzeel, C. McCrae, J. Zheng, U. Nihlen, R. Zhou, et al., Study on risk factors and phenotypes of acute exacerbations of chronic obstructive pulmonary disease in Guangzhou, China-design and baseline characteristics, J. Thorac. Dis., 7 (2015), 720-733. https://doi:10.3978/j.issn.2072-1439.2015.04.14 doi: 10.3978/j.issn.2072-1439.2015.04.14
|
| [39] |
J. Hofmanninger, F. Prayer, J. Pan, S. Rohrich, H. Prosch, G. Langs, Automatic lung segmentation in routine imaging is a data diversity problem, not a methodology problem, Eur. Radiol. Exp., 4 (2020), 1-13. https://doi.org/10.1186/s41747-020-00173-2 doi: 10.1186/s41747-020-00173-2
|
| [40] |
Y. Yang, Q. Li, Y. Guo, Y. Liu, X. Li, J. Guo, et al., Lung parenchyma parameters measure of rats from pulmonary window computed tomography images based on ResU-Net model for medical respiratory researches, Math. Biosci. Eng., 18 (2021), 4193-4211. https://doi.org/10.3934/mbe.2021210 doi: 10.3934/mbe.2021210
|
| [41] | Y. Yang, Y. Guo, J. Guo, Y. Gao, Y. Kang, A method of abstracting single pulmonary lobe from computed tomography pulmonary images for locating COPD, in Proceedings of the Fourth International Conference on Biological Information and Biomedical Engineering, (2020), 1-6. https://doi.org/10.1145/3403782.3403805 |
| [42] |
J. J. M. van Griethuysen, A. Fedorov, C. Parmar, A. Hosny, N. Aucoin, V. Narayan, et al., Computational radiomics system to decode the radiographic phenotype, Cancer Res., 77 (2017), 104-107. https://doi.org/10.1158/0008-5472.can-17-0339 doi: 10.1158/0008-5472.can-17-0339
|
| [43] |
R. Tibshirani, Regression shrinkage and selection via the Lasso, J. R. Stat. Soc. B, 58 (2007), 267-288. https://doi.org/10.1111/j.2517-6161.1996.tb02080.x doi: 10.1111/j.2517-6161.1996.tb02080.x
|
| [44] |
N. Simon, J. Friedman, T. Hastie, R. Tibshirani, Regularization paths for Cox's proportional hazards model via coordinate descent, J. Stat. Software, 39 (2011), 1-13. https://doi.org/10.18637/jss.v039.i05 doi: 10.18637/jss.v039.i05
|
| [45] | Y. Qi, Random forest for bioinformatics, in Ensemble machine learning: methods and applications, Springer, Boston, MA, (2012), 307-323. https://doi.org/10.1007/978-1-4419-9326-7_11 |
| [46] | T. H. Kim, D. C. Park, D. M. Woo, T. Jeong, S. Y. Min, Multi-class classifier-based adaboost algorithm, in International conference on intelligent science and intelligent data engineering, Springer, Berlin, Heidelberg, (2011), 122-127. https://doi.org/10.1007/978-3-642-31919-8_16 |
| [47] | V. K. Ayyadevara, Gradient boosting machine, in Pro machine learning algorithms, Apress, Berkeley, CA, (2018), 117-134. https://doi.org/10.1007/978-1-4842-3564-5_6 |
| [48] |
M. Taki, A. Rohani, F. Soheili-Fard, A. Abdeshahi, Assessment of energy consumption and modeling of output energy for wheat production by neural network (MLP and RBF) and Gaussian process regression (GPR) models, J. Cleaner Prod. 172 (2018), 3028-3041. https://doi.org/10.1016/j.jclepro.2017.11.107 doi: 10.1016/j.jclepro.2017.11.107
|
| [49] |
W. Hu, W. Hu, S. Maybank, Adaboost-based algorithm for network intrusion detection, IEEE Trans. Syst. Man Cybern. Part B Cybern., 38 (2008), 577-583. https://doi.org/10.1109/tsmcb.2007.914695 doi: 10.1109/tsmcb.2007.914695
|
| [50] | S. Suthaharan, Support vector machine, in Machine learning models and algorithms for big data classification, Springer, Boston, MA, (2016), 207-235. https://doi.org/10.1007/978-1-4899-7641-3_9 |
| [51] |
Q. Li, Y. Yang, Y. Guo, W. Li, Y. Liu, H. Liu, et al., Performance evaluation of deep learning classification network for image features, IEEE Access, 9 (2021), 9318-9333. https://doi.org/10.1109/access.2020.3048956 doi: 10.1109/access.2020.3048956
|
| [52] |
M. A. Carbonneau, V. Cheplygina, E. Granger, G. Gagnon, Multiple instance learning: A survey of problem characteristics and applications, Pattern Recognit., 77 (2018), 329-353. https://doi.org/10.1016/j.patcog.2017.10.009 doi: 10.1016/j.patcog.2017.10.009
|
| [53] |
H. Polat, H. D. Mehr, Classification of pulmonary CT images by using hybrid 3D-deep convolutional neural network architecture, Appl. Sci., 9 (2019), 1-15. https://doi.org/10.3390/app9050940 doi: 10.3390/app9050940
|
| [54] |
A. Chon, N. Balachandar, P. Lu, Deep convolutional neural networks for lung cancer detection, Standford Univ., (2017), 1-9. https://doi.org/10.1109/uemcon47517.2019.8993023 doi: 10.1109/uemcon47517.2019.8993023
|
| [55] |
S. P. Singh, L. Wang, S. Gupta, H. Goli, P. Padmanabhan, B. Gulyás, 3D deep learning on medical images: a review, Sensors, 20 (2020), 1-24. https://doi.org/10.3390/s20185097 doi: 10.3390/s20185097
|
| [56] |
B. H. Lee, D. H. Oh, T. Y. Kim, 3D Virtual reality game with deep learning-based hand gesture recognition, J. Korea Comput. Graphics Soc., 24 (2018), 41-48. https://doi.org/10.15701/kcgs.2018.24.5.41 doi: 10.15701/kcgs.2018.24.5.41
|
| [57] |
B. George, S. Seals, I. Aban, Survival analysis and regression models, J. Nucl. Cardiol., 21 (2014), 686-694. https://doi.org/10.1007/s12350-014-9908-2 doi: 10.1007/s12350-014-9908-2
|
| [58] | L. Torrey, J. Shavlik, Transfer learning, in Handbook of research on machine learning applications and trends: algorithms, methods, and techniques, IGI global, (2010), 242-264. https://doi.org/10.4018/978-1-60566-766-9.ch011 |
| 1. | Dimitrios N. Korres, Christos Tzivanidis, Investigation of a novel small-sized bifacial cavity PTC and comparison with conventional configurations, 2020, 17, 24519049, 100355, 10.1016/j.tsep.2019.100355 | |
| 2. | V. Pranesh, R. Velraj, S. Christopher, V. Kumaresan, A 50 year review of basic and applied research in compound parabolic concentrating solar thermal collector for domestic and industrial applications, 2019, 187, 0038092X, 293, 10.1016/j.solener.2019.04.056 | |
| 3. | Ravindra Vutukuru, A. Saikiran Pegallapati, Ramgopal Maddali, Suitability of various heat transfer fluids for high temperature solar thermal systems, 2019, 159, 13594311, 113973, 10.1016/j.applthermaleng.2019.113973 | |
| 4. | A Review of the Compound Parabolic Concentrator (CPC) with a Tubular Absorber, 2020, 13, 1996-1073, 695, 10.3390/en13030695 | |
| 5. | Aggrey Mwesigye, İbrahim Halil Yılmaz, Thermal and thermodynamic optimization of the performance of a large aperture width parabolic trough solar collector using gaseous and supercritical CO2 as heat transfer fluids, 2023, 37, 24519049, 101543, 10.1016/j.tsep.2022.101543 | |
| 6. | Ramzul Irham Riza, Tawfiq Chekifi, Moustafa Boukraa, 2023, 2766, 0094-243X, 030019, 10.1063/5.0153800 | |
| 7. | Amal Herez, Hassan Jaber, Hicham El Hage, Thierry Lemenand, Mohamad Ramadan, Mahmoud Khaled, A review on the classifications and applications of solar photovoltaic technology, 2023, 11, 2333-8334, 1102, 10.3934/energy.2023051 | |
| 8. | Abdulelah Alhamayani, Moaz Al-lehaibi, The effect of adding hybrid nanoparticles (Al2O3–TiO2) on the performance of parabolic trough solar collectors using different thermal oils and molten salts, 2024, 59, 2214157X, 104593, 10.1016/j.csite.2024.104593 | |
| 9. | Ruben Bartali, Emanuele De Bona, Michele Bolognese, Alessandro Vaccari, Matteo Testi, Luigi Crema, Hybrid Small Modular Nuclear Reactor with Concentrated Solar Power: Towards 4+ Reactors?, 2025, 5, 2673-9941, 12, 10.3390/solar5010012 |
Figures(15) / Tables(12)

Yingjian Yang, Wei Li, Yingwei Guo, Nanrong Zeng, Shicong Wang, Ziran Chen, Yang Liu, Huai Chen, Wenxin Duan, Xian Li, Wei Zhao, Rongchang Chen, Yan Kang. Lung radiomics features for characterizing and classifying COPD stage based on feature combination strategy and multi-layer perceptron classifier[J]. Mathematical Biosciences and Engineering, 2022, 19(8): 7826-7855. doi: 10.3934/mbe.2022366

| Component | Material | Symbol | Value |
| Glass tube | Pyrex 7740 | ||
| Outer diameter | Dge | 65 mm | |
| Inner diameter | Dg | 61 mm | |
| Thermal Conductivity | kg | 1.4 W/m·K | |
| Emissivity | eg | 0.92 | |
| Metal absorber/fin | Copper | ||
| Outer diameter | DAe | 56 mm | |
| Thickness | t0 | 1 mm | |
| Effective length | LD | 1, 640 mm | |
| Absorptivity | aA | 0.95 | |
| Emissivity | eA | 0.01 | |
| Selective coating | Metal aluminum nitride cermet | ||
| Thermal conductivity | kA | 200 W/m·K | |
| Coaxial pipes | Copper | ||
| External pipe, outer diameter | DOe | 30 mm | |
| External pipe, inner diameter | Do | 26.6 mm | |
| Internal pipe, outer diameter | DIe | 8 mm | |
| Internal pipe, inner diameter | DI | 6 mm | |
| Hydraulic diameter | Dh | 3.5 mm | |
| Thermal conductivity | kCu | 320 W/m·K |
DownLoad: CSV| Component | Symbol | Value |
| Glass tube | ||
| Outer diameter | Dge | 115 mm |
| Inner diameter | Dg | 109 mm |
| Thermal conductivity | kg | 1.4 W/m∙K |
| Emissivity | eg | 0.90 |
| Evacuated-tube steel absorber | ||
| Outer diameter | DAe | 70 mm |
| Inner diameter | DA | 66 mm |
| Effective length | LD | 99 mm |
| Absorptivity | αA | 0.906 |
| Selective coating | ||
| Thermal conductivity | kA | 54 W/m∙K |
| Thickness | t0 | 1 mm |
DownLoad: CSV| Case 1: Efficiency vs. input temperature at different flow rates | |
| Parameter | Range/Values |
| Temperature | 50 °C to 220 °C |
| Flow rate,
⋅m | 0.01, 0.02, 0.03 kg/s |
| Solar irradiance | 900 W/m2 |
| Case 2: Efficiency vs. input temperature at different pressures | |
| Parameter | Range/Values |
| Temperature | 50 °C to 220 °C |
| Pressure, P | 8, 9, 10 MPa |
| Solar irradiance | 900 W/m2 |
| Case 3: ∆T vs. solar irradiance at different pressures | |
| Parameter | Range/Values |
| Solar irradiance | 300 - 1000 W/m2 |
| Pressure, P | 8, 9, 10 MPa |
| Inlet temperature | 150 °C |
DownLoad: CSV| Heat loss vs. ∆T for CO2 and Syltherm 800 | |
| Tfluid - T∞ | CO2: 50 °C to 600 °C, Syltherm 800: 50 °C to 400 °C |
| Flow rate,
⋅m | CO2: 0.08, 0.2, and 0.8 kg/s, Syltherm 800: 0.8 kg/s |
| Pressure, P | CO2: 12 MPa |
| Solar irradiance | 1000 W/m2 |
DownLoad: CSV| Component | Material | Symbol | Value |
| Glass tube | Pyrex 7740 | ||
| Outer diameter | Dge | 65 mm | |
| Inner diameter | Dg | 61 mm | |
| Thermal Conductivity | kg | 1.4 W/m·K | |
| Emissivity | eg | 0.92 | |
| Metal absorber/fin | Copper | ||
| Outer diameter | DAe | 56 mm | |
| Thickness | t0 | 1 mm | |
| Effective length | LD | 1, 640 mm | |
| Absorptivity | aA | 0.95 | |
| Emissivity | eA | 0.01 | |
| Selective coating | Metal aluminum nitride cermet | ||
| Thermal conductivity | kA | 200 W/m·K | |
| Coaxial pipes | Copper | ||
| External pipe, outer diameter | DOe | 30 mm | |
| External pipe, inner diameter | Do | 26.6 mm | |
| Internal pipe, outer diameter | DIe | 8 mm | |
| Internal pipe, inner diameter | DI | 6 mm | |
| Hydraulic diameter | Dh | 3.5 mm | |
| Thermal conductivity | kCu | 320 W/m·K |
| Component | Symbol | Value |
| Glass tube | ||
| Outer diameter | Dge | 115 mm |
| Inner diameter | Dg | 109 mm |
| Thermal conductivity | kg | 1.4 W/m∙K |
| Emissivity | eg | 0.90 |
| Evacuated-tube steel absorber | ||
| Outer diameter | DAe | 70 mm |
| Inner diameter | DA | 66 mm |
| Effective length | LD | 99 mm |
| Absorptivity | αA | 0.906 |
| Selective coating | ||
| Thermal conductivity | kA | 54 W/m∙K |
| Thickness | t0 | 1 mm |
| Case 1: Efficiency vs. input temperature at different flow rates | |
| Parameter | Range/Values |
| Temperature | 50 °C to 220 °C |
| Flow rate,
⋅m | 0.01, 0.02, 0.03 kg/s |
| Solar irradiance | 900 W/m2 |
| Case 2: Efficiency vs. input temperature at different pressures | |
| Parameter | Range/Values |
| Temperature | 50 °C to 220 °C |
| Pressure, P | 8, 9, 10 MPa |
| Solar irradiance | 900 W/m2 |
| Case 3: ∆T vs. solar irradiance at different pressures | |
| Parameter | Range/Values |
| Solar irradiance | 300 - 1000 W/m2 |
| Pressure, P | 8, 9, 10 MPa |
| Inlet temperature | 150 °C |
| Heat loss vs. ∆T for CO2 and Syltherm 800 | |
| Tfluid - T∞ | CO2: 50 °C to 600 °C, Syltherm 800: 50 °C to 400 °C |
| Flow rate,
⋅m | CO2: 0.08, 0.2, and 0.8 kg/s, Syltherm 800: 0.8 kg/s |
| Pressure, P | CO2: 12 MPa |
| Solar irradiance | 1000 W/m2 |
