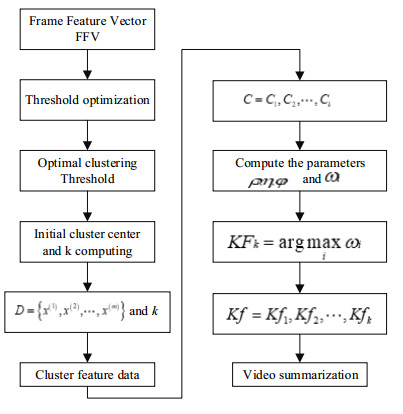
Numerous limitations of Shot-based and Content-based key-frame extraction approaches have encouraged the development of Cluster-based algorithms. This paper proposes an Optimal Threshold and Maximum Weight (OTMW) clustering approach that allows accurate and automatic extraction of video summarization. Firstly, the video content is analyzed using the image color, texture and information complexity, and video feature dataset is constructed. Then a Golden Section method is proposed to determine the threshold function optimal solution. The initial cluster center and the cluster number k are automatically obtained by employing the improved clustering algorithm. k-clusters video frames are produced with the help of K-MEANS algorithm. The representative frame of each cluster is extracted using the Maximum Weight method and an accurate video summarization is obtained. The proposed approach is tested on 16 multi-type videos, and the obtained key-frame quality evaluation index, and the average of Fidelity and Ratio are 96.11925 and 97.128, respectively. Fortunately, the key-frames extracted by the proposed approach are consistent with artificial visual judgement. The performance of the proposed approach is compared with several state-of-the-art cluster-based algorithms, and the Fidelity are increased by 12.49721, 10.86455, 10.62984 and 10.4984375, respectively. In addition, the Ratio is increased by 1.958 on average with small fluctuations. The obtained experimental results demonstrate the advantage of the proposed solution over several related baselines on sixteen diverse datasets and validated that proposed approach can accurately extract video summarization from multi-type videos.
Citation: Yunyun Sun, Peng Li, Zhaohui Jiang, Sujun Hu. Feature fusion and clustering for key frame extraction[J]. Mathematical Biosciences and Engineering, 2021, 18(6): 9294-9311. doi: 10.3934/mbe.2021457
Numerous limitations of Shot-based and Content-based key-frame extraction approaches have encouraged the development of Cluster-based algorithms. This paper proposes an Optimal Threshold and Maximum Weight (OTMW) clustering approach that allows accurate and automatic extraction of video summarization. Firstly, the video content is analyzed using the image color, texture and information complexity, and video feature dataset is constructed. Then a Golden Section method is proposed to determine the threshold function optimal solution. The initial cluster center and the cluster number k are automatically obtained by employing the improved clustering algorithm. k-clusters video frames are produced with the help of K-MEANS algorithm. The representative frame of each cluster is extracted using the Maximum Weight method and an accurate video summarization is obtained. The proposed approach is tested on 16 multi-type videos, and the obtained key-frame quality evaluation index, and the average of Fidelity and Ratio are 96.11925 and 97.128, respectively. Fortunately, the key-frames extracted by the proposed approach are consistent with artificial visual judgement. The performance of the proposed approach is compared with several state-of-the-art cluster-based algorithms, and the Fidelity are increased by 12.49721, 10.86455, 10.62984 and 10.4984375, respectively. In addition, the Ratio is increased by 1.958 on average with small fluctuations. The obtained experimental results demonstrate the advantage of the proposed solution over several related baselines on sixteen diverse datasets and validated that proposed approach can accurately extract video summarization from multi-type videos.

| [1] |
A. G. Money, H. Agius, Video summarization: A conceptual framework and survey of the state of the art, J. Visual Commun. Image Represent., 19 (2008), 121–143. doi: 10.1016/j.jvcir.2007.04.002

|
| [2] |
W. Li, D. Qi, C. Zhang, J. Guo, J. Yao, Video summarization based on mutual information and entropy sliding window method, Entropy, (2020), 22. doi: 10.3390/e22111285. doi: 10.3390/e22111285
|
| [3] |
X. Yan, S. Z. Gilani, M. Feng, L. Zhang, H. Qin, A. Mian, Self-supervised learning to detect key frames in videos, Sensors, (2020), 20. doi: 10.3390/s20236941. doi: 10.3390/s20236941
|
| [4] |
C. Huang, H. Wang, A novel key-frames selection framework for comprehensive video summarization, IEEE Trans. Circuits Syst. Video Technol., 30 (2020), 577–589. doi: 10.1109/TCSVT.2019.2890899
|
| [5] |
I. Mehmood, S. Rho, S. W. Baik, Divide-and-conquer based summarization framework for extracting affective video content, Neurocomputing, 174 (2016), 393–403. doi: 10.1016/j.neucom.2015.05.126
|
| [6] |
G. H. Song, Q. G. Ji, Z. M. Lu, Z. D. Fang, Z. H. Xie, A novel video abstraction method based on fast clustering of the regions of interest in key frames, AEU Int. J. Electron. Commun. 68 (2014), 783–794. doi: 10.1016/j.aeue.2014.03.004
|
| [7] |
H. Rachida, E. Abdessamad, A. Karim, MSKVS: Adaptive mean shift-based keyframe extraction for video summarization and a new objective verification approach, J. Visual Commun. Image Represent., 55 (2018), 179–200. doi: 10.1016/j.jvcir.2018.06.002
|
| [8] |
G. Ciocca, R. Schettini, Erratum to: An innovative algorithm for key frame extraction in video summarization, J. Real Time Image Process., 8 (2013), 225. doi: 10.1007/s11554-012-0278-1
|
| [9] |
H. S. Chang, S. Sull, S.U. Lee, Efficient video indexing scheme for content-based retrieval, IEEE Transact. Circ. Syst. Video Technol., 9 (1999), 1269–1279. doi: 10.1109/76.809161
|
| [10] |
S. K. Kuanar, R. Panda, A. S. Chowdhury, Video key frame extraction through dynamic Delaunay clustering with a structural constraint, J. Visual Commun. Image Represent., 24 (2013), 1212–1227. doi: 10.1016/j.jvcir.2013.08.003
|
| [11] |
W. Jiang, M. Fei, Z. Song, W. Mao, New fusional framework combining sparse selection and clustering for key frame extraction, Iet Computer Vision, 10 (2016), 280–288. doi: 10.1049/iet-cvi.2015.0237
|
| [12] | D. J. Jeong, H. J. Yoo, N. I. Cho, Consumer video summarization based on image quality and representativeness measure, 2015 IEEE Global Conference on Signal and Information Processing (GlobalSIP), (2015), pp. 572–576. |
| [13] |
Y. Yin, R. Thapliya, R. Zimmermann, Encoded semantic tree for automatic user profiling applied to personalized video summarization, IEEE Transact. Circ. Syst. Video Technol., 28 (2018), 181–192. doi: 10.1109/TCSVT.2016.2602832
|
| [14] |
N. Ejaz, I. Mehmood, S. W. Baik, Efficient visual attention-based framework for extracting key frames from videos, Signal Process. Image Commun., 28 (2013), 34–44. doi: 10.1016/j.image.2012.10.002
|
| [15] |
P. Zheng, L. Shuai, S. A. Kumar, M. Khan, Visual attention feature (VAF): A novel strategy for visual tracking based on cloud platform in intelligent surveillance systems, J. Parallel Distrib. Comput., 120 (2018), 182–194. doi: 10.1016/j.jpdc.2018.06.012
|
| [16] |
Y. Zhang, X. Liang, D. Zhang, M. Tan, E. P. Xing, Unsupervised object-level video summarization with online motion auto-encoder, Pattern Recognit. Lett., 130 (2020), 376–385. doi: 10.1016/j.patrec.2018.07.030
|
| [17] | Y. Z. Zhang, Key frame extraction of surveillance video based on frequency domain analysis, Intell. Autom. Soft Comput., 258 (2021), 259–272. |
| [18] | Y. Lu, Key frame extraction based on global motion statistics for team-sport videos, Mult. Syst., (2021), 1–15. |
| [19] | H. Liu, H. Hao, Key frame extraction based on improved hierarchical clustering algorithm, International Conference on Fuzzy Systems and Knowledge Discovery (FSKD), (2014). |
| [20] |
J. Wu, S. H. Zhong, J. Jiang, Y. Yang, A novel clustering method for static video summarization, Mult. Tools Appl., 76 (2017), 9625–9641. doi: 10.1007/s11042-016-3569-x
|
| [21] |
H. Tang, H. Liu, W. Xiao, Fast and robust dynamic hand gesture recognition via key frames extraction and feature fusion, Neurocomputing, 331 (2019), 424–433. doi: 10.1016/j.neucom.2018.11.038
|
| [22] |
H. Zhou, A. H. Sadka, M. R. Swash, J. Azizi, U. A. Sadiq, Feature extraction and clustering for dynamic video summarization, Neurocomputing, 73 (2010), 1718–1729. doi: 10.1016/j.neucom.2009.09.022
|
| [23] |
K. Xiao, S. Lingfeng, G. Wenzhong, C. Dewang, Multi-dimensional traffic congestion detection based on fusion of visual features and convolutional neural network, IEEE Transact. Intell. Transp. Syst., 20 (2019), 2157–2170. doi: 10.1109/TITS.2018.2864612
|
| [24] |
T. Koch, G. Vazquez-Vilar, A rigorous approach to high-resolution entropy-constrained vector quantization, IEEE Trans. Inf. Theory, 64 (2018), 2609–2625. doi: 10.1109/TIT.2018.2803064
|
| [25] |
D. Liu, G. Hua, T. Chen, A hierarchical visual model for video object summarization, IEEE Transact. Pattern Anal. Mach. Intell., 32 (2010), 2178–2190. doi: 10.1109/TPAMI.2010.31
|
| [26] | C. Fahy, S. Yang, M. Gongora, Ant colony stream clustering: A fast density clustering algorithm for dynamic data streams, IEEE Transact. Cybernet., 49 (2018), 2215–2228. |
| [27] |
J. Niu, D. Huo, K. Wang, C. Tong, Real-time generation of personalized home video summaries on mobile devices, Neurocomputing, 120 (2013), 404–414. doi: 10.1016/j.neucom.2012.06.056
|
| [28] |
C. Yang, L. Chuang, Y. Lin, Epistasis analysis using an improved Fuzzy C-means-based entropy approach, IEEE Trans. Fuzzy Syst., 28 (2020), 718–730. doi: 10.1109/TFUZZ.2019.2914629
|


Figures(6) / Tables(3)

Yunyun Sun, Peng Li, Zhaohui Jiang, Sujun Hu. Feature fusion and clustering for key frame extraction[J]. Mathematical Biosciences and Engineering, 2021, 18(6): 9294-9311. doi: 10.3934/mbe.2021457


 DownLoad: