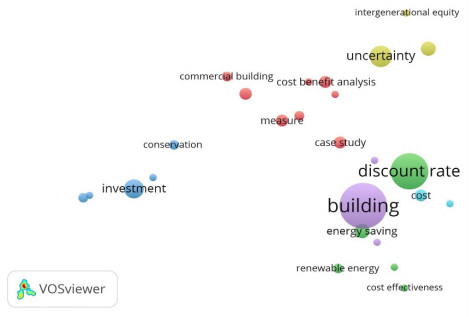
How does the issue of the discount rate intersect the research on building energy efficiency and the topics into which it has branched? This contribution tries to answer the previous question through a comprehensive review of related studies. Those studies usually rely on two alternative assumptions. The first refers, explicitly or implicitly, to the notion of cost of capital and, hence, to the position of private stakeholders involved in the decision processes focusing on the adoption of energy-efficient measures in buildings. The second assumption relates to the notion of the social discount rate, which is meant to pursue intergenerational equity and environmental sustainability. As far as the results are concerned, the literature agrees that the discount rate is among the key parameters—possibly the most prominent—affecting the evaluation. However, despite the crucial role it plays, its calculation seldom relies on acknowledged methods and models. Furthermore, data sources sometimes lack consistency and accuracy. Some guidance and suggestions are provided as to the improvement of the discount rate estimation.
Citation: Sergio Copiello. Economic viability of building energy efficiency measures: a review on the discount rate[J]. AIMS Energy, 2021, 9(2): 257-285. doi: 10.3934/energy.2021014
How does the issue of the discount rate intersect the research on building energy efficiency and the topics into which it has branched? This contribution tries to answer the previous question through a comprehensive review of related studies. Those studies usually rely on two alternative assumptions. The first refers, explicitly or implicitly, to the notion of cost of capital and, hence, to the position of private stakeholders involved in the decision processes focusing on the adoption of energy-efficient measures in buildings. The second assumption relates to the notion of the social discount rate, which is meant to pursue intergenerational equity and environmental sustainability. As far as the results are concerned, the literature agrees that the discount rate is among the key parameters—possibly the most prominent—affecting the evaluation. However, despite the crucial role it plays, its calculation seldom relies on acknowledged methods and models. Furthermore, data sources sometimes lack consistency and accuracy. Some guidance and suggestions are provided as to the improvement of the discount rate estimation.

| [1] |
Copiello S (2017) Building energy efficiency: A research branch made of paradoxes. Renew Sustain Energy Rev 69: 1064-1076. doi: 10.1016/j.rser.2016.09.094

|
| [2] |
Rajagopalan P, Dimoudi A (2018) Editorial note for low energy social housing. Energy Build 180: 29-31. doi: 10.1016/j.enbuild.2018.09.027
|
| [3] |
Soebarto V, de Dear R, Zuo J, et al. (2018) Editorial note for Virtual Special Issue on energy performance to indoor environmental quality. Energy Build 166: 317-318. doi: 10.1016/j.enbuild.2018.02.022
|
| [4] |
Galvin R, Sunikka-Blank M (2014) Disaggregating the causes of falling consumption of domestic heating energy in Germany. Energy Effic 7: 851-864. doi: 10.1007/s12053-014-9259-5
|
| [5] |
Huebner GM, Hamilton I, Chalabi Z, et al. (2015) Explaining domestic energy consumption— The comparative contribution of building factors, socio-demographics, behaviours and attitudes. Appl Energy 159: 589-600. doi: 10.1016/j.apenergy.2015.09.028
|
| [6] |
Belaïd F (2016) Understanding the spectrum of domestic energy consumption: Empirical evidence from France. Energy Policy 92: 220-233. doi: 10.1016/j.enpol.2016.02.015
|
| [7] |
Copiello S, Gabrielli L (2017) Analysis of building energy consumption through panel data: The role played by the economic drivers. Energy Build 145: 130-143. doi: 10.1016/j.enbuild.2017.03.053
|
| [8] |
Copiello S, Grillenzoni C (2017) Is the cold the only reason why we heat our homes? Empirical evidence from spatial series data. Appl Energy 193: 491-506. doi: 10.1016/j.apenergy.2017.02.013
|
| [9] |
Gann DM, Wang Y, Hawkins R (1998) Do regulations encourage innovation?—the case of energy efficiency in housing. Build Res Inf 26: 280-296. doi: 10.1080/096132198369760
|
| [10] |
Sandén BA, Azar C (2005) Near-term technology policies for long-term climate targets—economy wide versus technology specific approaches. Energy Policy 33: 1557-1576. doi: 10.1016/j.enpol.2004.01.012
|
| [11] |
Noailly J (2012) Improving the energy efficiency of buildings: The impact of environmental policy on technological innovation. Energy Econ 34: 795-806. doi: 10.1016/j.eneco.2011.07.015
|
| [12] |
Dalla Mora T, Peron F, Romagnoni P, et al. (2018) Tools and procedures to support decision making for cost-effective energy and carbon emissions optimization in building renovation. Energy Build 167: 200-215. doi: 10.1016/j.enbuild.2018.02.030
|
| [13] |
Penna P, Prada A, Cappelletti F, et al. (2015) Multi-objectives optimization of Energy Efficiency Measures in existing buildings. Energy Build 95: 57-69. doi: 10.1016/j.enbuild.2014.11.003
|
| [14] |
Omer AM (2008) Energy, environment and sustainable development. Renew Sustain Energy Rev 12: 2265-2300. doi: 10.1016/j.rser.2007.05.001
|
| [15] |
Marszal AJ, Heiselberg P, Bourrelle JS, et al. (2011) Zero Energy Building—A review of definitions and calculation methodologies. Energy Build 43: 971-979. doi: 10.1016/j.enbuild.2010.12.022
|
| [16] |
Palm J (2018) Household installation of solar panels—Motives and barriers in a 10-year perspective. Energy Policy 113: 1-8. doi: 10.1016/j.enpol.2017.10.047
|
| [17] |
Sartori I, Hestnes AG (2007) Energy use in the life cycle of conventional and low-energy buildings: A review article. Energy Build 39: 249-257. doi: 10.1016/j.enbuild.2006.07.001
|
| [18] |
Dixit MK, Fernández-Solís JL, Lavy S, et al. (2010) Identification of parameters for embodied energy measurement: A literature review. Energy Build 42: 1238-1247. doi: 10.1016/j.enbuild.2010.02.016
|
| [19] |
Dixit MK, Fernández-Solís JL, Lavy S, et al. (2012) Need for an embodied energy measurement protocol for buildings: A review paper. Renew Sustain Energy Rev 16: 3730-3743. doi: 10.1016/j.rser.2012.03.021
|
| [20] |
Copiello S (2016) Economic implications of the energy issue: Evidence for a positive non-linear relation between embodied energy and construction cost. Energy Build 123: 59-70. doi: 10.1016/j.enbuild.2016.04.054
|
| [21] |
Copiello S (2019) Economic parameters in the evaluation studies focusing on building energy efficiency: a review of the underlying rationale, data sources, and assumptions. Energy Procedia 157: 180-192. doi: 10.1016/j.egypro.2018.11.179
|
| [22] |
Amstalden RW, Kost M, Nathani C, et al. (2007) Economic potential of energy-efficient retrofitting in the Swiss residential building sector: The effects of policy instruments and energy price expectations. Energy Policy 35: 1819-1829. doi: 10.1016/j.enpol.2006.05.018
|
| [23] |
Kumbaroğlu G, Madlener R (2012) Evaluation of economically optimal retrofit investment options for energy savings in buildings. Energy Build 49: 327-334. doi: 10.1016/j.enbuild.2012.02.022
|
| [24] |
Zalejska-Jonsson A, Lind H, Hintze S (2012) Low-energy versus conventional residential buildings: cost and profit. J Eur Real Estate Res 5: 211-228. doi: 10.1108/17539261211282064
|
| [25] |
Brotman BA (2014) Green office construction: A discounted after-tax cash flow analysis. J Prop Invest Financ 32: 474-484. doi: 10.1108/JPIF-01-2014-0007
|
| [26] |
Becchio C, Bottero MC, Corgnati SP, et al. (2018) Decision making for sustainable urban energy planning: an integrated evaluation framework of alternative solutions for a NZED (Net Zero-Energy District) in Turin. Land Use Policy 78: 803-817. doi: 10.1016/j.landusepol.2018.06.048
|
| [27] |
Marshall HE, Ruegg RT (1977) Energy Conservation through Life-Cycle Costing. J Archit Educ 30: 42-53. doi: 10.1080/10464883.1977.10758110
|
| [28] |
Bagatin M, Caldon R, Gottardi G (1984) Economic optimization and sensitivity analysis of energy requirements in residential space heating. Int J Energy Res 8: 127-138. doi: 10.1002/er.4440080204
|
| [29] | Gustafsson S-I (1993) Life cycle costing related to the refurbishment of buildings, In: Bull JW (Ed.), Life Cycle Costing for Construction, London, Chapman & Hall, 37-52. |
| [30] |
Gustafsson SI (2000) Optimization of insulation measures on existing buildings. Energy Build 33: 49-55. doi: 10.1016/S0378-7788(00)00062-1
|
| [31] | Verbeeck G, Hens H (2005) Energy savings in retrofitted dwellings: economically viable? Energy Build 37: 747-754. |
| [32] |
Ouyang J, Lu M, Li B, et al. (2011) Economic analysis of upgrading aging residential buildings in China based on dynamic energy consumption and energy price in a market economy. Energy Policy 39: 4902-4910. doi: 10.1016/j.enpol.2011.06.025
|
| [33] |
Copiello S, Gabrielli L, Bonifaci P (2017) Evaluation of energy retrofit in buildings under conditions of uncertainty: The prominence of the discount rate. Energy 137: 104-117. doi: 10.1016/j.energy.2017.06.159
|
| [34] |
Di Giuseppe E, Massi A, D'Orazio M (2017) Probabilistic Life Cycle Cost Analysis of building energy efficiency measures: Selection and characterization of the stochastic inputs through a case study. Procedia Eng 180: 491-501. doi: 10.1016/j.proeng.2017.04.208
|
| [35] | European Commission (2012) Guidelines accompanying Commission Delegated Regulation (EU) No 244/2012 of 16 January 2012 supplementing Directive 2010/31/EU of the European Parliament and of the Council on the energy performance of buildings by establishing a comparative methodology f. Off J Eur Union 55: 1-28. |
| [36] |
Kurnitski J, Kuusk K, Tark T, et al. (2014) Energy and investment intensity of integrated renovation and 2030 cost optimal savings. Energy Build 75: 51-59. doi: 10.1016/j.enbuild.2014.01.044
|
| [37] |
Mora TD, Righi A, Peron F, et al. (2017) Cost-Optimal measures for renovation of existing school buildings towards nZEB. Energy Procedia 140: 288-302. doi: 10.1016/j.egypro.2017.11.143
|
| [38] | Damodaran A (2006) Valuation Approaches and Metrics: A Survey of the Theory and Evidence, New York. |
| [39] |
Copiello S (2016) A Discounted Cash Flow variant to detect the optimal amount of additional burdens in Public-Private Partnership transactions. MethodsX 3: 195-204. doi: 10.1016/j.mex.2016.03.003
|
| [40] | Böhm-Bawerk E von (1903) Recent Literature on Interest, London, The MacMillan co. |
| [41] | Fisher I (1907) The Rate of Interest, New York, The MacMillan Co. |
| [42] | Fisher I (1930) The Theory of Interest, New York, The MacMillan Co. |
| [43] | Marshall A (1920) Principles of Economics, London, The MacMillan co. |
| [44] |
Frederick S, Loewenstein G, O'donoghue T (2002) Time discounting and time preference: A critical review. J Econ Lit 40: 351-401. doi: 10.1257/jel.40.2.351
|
| [45] |
Komendantova N, Patt A, Williges K (2011) Solar power investment in North Africa: Reducing perceived risks. Renew Sustain Energy Rev 15: 4829-4835. doi: 10.1016/j.rser.2011.07.068
|
| [46] |
Liu N, Zhao Y, Ge J (2018) Do renters skimp on energy efficiency during economic recessions? Evidence from Northeast Scotland. Energy 165: 164-175. doi: 10.1016/j.energy.2018.09.078
|
| [47] |
Trotta G (2018) The determinants of energy efficient retrofit investments in the English residential sector. Energy Policy 120: 175-182. doi: 10.1016/j.enpol.2018.05.024
|
| [48] |
Phua FTT (2018) The role of organizational climate in socially embedding construction firms' sustainability goals. Constr Manag Econ 36: 409-421. doi: 10.1080/01446193.2018.1424348
|
| [49] |
Gaspar K, Casals M, Gangolells M (2018) In situ measurement of façades with a low U-value: Avoiding deviations. Energy Build 170: 61-73. doi: 10.1016/j.enbuild.2018.04.012
|
| [50] |
Kangas H-L, Lazarevic D, Kivimaa P (2018) Technical skills, disinterest and non-functional regulation: Barriers to building energy efficiency in Finland viewed by energy service companies. Energy Policy 114: 63-76. doi: 10.1016/j.enpol.2017.11.060
|
| [51] |
Wells L, Rismanchi B, Aye L (2018) A review of Net Zero Energy Buildings with reflections on the Australian context. Energy Build 158: 616-628. doi: 10.1016/j.enbuild.2017.10.055
|
| [52] |
Palmer K, Walls M (2017) Using information to close the energy efficiency gap: A review of benchmarking and disclosure ordinances. Energy Effic 10: 673-691. doi: 10.1007/s12053-016-9480-5
|
| [53] |
Davis P, McCord MJ, McCluskey W, et al. (2017) Is energy performance too taxing?: A CAMA approach to modelling residential energy in housing in Northern Ireland. J Eur Real Estate Res 10: 124-148. doi: 10.1108/JERER-06-2016-0023
|
| [54] |
Liu J, Sun X, Lu B, et al. (2016) The life cycle rebound effect of air-conditioner consumption in China. Appl Energy 184: 1026-1032. doi: 10.1016/j.apenergy.2015.11.100
|
| [55] |
Claudy M, Michelsen C (2016) Housing market fundamentals, housing quality and energy consumption: Evidence from Germany. Energy J 37: 25-43. doi: 10.5547/01956574.37.4.mcla
|
| [56] |
Wang Q, Ploskić A, Song X, et al. (2016) Ventilation heat recovery jointed low-temperature heating in retrofitting—An investigation of energy conservation, environmental impacts and indoor air quality in Swedish multifamily houses. Energy Build 121: 250-264. doi: 10.1016/j.enbuild.2016.02.050
|
| [57] |
Ürge-Vorsatz D, Kelemen A, Tirado-Herrero S, et al. (2016) Measuring multiple impacts of low-carbon energy options in a green economy context. Appl Energy 179: 1409-1426. doi: 10.1016/j.apenergy.2016.07.027
|
| [58] |
Langlois-Bertrand S, Benhaddadi M, Jegen M, et al. (2015) Political-institutional barriers to energy efficiency. Energy Strateg Rev 8: 30-38. doi: 10.1016/j.esr.2015.08.001
|
| [59] |
Bouhou N-EI, Blackhurst MF, Torres P (2015) An empirical analysis of joint residential electricity efficiency gains within and across end uses: implications for demand-side management. Ecol Econ 110: 61-70. doi: 10.1016/j.ecolecon.2014.12.011
|
| [60] |
Abolarin SM, Shitta MB, Gbadegesin O, et al. (2015) An Economic Evaluation of Energy Management Opportunities in a Medium Scale Manufacturing Industry in Lagos. Int J Eng Res Africa 14: 97-106. doi: 10.4028/www.scientific.net/JERA.14.97
|
| [61] |
Jeuland M, Pattanayak SK, Bluffstone R (2015) The economics of household air pollution. Annu Rev Resour Econ 7: 81-108. doi: 10.1146/annurev-resource-100814-125048
|
| [62] |
Hsu D (2014) Improving energy benchmarking with self-reported data. Build Res Inf 42: 641-656. doi: 10.1080/09613218.2014.887612
|
| [63] |
Matisoff DC, Noonan DS, Mazzolini AM (2014) Performance or marketing benefits? The case of LEED certification. Environ Sci Technol 48: 2001-2007. doi: 10.1021/es4042447
|
| [64] |
Franceschini F, Maisano D, Mastrogiacomo L (2016) The museum of errors/horrors in Scopus. J Informetr 10: 174-182. doi: 10.1016/j.joi.2015.11.006
|
| [65] |
Meester WJN, Colledge L, Dyas EE (2016) A response to 'The museum of errors/horrors in Scopus' by Franceschini et al. J Informetr 10: 569-570. doi: 10.1016/j.joi.2016.04.011
|
| [66] |
Franceschini F, Maisano D, Mastrogiacomo L (2016) Empirical analysis and classification of database errors in Scopus and Web of Science. J Informetr 10: 933-953. doi: 10.1016/j.joi.2016.07.003
|
| [67] | van Eck NJ, Waltman L (2007) VOS: A New Method for Visualizing Similarities Between Objects, In: Lenz H-J, Decker R (Eds.), Advances in Data Analysis: Proceedings of the 30th Annual Conference of the German Classification Society, Berlin, Heidelberg, Springer, 299-306. |
| [68] |
van Eck NJ, Waltman L (2010) Software survey: VOSviewer, a computer program for bibliometric mapping. Scientometrics 84: 523-538. doi: 10.1007/s11192-009-0146-3
|
| [69] |
Waltman L, van Eck NJ, Noyons ECM (2010) A unified approach to mapping and clustering of bibliometric networks. J Informetr 4: 629-635. doi: 10.1016/j.joi.2010.07.002
|
| [70] |
Waltman L, van Eck NJ (2013) A smart local moving algorithm for large-scale modularity-based community detection. Eur Phys J B 86: 471. doi: 10.1140/epjb/e2013-40829-0
|
| [71] | van Eck NJ, Waltman L (2014) Visualizing Bibliometric Networks, In: Ding Y, Rousseau R, Wolfram D (Eds.), Measuring Scholarly Impact, Cham, Springer International Publishing, 285-320. |
| [72] |
Moon Y, Baran M (2018) Economic analysis of a residential PV system from the timing perspective: A real option model. Renew Energy 125: 783-795. doi: 10.1016/j.renene.2018.02.138
|
| [73] |
Burhenne S, Tsvetkova O, Jacob D, et al. (2013) Uncertainty quantification for combined building performance and cost-benefit analyses. Build Environ 62: 143-154. doi: 10.1016/j.buildenv.2013.01.013
|
| [74] |
Tadeu S, Tadeu A, Simões N, et al. (2018) A sensitivity analysis of a cost optimality study on the energy retrofit of a single-family reference building in Portugal. Energy Effic 11: 1411-1432. doi: 10.1007/s12053-018-9645-5
|
| [75] |
Copiello S (2018) Expansion of the Italian natural gas network to the Sardinia Island : Economic assessment. J Nat Gas Sci Eng 54: 297-308. doi: 10.1016/j.jngse.2018.04.010
|
| [76] |
Brown NWO, Malmqvist T, Bai W, et al. (2013) Sustainability assessment of renovation packages for increased energy efficiency for multi-family buildings in Sweden. Build Environ 61: 140-148. doi: 10.1016/j.buildenv.2012.11.019
|
| [77] |
Fabbri R, Gabrielli L, Ruggeri AG (2018) Interactions between restoration and financial analysis: the case of Cuneo War Wounded House. J Cult Herit Manag Sustain Dev 8: 145-161. doi: 10.1108/JCHMSD-05-2017-0026
|
| [78] |
Newell RG, Jaffe AB, Stavins RN (1999) The induced innovation hypothesis and Energy-Saving technological change. Q J Econ 114: 941-975. doi: 10.1162/003355399556188
|
| [79] | Walls M, Gerarden T, Palmer K, et al. (2017) Is energy efficiency capitalized into home prices? Evidence from three U.S. cities. J Environ Econ Manage 82: 104-124. |
| [80] |
Wang J, Zhang Y, Wang Y (2018) Environmental impacts of short building lifespans in China considering time value. J Clean Prod 203: 696-707. doi: 10.1016/j.jclepro.2018.08.314
|
| [81] |
Dodoo A, Gustavsson L, Le Truong N (2018) Primary energy benefits of cost-effective energy renovation of a district heated multi-family building under different energy supply systems. Energy 143: 69-90. doi: 10.1016/j.energy.2017.10.113
|
| [82] |
Dodoo A, Gustavsson L, Tettey UYA (2017) Final energy savings and cost-effectiveness of deep energy renovation of a multi-storey residential building. Energy 135: 563-576. doi: 10.1016/j.energy.2017.06.123
|
| [83] |
Faludi J, Lepech M (2012) Ecological payback time of an energy-efficient modular building. J Green Build 7: 100-119. doi: 10.3992/jgb.7.1.100
|
| [84] | Reddy BS, Assenza GB, Assenza D, et al. (2009) Energy efficiency and climate change: Conserving power for a sustainable future energy efficiency and climate change: Conserving power for a sustainable future, New Delhi, SAGE Publications India. |
| [85] | Revesz RL, Stavins RN (2007) Chapter 8 Environmental Law, Handbook of Law and Economics, 499-589. |
| [86] | Metz B, Davidson O, Bosch P, et al. (Eds.) (2007) Climate Change 2007: Mitigation of Climate Change, Cambridge, Cambridge University Press. |
| [87] | Dasgupta P, Mäler K-G, Barrett S (1999) Intergenerational Equity, Social Discount Rates and Global Warming, In: Portney P, Weyant JP (Eds.), Discounting and intergenerational equity, Washington, DC, Resources for the Future, 51-79. |
| [88] |
Weitzman ML (1998) Why the Far-Distant Future Should Be Discounted at Its Lowest Possible Rate. J Environ Econ Manage 36: 201-208. doi: 10.1006/jeem.1998.1052
|
| [89] |
Weitzman ML (2001) Gamma Discounting. Am Econ Rev 91: 260-271. doi: 10.1257/aer.91.1.260
|
| [90] |
Hepburn C, Koundouri P, Panopoulou E, et al. (2009) Social discounting under uncertainty: A cross-country comparison. J Environ Econ Manage 57: 140-150. doi: 10.1016/j.jeem.2008.04.004
|
| [91] |
Goulder LH, Williams RC (2012) The choice of discount rate for climate change policy evaluation. Clim Chang Econ 03: 1250024. doi: 10.1142/S2010007812500248
|
| [92] |
Markandya A, Pearce DW (1991) Development, the environment, and the social rate of discount. World Bank Res Obs 6: 137-152. doi: 10.1093/wbro/6.2.137
|
| [93] |
Weitzman ML (1994) On the 'Environmental' Discount Rate. J Environ Econ Manage 26: 200-209. doi: 10.1006/jeem.1994.1012
|
| [94] | Lind RC (1997) Intertemporal Equity, Discounting, and Economic Efficiency in Water Policy Evaluation, Climate Change and Water Resources Planning Criteria, Dordrecht, Springer Netherlands, 41-62. |
| [95] |
Hellweg S, Hofstetter TB, Hungerbühler K (2003) Discounting and the environment. Int J Life Cycle Assess 8: 8-18. doi: 10.1007/BF02978744
|
| [96] |
Howarth RB (2003) Discounting and uncertainty in climate change policy analysis. Land Econ 79: 369-381. doi: 10.2307/3147023
|
| [97] |
Dasgupta P (2008) Discounting climate change. J Risk Uncertain 37: 141-169. doi: 10.1007/s11166-008-9049-6
|
| [98] | Newell RG, Pizer WA (2003) Discounting the distant future: how much do uncertain rates increase valuations? J Environ Econ Manage 46: 52-71. |
| [99] |
Newell RG, Pizer WA (2004) Uncertain discount rates in climate policy analysis. Energy Policy 32: 519-529. doi: 10.1016/S0301-4215(03)00153-8
|
| [100] |
Gollier C (2010) Ecological discounting. J Econ Theory 145: 812-829. doi: 10.1016/j.jet.2009.10.001
|
| [101] |
Gollier C (2002) Time Horizon and the Discount Rate. J Econ Theory 107: 463-473. doi: 10.1006/jeth.2001.2952
|
| [102] |
Atkinson G, Mourato S (2008) Environmental Cost-Benefit analysis. Annu Rev Environ Resour 33: 317-344. doi: 10.1146/annurev.environ.33.020107.112927
|
| [103] |
Horowitz JK (1996) Environmental policy under a non-market discount rate. Ecol Econ 16: 73-78. doi: 10.1016/0921-8009(95)00082-8
|
| [104] |
Philibert C (1999) The economics of climate change and the theory of discounting. Energy Policy 27: 913-927. doi: 10.1016/S0301-4215(99)00081-6
|
| [105] |
Winkler R (2006) Does 'better' discounting lead to 'worse' outcomes in long-run decisions? The dilemma of hyperbolic discounting. Ecol Econ 57: 573-582. doi: 10.1016/j.ecolecon.2005.05.013
|
| [106] | Freeman MC, Groom B (2016) How certain are we about the certainty-equivalent long term social discount rate? J Environ Econ Manage 79: 152-168. |
| [107] | Homer S, Sylla R (2005) A History of Interest Rates, Hoboken, John Wiley & Sons. |
| [108] |
D'Adamo I, Gastaldi M, Morone P (2020) The post COVID-19 green recovery in practice: Assessing the profitability of a policy proposal on residential photovoltaic plants. Energy Policy 147: 111910. doi: 10.1016/j.enpol.2020.111910
|
| [109] |
Croese S, Green C, Morgan G (2020) Localizing the sustainable development goals through the lens of urban resilience: Lessons and learnings from 100 resilient cities and cape town. Sustainability 12: 550. doi: 10.3390/su12020550
|
| [110] |
Elmqvist T, Andersson E, Frantzeskaki N, et al. (2019) Sustainability and resilience for transformation in the urban century. Nat Sustain 2: 267-273. doi: 10.1038/s41893-019-0250-1
|
| [111] | Australian Department of Finance and Administration (2006) Handbook of cost-benefit analysis, Canberra, Commonwealth of Australia. |
| [112] |
Fama EF, French KR (2004) The Capital Asset Pricing Model: Theory and evidence. J Econ Perspect 18: 25-46. doi: 10.1257/0895330042162430
|
| [113] | Sharpe WF (1964) Capital asset prices: A theory of market equilibrium under conditions of risk. J Finance 19: 425-442. |
| [114] |
Blume ME, Friend I (1973) A new look at the capital asset pricing model. J Finance 28: 19-34. doi: 10.1111/j.1540-6261.1973.tb01342.x
|
| [115] | French CW (2003) The Treynor capital asset pricing model. J Invest Manag 1: 60-72. |
| [116] | Perold AF (2004) The Capital Asset Pricing Model. J Econ Perspect 18: 3-24. |
| [117] |
Awerbuch S, Deehan W (1995) Do consumers discount the future correctly? A market-based valuation of residential fuel switching. Energy Policy 23: 57-69. doi: 10.1016/0301-4215(95)90766-Z
|
| [118] |
Albrecht J (2007) The future role of photovoltaics: A learning curve versus portfolio perspective. Energy Policy 35: 2296-2304. doi: 10.1016/j.enpol.2006.07.013
|
| [119] |
Menassa CC (2011) Evaluating sustainable retrofits in existing buildings under uncertainty. Energy Build 43: 3576-3583. doi: 10.1016/j.enbuild.2011.09.030
|
| [120] | Lilford EV (2006) The corporate cost of capital. J South African Inst Min Metall 106: 139-146. |
| [121] | Lilford EV, Minnitt RCA (2002) Methodologies in the valuation of mineral rights. J South African Inst Min Metall 102: 369-384. |
| [122] |
Lilford E, Maybee B, Packey D (2018) Cost of capital and discount rates in cash flow valuations for resources projects. Resour Policy 59: 525-531. doi: 10.1016/j.resourpol.2018.09.008
|
| [123] |
Torriti J (2012) Multiple-project discount rates for cost-benefit analysis in construction projects: A formal risk model for microgeneration renewable energy technologies. Constr Manag Econ 30: 739-747. doi: 10.1080/01446193.2012.692165
|
| [124] | D'Alpaos C, Bragolusi P (2018) Buildings energy retrofit valuation approaches: State of the art and future perspectives. Valori e Valutazioni 20: 79-94. |
| [125] | Jacoboni C, Lugli P (1989) The Monte Carlo Method for Semiconductor Device Simulation, Vienna, Springer Vienna. |
| [126] |
James F (1980) Monte Carlo theory and practice. Reports Prog Phys 43: 1145-1189. doi: 10.1088/0034-4885/43/9/002
|
| [127] |
Nikolaidis Y, Pilavachi PA, Chletsis A (2009) Economic evaluation of energy saving measures in a common type of Greek building. Appl Energy 86: 2550-2559. doi: 10.1016/j.apenergy.2009.04.029
|
| [128] |
Das P, Van Gelder L, Janssen H, et al. (2017) Designing uncertain optimization schemes for the economic assessment of stock energy-efficiency measures. J Build Perform Simul 10: 3-16. doi: 10.1080/19401493.2015.1099054
|
| [129] |
Mahdiyar A, Tabatabaee S, Sadeghifam AN, et al. (2016) Probabilistic private cost-benefit analysis for green roof installation: A Monte Carlo simulation approach. Urban Urban Green 20: 317-327. doi: 10.1016/j.ufug.2016.10.001
|
| [130] |
Cox M, Brown MA, Sun X (2013) Energy benchmarking of commercial buildings: a low-cost pathway toward urban sustainability. Environ Res Lett 8: 035018. doi: 10.1088/1748-9326/8/3/035018
|
| [131] |
Tian W, Heo Y, de Wilde P, et al. (2018) A review of uncertainty analysis in building energy assessment. Renew Sustain Energy Rev 93: 285-301. doi: 10.1016/j.rser.2018.05.029
|
| [132] | European Commission (2012) Commission Delegated Regulation (EU) No 244/2012 of 16 January 2012. Off J Eur Union L: 18-36. |
| [133] |
Fennell P, Ruyssevelt P, Smith AZP (2016) Financial viability of school retrofit projects for clients and ESCOs. Build Res Inf 44: 889-906. doi: 10.1080/09613218.2015.1082779
|
| [134] |
Ondraczek J, Komendantova N, Patt A (2015) WACC the dog: The effect of financing costs on the levelized cost of solar PV power. Renew Energy 75: 888-898. doi: 10.1016/j.renene.2014.10.053
|
| [135] | Rushing AS, Kneifel JD, Lippiatt BL (2013) Energy price indices and discount factors for life-cycle cost analysis—2013 : annual supplement to NIST Handbook 135 and NBS Special Publication 709, Gaithersburg, MD. |
| [136] | Lavappa PD, Kneifel JD (2016) Energy Price Indices and Discount Factors for Life-Cycle Cost Analysis—2016 Annual Supplement to NIST Handbook 135, National Institute of Standards and Technology, U.S. Department of Commerce, Gaithersburg, MD. |
| [137] |
Paganin G, Angelotti A, Ducoli C, et al. (2017) Energy performance of an exhibition hall in a life cycle perspective: Embodied energy, operational energy and retrofit strategies. Energy Effic 10: 1343-1364. doi: 10.1007/s12053-017-9521-8
|
| [138] | Fujita KS (2016) Commercial Discount Rate Estimation for Efficiency Standards Analysis, Lawrence Berkeley National Laboratory, Berkeley, CA. |
| [139] | Office of Management and Budget (1992) Guidelines and Discount Rates for Benefit-Cost Analysis of Federal Programs, Washington, DC, US Office of Management and Budget. |
| [140] | Australian Government (2007) Best practice regulation handbook, Canberra, Office of Best Practice Regulation. |
| [141] | Steinbach J, Staniaszek D (2015) Discount rates in energy system analysis, Discussion paper commissioned by the Buildings Performance Institute Europe, Brussels. |
| [142] |
Zhang Y, Si P, Feng Y, et al. (2017) Operation strategy optimization of BCHP system with thermal energy storage: A case study for airport terminal in Qingdao, China. Energy Build 154: 465-478. doi: 10.1016/j.enbuild.2017.08.059
|
| [143] |
Yan X, Zhang X, Chen H, et al. (2014) Techno-economic and social analysis of energy storage for commercial buildings. Energy Convers Manag 78: 125-136. doi: 10.1016/j.enconman.2013.10.014
|
| [144] |
Qian D, Guo J (2014) Research on the energy-saving and revenue sharing strategy of ESCOs under the uncertainty of the value of Energy Performance Contracting Projects. Energy Policy 73: 710-721. doi: 10.1016/j.enpol.2014.05.013
|
| [145] |
Zhou S, Zhao J (2013) Optimum combinations of building envelop energy-saving technologies for office buildings in different climatic regions of China. Energy Build 57: 103-109. doi: 10.1016/j.enbuild.2012.11.019
|
| [146] |
Liu CT, Hsieh BZ (2016) Assessment model for estimating CO2 commercial storage capacity in saline formations: A case study in Taiwan. Int J Greenh Gas Control 49: 14-23. doi: 10.1016/j.ijggc.2016.02.016
|
| [147] |
Moore T, Morrissey J (2014) Lifecycle costing sensitivities for zero energy housing in Melbourne, Australia. Energy Build 79: 1-11. doi: 10.1016/j.enbuild.2014.04.050
|
| [148] |
Islam H, Jollands M, Setunge S (2015) Life cycle assessment and life cycle cost implication of residential buildings—A review. Renew Sustain Energy Rev 42: 129-140. doi: 10.1016/j.rser.2014.10.006
|
| [149] |
Morrissey J, Meyrick B, Sivaraman D, et al. (2013) Cost-benefit assessment of energy efficiency investments: Accounting for future resources, savings and risks in the Australian residential sector. Energy Policy 54: 148-159. doi: 10.1016/j.enpol.2012.11.005
|
| [150] |
Bonakdar F, Dodoo A, Gustavsson L (2014) Cost-optimum analysis of building fabric renovation in a Swedish multi-story residential building. Energy Build 84: 662-673. doi: 10.1016/j.enbuild.2014.09.003
|
| [151] | Copiello S, Bonifaci P (2015) Green housing: Toward a new energy efficiency paradox? Cities 49: 76-87. |
| [152] |
Wu L, Mao XQ, Zeng A (2015) Carbon footprint accounting in support of city water supply infrastructure siting decision making: A case study in Ningbo, China. J Clean Prod 103: 737-746. doi: 10.1016/j.jclepro.2015.01.060
|
| [153] |
Mata É, Sasic Kalagasidis A, Johnsson F (2015) Cost-effective retrofitting of Swedish residential buildings: Effects of energy price developments and discount rates. Energy Effic 8: 223-237. doi: 10.1007/s12053-014-9287-1
|
| [154] |
Brandão de Vasconcelos A, Cabaço A, Pinheiro MD, et al. (2016) The impact of building orientation and discount rates on a Portuguese reference building refurbishment decision. Energy Policy 91: 329-340. doi: 10.1016/j.enpol.2016.01.021
|
| [155] |
Liu X, Cui Q (2016) Assessing the impacts of preferential procurement on low-carbon building. J Clean Prod 112: 863-871. doi: 10.1016/j.jclepro.2015.06.015
|
| [156] |
Guo F, Akenji L, Schroeder P, et al. (2018) Static analysis of technical and economic energy-saving potential in the residential sector of Xiamen city. Energy 142: 373-383. doi: 10.1016/j.energy.2017.10.042
|
| [157] |
Ó Broin E, Mata É, Nässén J, et al. (2015) Quantification of the energy efficiency gap in the Swedish residential sector. Energy Effic 8: 975-993. doi: 10.1007/s12053-015-9323-9
|
| [158] |
Copiello S (2015) Achieving affordable housing through energy efficiency strategy. Energy Policy 85: 288-298. doi: 10.1016/j.enpol.2015.06.017
|
| [159] |
Copiello S (2016) Leveraging energy efficiency to finance public-private social housing projects. Energy Policy 96: 217-230. doi: 10.1016/j.enpol.2016.06.003
|
| [160] |
Schmidt TS, Born R, Schneider M (2012) Assessing the costs of photovoltaic and wind power in six developing countries. Nat Clim Chang 2: 548-553. doi: 10.1038/nclimate1490
|
| [161] |
Peters M, Schmidt TS, Wiederkehr D, et al. (2011) Shedding light on solar technologies—A techno-economic assessment and its policy implications. Energy Policy 39: 6422-6439. doi: 10.1016/j.enpol.2011.07.045
|
| [162] | Di Vita G (2008) Is the discount rate relevant in explaining the Environmental Kuznets Curve? J Policy Model 30: 191-207. |
| [163] |
Mundaca L, Neij L, Worrell E, et al. (2010) Evaluating Energy Efficiency Policies with Energy-Economy Models. Annu Rev Environ Resour 35: 305-344. doi: 10.1146/annurev-environ-052810-164840
|
| [164] |
Mundaca L (2008) Markets for energy efficiency: Exploring the implications of an EU-wide 'Tradable White Certificate' scheme. Energy Econ 30: 3016-3043. doi: 10.1016/j.eneco.2008.03.004
|
| [165] |
Sovacool BK (2009) Rejecting renewables: The socio-technical impediments to renewable electricity in the United States. Energy Policy 37: 4500-4513. doi: 10.1016/j.enpol.2009.05.073
|
| [166] |
Ürge-Vorsatz D, Novikova A, Köppel S, et al. (2009) Bottom-up assessment of potentials and costs of CO2 emission mitigation in the buildings sector: insights into the missing elements. Energy Effic 2: 293-316. doi: 10.1007/s12053-009-9051-0
|
| [167] |
Gillingham K, Newell R, Palmer K (2006) Energy efficiency policies: A retrospective examination. Annu Rev Environ Resour 31: 161-192. doi: 10.1146/annurev.energy.31.020105.100157
|
| [168] |
Howarth RB, Andersson B (1993) Market barriers to energy efficiency. Energy Econ 15: 262-272. doi: 10.1016/0140-9883(93)90016-K
|
| [169] | Jaffe AB, Stavins RN (1994) The energy-efficiency gap What does it mean? Energy Policy 22: 804-810. |
| [170] | Sorrell S, O'Malley E, Schleich J, et al. (2004) The Economics of Energy Efficiency: Barriers to Cost-Effective Investment, Cheltenham, Edward Elgar. |
| [171] |
Schleich J, Gruber E (2008) Beyond case studies: Barriers to energy efficiency in commerce and the services sector. Energy Econ 30: 449-464. doi: 10.1016/j.eneco.2006.08.004
|
| [172] |
Palm J, Reindl K (2018) Understanding barriers to energy-efficiency renovations of multifamily dwellings. Energy Effic 11: 53-65. doi: 10.1007/s12053-017-9549-9
|
| [173] |
Hassett KA, Metcalf GE (1993) Energy conservation investment. Energy Policy 21: 710-716. doi: 10.1016/0301-4215(93)90294-P
|
| [174] |
Gallagher KS, Muehlegger E (2011) Giving green to get green? Incentives and consumer adoption of hybrid vehicle technology. J Environ Econ Manage 61: 1-15. doi: 10.1016/j.jeem.2010.05.004
|
| [175] |
Adan H, Fuerst F (2015) Modelling energy retrofit investments in the UK housing market. Smart Sustain Built Environ 4: 251-267. doi: 10.1108/SASBE-03-2013-0016
|
| [176] |
Schleich J, Gassmann X, Faure C, et al. (2016) Making the implicit explicit: A look inside the implicit discount rate. Energy Policy 97: 321-331. doi: 10.1016/j.enpol.2016.07.044
|
| [177] |
Zhang L, Wu J, Liu H (2018) Turning green into gold: A review on the economics of green buildings. J Clean Prod 172: 2234-2245. doi: 10.1016/j.jclepro.2017.11.188
|
| [178] |
Hausman JA (1979) Individual Discount Rates and the Purchase and Utilization of Energy-Using Durables. Bell J Econ 10: 33. doi: 10.2307/3003318
|
| [179] |
Gately D (1980) Individual discount rates and the purchase and utilization of Energy-Using durables: Comment. Bell J Econ 11: 373. doi: 10.2307/3003422
|
| [180] |
Dubin JA, McFadden DL (1984) An econometric analysis of residential electric appliance holdings and consumption. Econometrica 52: 345-362. doi: 10.2307/1911493
|
| [181] |
Ruderman H, Levine MD, McMahon JE (1987) The behavior of the market for energy efficiency in residential appliances including heating and cooling equipment. Energy J 8: 101-124. doi: 10.5547/ISSN0195-6574-EJ-Vol8-No1-7
|
| [182] | Dubin JA (1992) Market barriers to conservation: Are implicit discount rates too high? Calif Inst Technol Pasadena, Soc Sci Work Pap 802. |
| [183] | Gates RW (1983) Investing in energy conservation: Are homeowners passing up high yields? Energy Policy 11: 63-71. |
| [184] | Sutherland RJ (1991) Market barriers to energy-efficiency investments. Energy J 12: 15-34. |
| [185] |
Jaffe AB, Stavins RN (1994) The energy paradox and the diffusion of conservation technology. Resour Energy Econ 16: 91-122. doi: 10.1016/0928-7655(94)90001-9
|
| [186] |
Metcalf GE, Hassett KA (1999) Measuring the energy savings from home improvement investments: Evidence from monthly billing data. Rev Econ Stat 81: 516-528. doi: 10.1162/003465399558274
|
| [187] |
Atmadja SS, Sills EO, Pattanayak SK, et al. (2017) Explaining environmental health behaviors: evidence from rural India on the influence of discount rates. Environ Dev Econ 22: 229-248. doi: 10.1017/S1355770X17000018
|
| [188] |
Train K (1985) Discount rates in consumers' energy-related decisions: A review of the literature. Energy 10: 1243-1253. doi: 10.1016/0360-5442(85)90135-5
|
| [189] |
Howarth RB, Sanstad AH (1995) Discount rates and energy efficiency. Contemp Econ Policy 13: 101-109. doi: 10.1111/j.1465-7287.1995.tb00726.x
|
| [190] | Howarth RB (2004) Discount Rates and Energy Efficiency Gap, In: Cutler CJ (Ed.), Encyclopedia of Energy, New York, Elsevier, 817-822. |
| [191] |
Newell RG, Siikamäki J (2015) Individual time preferences and energy efficiency. Am Econ Rev 105: 196-200. doi: 10.1257/aer.p20151010
|
| [192] | Edenhofer O, Pichs Madruga R, Sokona Y (Eds.) (2012) Renewable Energy Sources and Climate Change Mitigation: Special Report of the Intergovernmental Panel on Climate Change, Cambridge, Cambridge University Press. |
| [193] |
Qiu Y, Tiwari A, Wang YD (2015) The diffusion of voluntary green building certification: a spatial approach. Energy Effic 8: 449-471. doi: 10.1007/s12053-014-9303-5
|
| [194] | Qiu Y (Lucy), Su X, Wang YD (2017) Factors influencing commercial buildings to obtain green certificates. Appl Econ 49: 1937-1949. |


Figures(7) / Tables(3)

Sergio Copiello. Economic viability of building energy efficiency measures: a review on the discount rate[J]. AIMS Energy, 2021, 9(2): 257-285. doi: 10.3934/energy.2021014


 DownLoad: