Literature on microgreens, an emerging new functional food crop, remains limited. Further study on microgreens as a promising dietary component for potential use in diet-based disease prevention is, therefore, essential. Given that the anti-inflammatory and anti-oxidant properties of mature licorice root material are well-documented, the objective of the present, preliminary study was to present licorice (Glycyrrhiza glabra L.) as a novel, edible fresh-food microgreen candidate. The effect of leaf, stem and root polyphenol extracts of 20-day old licorice microgreen seedlings on cell proliferation and viability of Caco-2 cells (simulating the intestinal epithelium), after pro-inflammatory induction of lipopolysaccharide (LPS), was examined and then compared to the polyphenol, flavonoid and anti-radical activities of the respective tissue extracts. Root extracts contained a two-fold less polyphenol (including flavonoid) content compared to leaf extracts, but with a five-fold lower anti-radical scavenging activity. Only the root extracts provided functional protection in terms of preserving cell proliferation and viability of LPS-treated Caco-2 cells. Some protection was also afforded by the stems, but the young leaf material offered no anti-inflammatory protection. Results point to a differing composition of anti-inflammatory polyphenols between the root and leaf, suggesting that the protective efficacy of the root extracts (and to some degree, the stem extracts) resides in inhibiting the pro-inflammatory cascade and resultant cytotoxic effects as opposed to a direct anti-radical scavenging activity. Potential use of licorice as a microgreen is promising, but will necessitate further study.
Citation: Ilaria Marotti, Francesca Truzzi, Camilla Tibaldi, Lorenzo Negri, Giovanni Dinelli. Evaluation of licorice (Glycyrrhiza glabra L.) as a novel microgreen from the anti-inflammatory potential of polyphenols[J]. AIMS Agriculture and Food, 2021, 6(1): 1-13. doi: 10.3934/agrfood.2021001
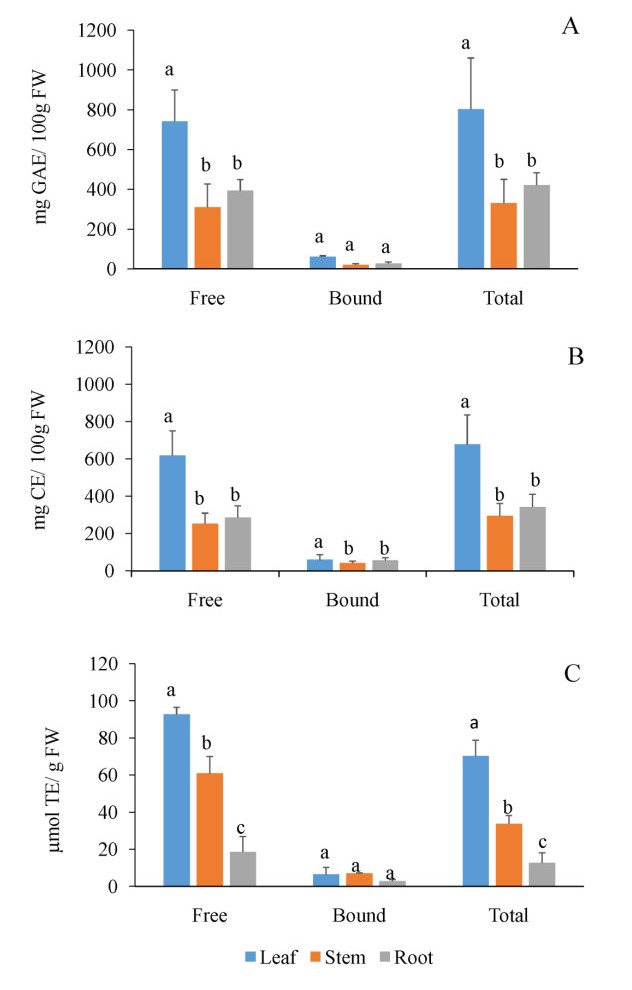
Literature on microgreens, an emerging new functional food crop, remains limited. Further study on microgreens as a promising dietary component for potential use in diet-based disease prevention is, therefore, essential. Given that the anti-inflammatory and anti-oxidant properties of mature licorice root material are well-documented, the objective of the present, preliminary study was to present licorice (Glycyrrhiza glabra L.) as a novel, edible fresh-food microgreen candidate. The effect of leaf, stem and root polyphenol extracts of 20-day old licorice microgreen seedlings on cell proliferation and viability of Caco-2 cells (simulating the intestinal epithelium), after pro-inflammatory induction of lipopolysaccharide (LPS), was examined and then compared to the polyphenol, flavonoid and anti-radical activities of the respective tissue extracts. Root extracts contained a two-fold less polyphenol (including flavonoid) content compared to leaf extracts, but with a five-fold lower anti-radical scavenging activity. Only the root extracts provided functional protection in terms of preserving cell proliferation and viability of LPS-treated Caco-2 cells. Some protection was also afforded by the stems, but the young leaf material offered no anti-inflammatory protection. Results point to a differing composition of anti-inflammatory polyphenols between the root and leaf, suggesting that the protective efficacy of the root extracts (and to some degree, the stem extracts) resides in inhibiting the pro-inflammatory cascade and resultant cytotoxic effects as opposed to a direct anti-radical scavenging activity. Potential use of licorice as a microgreen is promising, but will necessitate further study.

| [1] |
Choe U, Yu LL, Wang TTY (2018) The Science behind Microgreens as an Exciting New Food for the 21st Century. J Agric Food Chem 66: 11519-11530. doi: 10.1021/acs.jafc.8b03096

|
| [2] |
Michell KA, Isweiri H, Newman SE, et al. (2020) Microgreens: Consumer sensory perception and acceptance of an emerging functional food crop. J Food Sci 85: 926-935. doi: 10.1111/1750-3841.15075
|
| [3] |
Xiao Z, Lester GE, Luo Y, et al. (2012) Assessment of vitamin and carotenoid concentrations of emerging food products: Edible microgreens. J Agric Food Chem 60: 7644-7651. doi: 10.1021/jf300459b
|
| [4] |
Kyriacou MC, Rouphael Y, Di Gioia F, et al. (2016) Micro-scale vegetable production and the rise of microgreens. Trends Food Sci Technol 57: 103-115. doi: 10.1016/j.tifs.2016.09.005
|
| [5] |
Butkutė B, Taujenis L, Norkevičienė E (2018) Small-seeded legumes as a novel food source. Variation of nutritional, mineral and phytochemical profiles in the chain: raw seeds-sprouted seeds-microgreens. Molecules 24: 133. doi: 10.3390/molecules24010133
|
| [6] | Kim TK (2015) Glycyrrhiza glabra. In: Kim TK, Edible Medicinal and Non-Medicinal Plants, Springer Link, Vol 10,354-457. |
| [7] |
Yang R, Yuan BC, Ma YS, et al. (2017) The anti-inflammatory activity of licorice, a widely used Chinese herb. Pharm Biol 55: 5-18. doi: 10.1080/13880209.2016.1225775
|
| [8] | Wang D, Liang J, Zhang J, et al. (2020) Natural Chalcones in Chinese Materia Medica: Licorice. Evid Based Complementary Altern Med, Article ID 3821248. |
| [9] |
D'Angelo S, Morana A, Salvatore A, et al. (2009) Protective effect of polyphenols from Glycyrrhiza glabra against oxidative stress in Caco-2 cells. J Med Food 12: 1326-1333. doi: 10.1089/jmf.2008.0285
|
| [10] |
Leonardo CC, Doré S (2011) Dietary flavonoids are neuroprotective through Nrf2-coordinated induction of endogenous cytoprotective proteins. Nutr Neurosci 14: 226-236. doi: 10.1179/1476830511Y.0000000013
|
| [11] |
Kim HJ, Seo JY, Suh HJ, et al. (2012) Antioxidant activities of licorice derived prenylflavonoids. Nutr Res Pract 6: 491-498. doi: 10.4162/nrp.2012.6.6.491
|
| [12] |
Fu Y, Chen J, Li YJ, et al. (2013) Antioxidant and anti-inflammatory activities of six flavonoids separated from licorice. Food Chem 141: 1063-1071. doi: 10.1016/j.foodchem.2013.03.089
|
| [13] |
Gong, H. Zhang BK, Yan M, et al. (2015) A protective mechanism of licorice (Glycyrrhiza uralensis): isoliquiritigenin stimulates detoxification system via Nrf2 activation. J Ethnopharmacol 162: 134-139. doi: 10.1016/j.jep.2014.12.043
|
| [14] | Cao LJ, Hou ZY, Li HD, et al. (2017) The Ethanol Extract of Licorice (Glycyrrhiza uralensis) Protects against Triptolide-Induced Oxidative Stress through Activation of Nrf2. Evid Based Complementary Altern Med, Hindawi, Article ID 2752389. |
| [15] |
Iftikhar M, Iftikhar A, Zhang H, et al. (2020) Transport, metabolism and remedial potential of functional food extracts (FFEs) in Caco-2 cells monolayer: A review. Food Res Int 136: 109240. doi: 10.1016/j.foodres.2020.109240
|
| [16] |
Panaro MA, Carofiglio V, Acquafredda A, et al. (2012) Anti-inflammatory effects of resveratrol occur via inhibition of lipopolysaccharide-induced NF-κB activation in Caco-2 and SW480 human colon cancer cells. Brit J Nut 108: 1623-1632. doi: 10.1017/S0007114511007227
|
| [17] | Bose S, Kim H (2013) Evaluation of in vitro anti-inflammatory activities and protective effect of fermented preparations of rhizome atractylodis macrocephalae on Intestinal Barrier Function against lipopolysaccharide insult. Evid Based Complementary Altern Med, Article ID 363076. |
| [18] |
Wu XX, Huang XL, Chen RR, et al. (2019) Paeoniflorin prevents intestinal barrier disruption and Inhibits lipopolysaccharide (LPS)-induced inflammation in Caco-2 cell monolayers. Inflammation 42: 2215-2225. doi: 10.1007/s10753-019-01085-z
|
| [19] |
Adom KK, Sorrells ME, Liu RH (2003) Phytochemical Profiles and Antioxidant Activity of Wheat Varieties. J Agric Food Chem 51: 7825-7834. doi: 10.1021/jf030404l
|
| [20] |
Mattila P, Pihlava JM, Hellström J (2005) Contents of phenolic acids, alkyl- and alkenylresorcinols, and avenanthramides in commercial grain products. J Agric Food Chem 53: 8290-8295. doi: 10.1021/jf051437z
|
| [21] | Singleton VL, Orthofer R, Lamuela-Raventós RM (1999) Analysis of total phenols and other oxidation substrates and antioxidants by means of Folin-Ciocalteu reagent, In: Methods in Enzymology, Oxidants and Antioxidants Part A. Academic Press, 152-178. |
| [22] |
Brand-Williams W, Cuvelier ME, Berset C (1995) Use of a free radical method to evaluate antioxidant activity. LWT - Food Sci Tech 28: 25-30. doi: 10.1016/S0023-6438(95)80008-5
|
| [23] |
Truzzi F, Valerii MC, Tibaldi C, et al. (2020) Are supplements safe? Effects of gallic and ferulic acids on in vitro cell models. Nutrients 12: 1591. doi: 10.3390/nu12061591
|
| [24] |
Asano T, Ishihara K, Morota T, et al. (2003) Permeability of the flavonoids liquiritigenin and its glycosides in licorice roots and davidigenin, a hydrogenated metabolite of liquiritigenin, using human intestinal cell line Caco-2. J Ethnopharmacol 89: 285-289. doi: 10.1016/j.jep.2003.09.009
|
| [25] |
Wang XX, Liu GY, Yang YF (2017) Intestinal absorption of triterpenoids and flavonoids from Glycyrrhizae radix et rhizoma in the human Caco-2 Monolayer Cell Model. Molecules 22: 1627. doi: 10.3390/molecules22101627
|
| [26] |
Wätjen W, Michels G, Steffan B, et al. (2004) Low concentrations of flavonoids are protective in Rat H4IIE Cells whereas high concentrations cause DNA damage and apoptosis. J Nutr 135: 525-531. doi: 10.1093/jn/135.3.525
|
| [27] |
Abotaleb M, Samuel SM, Varghese E, et al. (2019) Flavonoids in Cancer and Apoptosis. Cancers 11: 28. doi: 10.3390/cancers11010028
|
| [28] |
Dinu M, Whittaker A, Pagliai G, et al. (2017) Ancient wheat species and human health: biochemical and clinical implications. J Nutr Biochem 52: 1-9. doi: 10.1016/j.jnutbio.2017.09.001
|
| [29] |
Jia H, Hanate M, Aw W, et al. (2017) Eggshell membrane powder ameliorates intestinal inflammation by facilitating the restitution of epithelial injury and alleviating microbial dysbiosis. Sci Rep 7: 43993. doi: 10.1038/srep43993
|


Figures(4)

Ilaria Marotti, Francesca Truzzi, Camilla Tibaldi, Lorenzo Negri, Giovanni Dinelli. Evaluation of licorice (Glycyrrhiza glabra L.) as a novel microgreen from the anti-inflammatory potential of polyphenols[J]. AIMS Agriculture and Food, 2021, 6(1): 1-13. doi: 10.3934/agrfood.2021001


 DownLoad: