Review Special Issues

The pedunculopontine nucleus: From posture and locomotion to neuroepigenetics

  • In this review, we discuss first an example of one of the symptoms of PD, freezing of gait (FOG), then we will turn to the use of deep brain stimulation (DBS) of the pedunculopontine nucleus (PPN) to treat PD, and the original studies that led to identification of the PPN as one source of locomotor control and why stimulation frequency is critical, and then describe the intrinsic properties of PPN neurons that require beta/gamma stimulation in order to fully activate all types of PPN neurons. Finally, we will describe recent findings on the proteomic and molecular consequences of gamma band activity in PPN neurons, with emphasis on the potential neuroepigenetic sequelae. These considerations will provide essential information for the appropriate refining and testing of PPN DBS as a potential therapy for PD, as well as alternative options.

    Citation: T. Virmani, F. J. Urbano, V. Bisagno, E. Garcia-Rill. The pedunculopontine nucleus: From posture and locomotion to neuroepigenetics[J]. AIMS Neuroscience, 2019, 6(4): 219-230. doi: 10.3934/Neuroscience.2019.4.219

    Related Papers:

    [1] Kai Jiang, Wei Si . High-order energy stable schemes of incommensurate phase-field crystal model. Electronic Research Archive, 2020, 28(2): 1077-1093. doi: 10.3934/era.2020059
    [2] Hongquan Wang, Yancai Liu, Xiujun Cheng . An energy-preserving exponential scheme with scalar auxiliary variable approach for the nonlinear Dirac equations. Electronic Research Archive, 2025, 33(1): 263-276. doi: 10.3934/era.2025014
    [3] Huanhuan Li, Lei Kang, Meng Li, Xianbing Luo, Shuwen Xiang . Hamiltonian conserved Crank-Nicolson schemes for a semi-linear wave equation based on the exponential scalar auxiliary variables approach. Electronic Research Archive, 2024, 32(7): 4433-4453. doi: 10.3934/era.2024200
    [4] Liupeng Wang, Yunqing Huang . Error estimates for second-order SAV finite element method to phase field crystal model. Electronic Research Archive, 2021, 29(1): 1735-1752. doi: 10.3934/era.2020089
    [5] Ishtiaq Ali . Advanced machine learning technique for solving elliptic partial differential equations using Legendre spectral neural networks. Electronic Research Archive, 2025, 33(2): 826-848. doi: 10.3934/era.2025037
    [6] Hongze Zhu, Chenguang Zhou, Nana Sun . A weak Galerkin method for nonlinear stochastic parabolic partial differential equations with additive noise. Electronic Research Archive, 2022, 30(6): 2321-2334. doi: 10.3934/era.2022118
    [7] Victor Ginting . An adjoint-based a posteriori analysis of numerical approximation of Richards equation. Electronic Research Archive, 2021, 29(5): 3405-3427. doi: 10.3934/era.2021045
    [8] Jun Pan, Yuelong Tang . Two-grid $ H^1 $-Galerkin mixed finite elements combined with $ L1 $ scheme for nonlinear time fractional parabolic equations. Electronic Research Archive, 2023, 31(12): 7207-7223. doi: 10.3934/era.2023365
    [9] Cheng Wang . Convergence analysis of Fourier pseudo-spectral schemes for three-dimensional incompressible Navier-Stokes equations. Electronic Research Archive, 2021, 29(5): 2915-2944. doi: 10.3934/era.2021019
    [10] Shasha Bian, Yitong Pei, Boling Guo . Numerical simulation of a generalized nonlinear derivative Schrödinger equation. Electronic Research Archive, 2022, 30(8): 3130-3152. doi: 10.3934/era.2022159
  • In this review, we discuss first an example of one of the symptoms of PD, freezing of gait (FOG), then we will turn to the use of deep brain stimulation (DBS) of the pedunculopontine nucleus (PPN) to treat PD, and the original studies that led to identification of the PPN as one source of locomotor control and why stimulation frequency is critical, and then describe the intrinsic properties of PPN neurons that require beta/gamma stimulation in order to fully activate all types of PPN neurons. Finally, we will describe recent findings on the proteomic and molecular consequences of gamma band activity in PPN neurons, with emphasis on the potential neuroepigenetic sequelae. These considerations will provide essential information for the appropriate refining and testing of PPN DBS as a potential therapy for PD, as well as alternative options.


    Towards the end of 2019, the nations worldwide looked on as the city of Wuhan in China and then the province of Hubei together comprising of around 72 million residents went for “lock-down”. We all were hopeful that the new virus would be controlled effectively which is now familiar by the name of COVID-19. Despite effective measures, the virus began to be contagious to other nations impacting not only the health of people but also the economies. Gradually the mobility of people got constrained. The supply chain of commodities was interrupted due to restrictions in the movement of freight. In Australia, for example, the effect was initially noticed in tourism business houses which dealt with the movement of people. Australia witnessed a sudden downfall in inbound tourists from China. The Australian Bureau of Statistics (ABS, 2016) reported that in the recent decade China and India were the two important emerging markets, Chinese tourist arrivals reached a level of growth of 22 per cent in 2015–2016. However, as the number of coronavirus afflicted cases spread across the Chinese economy, the Australian dollar showed signs of rapid depreciation because China is a major trading partner. Other nations are also facing falling Chinese demand for services such as air travel and tourism. The implications of the COVID-19 have now become serious since it has spread to other nations. The UNWTO has estimated that international tourists’ arrival globally would decline by 20 per cent to 30 per cent in 2020. According to the estimates of the UNWTO, the loss in terms of income generation worldwide would be around 450 billion US dollars expressed in terms of international tourism receipts. Restrictions in air travel coupled with flight cancellations particularly for leisure, education and business purposes are having a significant impact on the Australian economy. Further, the global spread of the virus is hovering uncertainty and severely impacting people’s business confidence. In this paper, we try to explore how Chinese inbound tourism in Australia is impacted by COVID-19 generated uncertainty, explored through the recently developed index related to COVID-19, familiar by the name “Discussion about Pandemics Index (PI)” developed by Ahir et al. (2018) and Ahir et al. (2020). This is the newly generated version of the World economic Uncertainty Index adapted to encapsulate the pandemic impact, Ahir et al. (2018) and Ahir et al. (2020). Australian tourism policymakers need to understand how COVID-19 induced uncertainty will impact Chinese inbound tourism. Such an analysis will provide timely awareness and will help in formulating better tourism management policies for recuperating the tourism growth momentum.

    This study contributes to the existing literature by exploring the asymmetric impact of COVID-19 pandemic induced uncertainty explored through the PI index on inbound Chinese tourists to Australia. The impact of asymmetric uncertainty on Chinese inbound tourism is indeed an unexplored area and the study is expected to throw insights particularly in the Australian context which has a large share of Chines tourists. According to Baker et al. (2020) the COVID-19 pandemic will generate huge shock in the global economy and may lead to a rise in uncertainty comparable to the times of the Great Depression. This paper explores the asymmetric impact of COVID related uncertainty measured by the newly formulated index (Discussion about Pandemics Index) conceptualized by Baker et al. (2020 and postulated by Ahir et al. (2020). The present research will make a unique contribution because ⅰ) it is exploring the dynamics of COVID-19 induced uncertainty on tourism in an asymmetric framework applying the pioneering method of Shin et al. (2014); ⅱ) it covers a wide range of time-series data from 1996Q to2020Q1; ⅲ) to produce a more comprehensive picture on the responsiveness of tourism to uncertainty, the study has used income, relative prices, exchange rate volatility, globalization, climatic effects as major control variables, using the nonlinear autoregressive distributed lag model of the cointegrating framework and ⅳ) to our knowledge it is the first study to explore the time series dynamics of uncertainty for Chinese tourists in Australia at the backdrop of the global pandemic incorporating the effects of exchange rate volatility in the face of uncertainty, which may have spillover on tourism. By investigating how the newly constructed COVID-19 induced World economic Uncertainty Index formulated by Ahir et al. (2018) and Ahir et al. (2020) impacts tourism demand, the study attempts to capture the pandemic impact unlike the previous which are based on dummy variables. The major explanatory variable as defined by Ahir et al. (2018) and Ahir et al. (2020) is “Discussion about Pandemics Index (PI)” has not been widely used so the paper makes a unique contribution by utilizing the new time series data sets. Further the absence of earlier studies quantifying this impact of economic uncertainty shocks for the Australian economy make the study interesting, particularly because Australia is a major trading partner of China; and the Australian tourism industry already had a tough period with the bush fire and now the COVID-19 restrictions implying that it would not be all that same before the tourism industry recovers. The paper henceforth is designed as follows the subsequent section delves on the recent literature related to uncertainty and tourism, the materials and methods used are explained in Section 3 the major results are discussed in Section 4 and the paper is finally concluded in Section 5.

    In today’s globalized world the importance of uncertainty is crucial in shaping economic policy decisions. According to Eberly (1994) households generally, postpone decisions to procure non-essential commodities when there is a situation of high chances of uncertainty regarding earnings. The decision of the household to postpone consumption ultimately transmits to a shock in production thereby leading to the fall in GDP; Bloom et al. (2007). The uncertainty induced policy decisions impacts consumer decisions adversely and this ultimately lowers economic growth, (Bloom, 2009; Pastor & Veronesi, 2012). Williams and Balaz (2014) urge that there is a need for stronger theoretical underpinning on the concept of risk and uncertainty related to tourism. The study argues that the impact of uncertainty on tourism may vary across economies and income groups. Policy analysts need to consider wide-ranging behaviour of individual assessment-based travel decisions in the face of uncertainty. Economic Policy Uncertainty has a stronger impact in reducing growth than monetary or fiscal policies, Handley & Limao (2015). Baker et al. (2016) developed an economic policy uncertainty index (EPU) which is increasingly used in the literature to study its impact on the behaviour of firms, households, corporates and trade. The Baker et al. (2016) EPU index encapsulates information about uncertainty from leading dailies, stock markets, business surveys and policies about taxes. The EPU index has generated wide-ranging applications in the literature on tourism demand across varying periods in different countries.

    Giglio et al. (2016) observe that the behaviour of the household’s decisions to postpone consumption becomes tougher during the times of economic downswings. Barrero et al. (2017) discuss that the uncertainty has a long-term impact upon the economy. Caggiano et al. (2017) discuss that Economic Policy Uncertainty (EPU) has a more important bearing on unemployment concerning monetary policy shock wave. Gozgor and Ongan (2017) based on cointegration model, using quarterly data over 1998Q1 to 2015Q4 for tourism expenditure in the USA discusses that EPU negatively impacts tourism expenditure in the long-run. Tsui et al. (2017) based on a panel gravity model study the impact of EPU on business tourism in New Zealand. Apart from EPU trade, distance and flight seats were significant factors in explaining the demand for business tourism in New Zealand. Such findings are crucial for policy interventions in expanding tourism for business purpose in New Zealand. Demir and Gözgör (2018) explores the impact of policy-related economic uncertainty on tourism demand. The study concludes based on a panel data set for fifteen countries that high rate of policy-related uncertainty in a country lowers outbound tourism flows. Ongan and Gozgor (2018) using quarterly data sets over 1996Q1 to 2015Q1 explores the impact of EPU on tourist arrivals in the United States from Japan. The paper concludes based on cointegrating models that one per cent variation in the EPU leads to falling in the number of Japanese tourist arrivals in the USA by 4.7 per cent in the long-run. Gozgor and Demir (2018) investigates the effect of economic policy uncertainty on outbound travel expenses for a panel set of seventeen developing and developed countries based on advanced time series techniques. The paper concludes that economic policy uncertainty impacts travel expenses negatively further the impact is stronger for the case of the developing economies. Isik et al. (2019) utilizes monthly data for tourist arrivals over January 1996 to September 2017 in the USA, from the countries of Mexico and Canada to study the impact of EPU. The study finds that Canadian tourists were more sensitive to rising EPU in comparison to the Mexican tourists. The paper concludes that EPU is a significant factor in predicting tourist arrivals. Wu and Wu (2019) studied the impact of EPU on tourism in Ireland, Greece, Portugal and Spain using wavelength techniques based on annual observations, 1995 to 2015. The study concludes that in the short-run there is a one-directional causal association from EPU to tourism receipts and in the long-run, there is both way causality between tourism receipts and EPU. The paper thrusts upon the importance of continued government intervention in these European countries to expand tourism. Demir et al. (2019) using the geopolitical index, analyses the impact on inbound tourism for a set of eighteen countriesfrom1995 to 2016. Using advanced econometric techniques, the study concludes that the geopolitical index adversely impacts tourism. Akadiri et al. (2019) utilizing panel data across countries over the period 1995 to 2016 explored the impact of EPU upon tourist arrivals. Based on the new Granger causality tests, proposed Emirmahmutoglu and Kose (2011), for the heterogeneous panel, Akadiri et al. (2019) concludes that there is two-way causality between tourist arrivals and EPU for France, United States and Ireland, one-directional causality for Canada, China, Brazil and Germany. However, for the countries of Chile, Japan, South Korea no causality was observed. The paper suggests that countries which have bidirectional causality between tourism and EPU needs to explore why EPU is generating a feedback impact on tourism.

    Nguyen and Schinckus (2020) point out that in the event of uncertainty people may travel frequently to nearby destinations but may reduce spending in the face of falling incomes. The paper concludes that EPU has a manifold impact on tourism. Khan et al. (2020) based on the gravity model study the impact of EPU on inbound tourism in the United Kingdom. Based on time-varying Granger model the study finds that EPU granger causes tourism in the United Kingdom. The paper observes that policy measures should reflect upon time-varying estimates for accuracy in forecasting tourist arrivals. Sio-Chong and So (2020) explores the adverse impact of the financial crisis, health epidemic and climatic disasters, on inbound tourism in two important cities of China namely Macao and Hong Kong. The paper observes that diverse categories of crisis will adversely impact the tourism industry in varying degrees. Policymakers need to be cautious to be able to tackle the varying impacts of uncertainty upon tourism and ensure that more tourists visit popular destinations during favourable times.

    The increasing importance of impact of the uncertainty in today’s globalized economy has prompted many scholars to consider it as an additional explanatory factor in analyzing tourism demand along with the well-established explanatory factors in the literature, for example, Gross Domestic Product, Consumer Price Index and exchange rate volatility; Li et al. (2005), Thompson & Thompson (2010), Isik & Radulescu (2017), Ongan et al. (2017), Isik et al. (2018), Isik et al. (2019) and Dogru et al. (2019). Dogru et al. (2019) based on NARDL explored the impact of exchange rate on tourism trade balance with major trading partners of the U.S. The study concludes that exchange rate depreciation of the US improves the trade balance for tourism. Further Isik et al. (2019) explored the impact of exchange rate fluctuations based on the NARDL model for tourism demand in Turkey. The study concludes that depreciation of Euro expands tourism in Turkey.

    There is a general agreement in the current literature that EPU has an adversative impact on numerous economic aspects and policy decision making of business houses. A growing number of studies recently discuss that EPU effect on numerous economic factors is often asymmetric. The subject matter of asymmetry in the EPU indeed makes the discussion more complex, for example, Bahmani-Oskooee et al. (2019). The notable works that deal with the asymmetric impact of uncertainty on tourism are Schwartz Z (2007), Shareef & McAleer (2007), Chen and Chiou-Wei (2009), Divino & McAleer, (2010) and Sharma (2019). A significant variety of the literature discusses the impact of pandemics on tourism, Zeng et al. (2005) discussed the impact of the SARS epidemic of 2003 on the tourism industry in China. The study suggests that proper planning and strategic partnerships can ensure proper recovery for the tourism industry because it is characteristic of high elasticity of demand. McAleer et al. (2010) explores the effect of the SARS epidemic and Avian Flu disease on inbound international tourism for Asia. The empirical results show that the impact of the SARS epidemic is more intense in comparison to the impact of the Avian Flu disease. Notable recent studies include works of Yang et al. (2020) and Karabulut et al. (2020) among others. Yang et al. (2020) made a pioneering contribution by applying the dynamic stochastic general equilibrium (DSGE) model to study the impact of the COVID-19 on the tourism industry. The study analyses the severity of the impact of the pandemic on tourism. Karabulut et al. (2020) based on the recently developed index, Discussion about Pandemics Index studied the impact on tourism. The study using the methodology discussed by Ahir et al. (2018) and Ahir et al. (2020) concludes that the impact of pandemic reduces tourist arrivals but this is effective for the low-income nations. Karabulut et al. (2020) study is the only research as of now based on the new data sets apart from this present research.

    The major conclusion that emerges from the review of literature is that in today’s era of a globalized economy uncertainty in any part of the world transmits into economic decision making on the other side of the globe. It not only affects macro factors but impacts consumers decision making. In the event of uncertainty, the vacation plans of consumers get severely impacted because they can be postponed or abandoned. However, the majority of the discussion on uncertainty and tourism is based on a linear framework, yet the crucial shortcoming of linear time series model according to Anoruo (2011) is variables often exhibit nonlinear properties. The present study tries to overcome the limitation by applying a non-linear model in a time series framework. The two major questions that this study will examine in a nonlinear framework: Are tourists sensitive to pandemic uncertainty? If yes what is the extent of responsiveness?

    The baseline model explaining how Chinese tourist inflows in Australia is impacted by uncertainty is explained in the Equation (1), apart from exploring uncertainty impact, Equation (1) examines the other factors affecting tourists’ inflows, using variables that are widely available in the literature.

    $ T{A_{ijt}} = {\beta _0} + {\beta _1}I{C_{it}} + {\beta _2}{P_{ijt}} + {\beta _3}{G_{it}} + {\beta _4}PI + {\beta _5}{V_{it}} + {\beta _5}{T_{ijt}} + {D_t}1 + {D_t}2 + {\lambda _t} + {u_{it}} $ (1)

    Here TA represents tourist arrival from China (country i) to Australia (country j) in proportion to other tourists arriving from North Asian region in time t, IC represents per capita income of the iith country at time t, P indicates the relative price index between country i and j, G is the index of globalization for country i, PI is the measure of pandemic induced uncertainty at global level, V is the exchange rate volatility measure and T is the measure of the temperature difference between the country of origin and the destination country, D1 (encompassing time 1997Q3 to Q41999) and D2 (encompassing time 2008Q to 2011Q3) are dummy variables representing the Asian crisis and the global financial crisis respectively$, {\lambda }_{t} $ shows the time trend and $ {u}_{ij} $ is the usual error term.

    Higher per capita income of the Chinese tourists is expected to augment tourism since it enhances the purchasing power, higher relative price in country j in comparison to the country i implies a rise in expenditure which will adversely impact tourist flows. The literature on tourism economics extensively utilizes the ratio of a consumer price index (CPI) of the country of origin from where tourists are arriving and the destination country’s CPI, weighted by the exchange rate to measure the price level faced by the tourists in the destination country, for example, Dritsakis (2004) and Morley (1994). So, following the earlier methods here P denotes the ratio of CPI between China and Australia weighted by the real exchange rate. According to Song et al. (2018) there is a reciprocal association between tourism and globalization. Tourism is an important factor in influencing globalization while the entire process of tourism demand is impacted by the dynamics of globalization. Globalization is expected to favourably impact tourism. Uncertainty will dampen tourism and the number of tourists visiting the destination country will fall. The recent uncertainty initiated by the COVID-19 surrounds almost every aspect of living. The containment of the pandemic depends upon the efficacy of social-distancing, lockdowns and availability of proper vaccines and other associated strategies to combat health disorders. It is difficult to predict whether the short-term policy response of the government will continue to affect uncertainty in consumer spending as the pandemic retrocedes.

    Exchange rate volatility is associated with uncertainty and hence it will adversely affect tourist inflows. Several studies, for example, Agiomirgianakis et al. (2014) and Akhtar and Hilton (1984) concludes that exchange rate volatility adversely impacts international trade and travel. Exchange rate volatility indicated by V is calculated by using the standard deviation of the logarithmic value of exchange rate (moving average value) expressed in real terms. The rationale behind the inclusion of T in the model is for examination whether climatic conditions affect tourist’s decision to travel. Good weather conditions are important for a holiday at the beach and the cruise.

    The dependent variable is TA which shows the number of non-resident Chinese tourists’ arrivals to Australia in time t as a proportion of total tourists arriving from North Asia to Australia. The data for tourist arrivals is available from the Australian Bureau of Statistics, monthly from 1996 to 2020. It was calculated based on quarterly frequency to bring consistency with the explanatory variables.

    Explanatory variables

    Data on Gross Domestic Product (GDP) for China, in the local currency, quarterly observations are obtained from Economic Research Database of Federal Reserve Bank of St. Louis. The World Bank extrapolated population data which was obtained from the World Population Prospects, United Nations (2020), as quarterly estimates. This population data was used to divide GDP for China to obtain per capita income, IC. The Consumer Price Index Data (CPI) for both Australia and China is obtained from Economic Research Database of Federal Reserve Bank of St. Louis, as quarterly observations. The real effective exchange rate for China based on quarterly observations is also obtained from the Economic Research Database of Federal Reserve Bank of St. Louis. The P measure was obtained as the relative of CPI of the two countries weighted by the exchange rate. The index of globalization for China is obtained from Swiss Economic Institute annual observations are converted to quarterly observations. The quarterly observations on COVID-19 induced uncertainty index are obtained from the Economic Policy Uncertainty Data Portal. Our major explanatory variable is the “Discussion about Pandemics Index (PI)” postulated by Ahir et al. (2018) & Ahir et al. (2020)1. The index is developed by counting the number of times pandemic-related words are used in the Economist Intelligence Unit Country reports, which are available until the first quarter of 2020. A higher index value indicates a higher discussion about pandemics and hence high global economic uncertainty and contrariwise. The distinct characteristic of this index is that its methodology was restructured on April 4, 2020 and also measures deliberations on the COVID-19 pandemic at global and national levels. Baker et al. (2020) discuss that the newly constructed index quantifies the high rise in the levels of economic uncertainty witnessed across the globe during the first quarter of 2020. Last, the data on temperature from the two capital cities of China and Australia was obtained from tutiempo.net portal. The daily temperature data was converted to quarterly observations for maintaining parity with the other explanatory variables. Table 1 provides the details of the description of the variables and the data source. All observations run from 1996 Q1 to 2020Q1. Since some variables are obtained in monetary units and others in real terms all variables are expressed in relative terms for normalization of the data set of observations. Further Table 2 provides an overview of the summary statistics of the variables utilized in the study. Based on Table 2 the mean of TA is 0.24, the standard deviation is 0.19, the mean of IC is 6719.20 and the standard deviation is 5769.49. All observations are positively skewed except T. The kurtosis of PI is quite high, 11.09.

    Table 1.  Data source and description of variables.
    Source Frequency Description of Variable Variable Constructed
    Australian Bureau of Statistics Monthly, converted to quarterly observations Tourist arrivals from China to Australia as a proportion of total tourists from North Asia to Australia. $ {TA}_{ijt} $: Proportion of tourist arrivals to Australia from China in time t.
    Economic Research Database of Federal Reserve Bank of St. Louis Quarterly Observations Gross Domestic Product (GDP)of China expressed in local currency $ {IC}_{it} $:Per capita income Obtained by dividing GDP by population.
    United Nations, World Population Prospects Quarterly Estimates Population
    Economic Research Database of Federal Reserve Bank of St. Louis Quarterly Observations, the base year 2015 CPI of China & CPI of Australia $ {P}_{ijt}$:relative price index, $obtained by dividing CPI of China by CPI of Australia weighted by exchange rate.
    Economic Research Database of Federal Reserve Bank of St. Louis Quarterly Observations, the base year 2015 Exchange Rate for China $ {V}_{it}: $ Volatility Measure of the exchange rate.
    Swiss Economic Institute Annual Observations converted to quarterly observations Index for Globalization:China $ {G}_{it} $ : Globalization Index.
    Economic Policy Uncertainty data portal Quarterly Observations Discussion about Pandemics Index (PI) conceptualized by Baker et al., (2020 and postulated by Ahir, H, N Bloom, and D Furceri (2018) & (2020). $ {PI}_{it}: $ COVID-19 generated worldwide uncertainty index.
    Data PortalTutiempo.net Daily observations converted to quarterly average estimates The temperature of the two capital cities namely Beijing and Canberra $ {T}_{ijt} $ : Temperature difference in time t between the country i and country j.

     | Show Table
    DownLoad: CSV
    Table 2.  Descriptive statistics of the variables.
    Variables Mean Median Standard deviation Maximum Minimum Skewness Kurtosis
    TA 0.24 0.19 0.19 0.57 0.01 0.35 1.60
    IC 6719.20 4300.36 5769.49 19962.22 457.32 0.76 2.27
    P 0.88 0.86 0.08 1.22 0.76 1.86 8.01
    G 56.36 61.37 8.95 65.10 38.25 −0.69 1.98
    PI 1.64 1 2.23 204.1 0 2.54 11.09
    V 0.03 0.02 0.02 0.13 0.002 1.02 3.80
    T 15.11 23.08 13.19 31.52 −1.95 -0.01 1.22
    Note: Compilation Author.

     | Show Table
    DownLoad: CSV

    1 The Appendix provides a detailed exposition on the new measure Discussion about Pandemics Index (PI)

    For our empirical estimation we apply the NARDL, (nonlinear autoregressive distributed lag model) postulated by Shin et al. (2014) to explore the cointegrating relation and asymmetric association across the variables. Several studies relating to economics and finance have discussed the significance of the NARDL methodology; for example, Verheyen (2013) discussed the importance of nonlinearity in export demand based on the NARDL methodology, Bahmani-Oskooee & Nayeri (2018) delve on the significance of non-linear asymmetric methodology while studying the demand for money in Australia; Bahmani-Oskooee & Saha (2019) utilized the nonlinear asymmetric model for assessing the asymmetric impact of policy uncertainty on stock prices, Liu et al. (2019) discuss the asymmetric impact of international policies on national policies and further Nasar et al. (2019) pioneering study discusses the importance of the asymmetric impact of economic growth on income inequality in the United States using the NARDL analysis.

    The NARDL model is an expansion of the linear ARDL model, Pesaran and Shin(1998, 2001). The ARDL model is applicable for small samples. Further unlike the VECM the NARDL model does not require the same order of integration of the variables, it could be either I(0) or I(1) but not I(2). The NARDL has some advantages over other nonlinear-model for example, Balke and Fomby (1997), Kapetanios, Shin and Snell (2006); and Krolzig (2013). Though such methods have taken into consideration the issue of nonlinearity in an error correction framework, the use is limited since the long-run cointegration of these models are based on non-stationarity properties which are linear. The NARDL model does away with the problem of endogeneity bias. It also does not have the convergence difficulty in case of a large number of parameters. Due to the distinct advantages of the NARDL model this paper applies the method to explore the asymmetry dynamics.

    Based on Shin et al. (2014) Equation (2) expresses the long-run cointegrating regression,

    $ {y_t} = {\beta ^ + }x_t^ + + {\beta ^ - }x_t^ - + {u_t} $ (2)

    $ {y}_{t} $ is the dependent variable in this context it is TA $.{x}_{t} $ refers to the set of explanatory variables, for example, IC, P, PI, V, G and T. $ {\beta }^{+} $ and $ {\beta }^{-} $ are the long run parameters to be estimated. $ {x}_{t } $ is a vector of K*1 regressors which is defined asymmetrically, in particular, $ {x}_{t } $ is expressed as $ {x}_{t} = {x}_{0} $+$ {x}_{t}^{+} $+$ {x}_{t}^{-} $, $ {x}_{0} $is the initial value

    Equations (3) and (4) show the decomposition of the explanatory variables into their positive and negative partial sums respectively based on the NARDL model,

    $ x_t^ + = \sum_{j = 1}^t \Delta x_j^ + = \sum_{j = 1}^t {max} (\Delta x_j^ +, 0) $ (3)
    $ x_t^ - = \sum_{j = 1}^t {\Delta x_j^ - } = \sum_{j = 1}^t {min} (\Delta x_j^ -, 0) $ (4)

    Equation (2) can be expanded to model contemporaneously the long- and short-run asymmetries within the NARDL framework. The error correction form of the NARDL model for tourist arrivals is expressed in the Equation (5)

    $ ΔTAt=θ+mk=1θ1kΔTAtk+mk=1θ2kΔIC+tk+mk=1θ3kΔICtk+mk=1θ4kΔP+tk+mk=1θ5kΔPtk+mk=1θ6kΔG+tk+mk=1θ7kΔGtk+mk=1θ8kΔT+tk+mk=1θ9kΔTtk+mk=1θ10kΔPI+tk+mk=1θ11kΔPItkmk=1θ12kΔV+tk+mk=1θ13kΔVtk+λ1TAt1+λ2IC+t1+λ3ICt1+λ4P+t1+λ5Pt1+λ6G+t1+λ7Gt1+λ8T+t1+λ9Tt1+λ10PI+t1+λ11PIt1+λ12V+t1+λ13Vt1++ECTtk+ψD1t+ζD2t+μt
    $
    (5)

    We estimate Equation (5) to explore the asymmetric association and cointegrating relation across tourist arrivals, income, globalization, uncertainty expressed through PI, prices, the volatility of exchange rate and temperature. ECT is the error correction term the coefficient of which denotes rate of divergence from long-run equilibrium.

    $ ∆ $ is the first difference operator; the coefficients $ {\theta }_{ik} $, I = 1, 2……11, are short-run coefficients while the coefficients $ {\lambda }_{i} $ I = 1, 2…..11 denote the long-run coefficients of the model, $ \psi \& $ ζ are coefficients of the dummy variable.$ {\mu }_{t} $ is the usual disturbance term.

    Following the bounds-test method, Shin et al. (2014), the F-statistic is applied to test the null of the hypothesis of no cointegration implying $ {\lambda }_{1} $ = $ {\lambda }_{2} $ = $ {\lambda }_{3} $ = $ {\lambda }_{4} $ = $ {\lambda }_{5} $ = $ {\lambda }_{6} $ = $ {\lambda }_{7} $ = $ {\lambda }_{8} $ = $ {\lambda }_{9} $ = $ {\lambda }_{10} $ = $ {\lambda }_{11} $ = 0. Next, the Wald Test is applied to test the short-run and long-run asymmetric behaviour. To evaluate the existence of the long-run non-linearity the null hypothesis of long-run symmetry is tested: $ {\alpha }^{+ } $ = $ {\alpha }^{-}; $ where $ {\alpha }^{+ } $ = $ {\lambda _i}^ + /{\lambda _1} $ i = 2, 4, 6, 8, 10 and $ { \alpha }^{-} $ = ${\lambda _j}^ - /{\lambda _1}$ $, j = 3, 5, 7, 11

    The existence of short-run symmetry is tested as: $ \sum _{k = 1}^{m}{\theta }_{ik} $ = $ \sum _{k = 1}^{m}{\theta }_{jk} $, I = 2, 4, 6, 8, 10 and j-3, 5, 7, 9, 11.

    Before using any time series method, it is essential to find out the stationary properties of the observations, otherwise, the results obtained may be spurious, Granger & Newbold (1974). To explore the stationary properties of the time series, the augmented Dickey-Fuller unit root test (ADF test), (1979), the DF-GLS unit root test, Elliot, Rothenberg and Stock (ERS), (1996) and the Phillips-Perron unit root test (PP), Phillips, and Perron (1988) are used here. Table 3 summarizes the unit root test results based on ADF, PP and DF-GLS methods. The findings of Table 3 suggest that the variables are integrated of order I(0) or I(1) since none of the variables is of I(2) we can apply the NARDL model without any indecisiveness.

    Table 3.  Unit root test: ADF and Phillips Perron (PP) and DF-GLS test.
    Variables at Level ADF test statistic Results PP Test statistic Results DF-GLS test statistic Results
    TA −1.07 Non-Stationary −0.62 Non-Stationary −1.82 Non -stationary
    IC −2.12 Non-Stationary −1.71 Non-Stationary −0.98 Non-stationary
    P −4.01 Non-Stationary −10.08 Non-Stationary −2.30 Non-stationary
    G −2.84 Non-Stationary −1.76 Non-Stationary −1.21 Non-stationary
    PI −4.96* StationaryI(0) −65.22* StationaryI(0) −1.11 Non-stationary
    V −3.61** StationaryI(0) −23.94* StationaryI(0) −2.67 Non-stationary
    T −10.67* StationaryI(0) −70.48* StationaryI(0) −2.13 Non-stationary
    Variables in the First Differenced Form ADF test statistic Results PP Test statistic Results DF-GLS test statistic Results
    TA −18.42* Stationary I(1) −144.37* Stationary (1) −11.45** Stationary I(1)
    IC −9.01* Stationary I(1) −143.26* Stationary (1) −26.17** Stationary (1)
    P −9.03* Stationary I(1) −114.50* Stationary (1) −4.49** Stationary I(1)
    G −5.10* Stationary I(1) −125.85* Stationary (1) −8.54** Stationary I(1)
    PI −17.81* Stationary I(1) −156.85* Stationary (1) −6.87** Stationary I(1)
    V −8.33* Stationary I(1) −64.17* Stationary (1) −9.32** Stationary I(1)
    T −10.99* Stationary I(1) −69.70* Stationary (1) −17.53** Stationary I(1)
    Critical values 1% −4.125% −3.4810% −3.17 1% −19.135% −13.4010% −10.77 Critical Values at 5% level of significance −3.05, Lags 4
    Critical values 1%
    5%
    10%
    −4.12
    −3.48
    −3.17
    1%
    5%
    10%
    −19.13
    −13.40
    −10.77
    Critical Values at 5% level of significance −3.05,
    Lags 4
    Note: (*), (**) and (***) denoted the level of significance of 1 per cent, 5 per cent and 10 per cent respectively.

     | Show Table
    DownLoad: CSV

    Zivot and Andrews unit root test with one structural break

    The standard unit root test tests like the Augmented Dickey-Fuller or Phillips-Perron and the DF-GLS do not explain the structural breaks in the series, Zivot and Andrews (1992) observe that the results of the conventional unit root test may change if there is an endogenous structural break in the series. Table 4 presents the results of the Zivot-Andrews unit root test. From the results of Table 4 we find that the variables are of order I(0) or I(1). Since none of the variables is of order I(2) we estimate the NARDL model subsequently.

    Table 4.  Zivot-Andrews test results: break in both intercept and trend.
    Variables at level TB k $ t $ Inference
    TA 2007Q3 2 −3.57 Unit root
    IC 1997Q3 2 −1.86 Unit root
    P 2007Q3 2 −6.96* I(0)
    G 1997Q4 2 −2.08 Unit root
    PI 2007Q3 2 −2.50 Unit root
    V 2007Q3 2 −5.40* I(0)
    T 2013Q1 2 −4.66*** I(0)
    Variables in their first difference
    TA 2019Q1 2 −8.83* I(1)
    IC 2008Q3 2 −6.98* I(1)
    P 2007Q1 2 −2.07 Unit root
    G 1997Q1 2 −11.02* I(1)
    PI 2007Q1 2 −9.34* I(1)
    V 2007Q3 2 −9.98* I(1)
    T 2002Q4 2 −24.27* I(1)
    Note: Critical values: 1%: −5.34 5%: −4.80 10%: −4.58. (*), (**) and (***) denoted the level of significance of 1 per cent, 5 per cent and 10 per cent respectively.

     | Show Table
    DownLoad: CSV

    Since none of the variables is of order I(2) we use the NARDL bounds test methodology for cointegration, to find the long-run relationship. The maximum lag order considered is 2, using Schwarz information criterion, based on the study of Pesaran and Shin (1998). Table 5 reports the bounds test of nonlinear cointegration (F-statistics) and the Table 6 sums the model estimation results. Table 5 explains that there is a long-run cointegrating relation between tourist arrivals, the income of the country of origin, prices, globalization, uncertainty, exchange rate volatility and temperature. The test statistic is 7.67 which is above the upper critical bound.

    Table 5.  Bounds test for nonlinear Cointegration.
    Dependent Variable F-Statistics 95% Lower Bound 95% Upper Bound Conclusion
    TA 7.67 4.42 6.25 Cointegration
    Notes: the critical values are found in Narayan (2005).

     | Show Table
    DownLoad: CSV
    Table 6.  Nonlinear ARDL estimation results.
    Dependent variable$ ∆{TA}_{t} $ Short Run Estimation Variables Coefficient t-Statistic Prob
    Constant 1.61** 4.75 0.00
    $ {TA}_{t-1} $ −0.26** −3.15 0.002
    $ {IC}_{t-1}^{+} $ 0.07** 2.30 0.02
    $ {IC}_{t-1}^{-} $ 0.03 −1.28 0.21
    $ {P}_{t-1}^{+} $ −0.07** −2.50 0.01
    $ {P}_{t-1}^{-} $ 0.08 1.24 0.24
    $ {G}_{t-1}^{+} $ 0.06 0.86 0.09
    $ {G}_{t-1}^{-} $ 0.06 0.28 0.77
    $ {PI}_{t-1}^{+} $ −0.34* −3.84 0.00
    $ P{I}_{t-1}^{-} $ 0.02 −0.92 0.07
    $ {V}_{t-1}^{+} $ −0.03 −2.54 0.22
    $ {V}_{t-1}^{-} $ 0.02 2.97 0.32
    $ {T}_{t-1}^{+} $ −0.01 −0.02 0.69
    $ {T}_{t-1}^{-} $ −0.005 −0.02 0.23
    $ {D1}^{2007} $Q3 −0.003** −3.21 0.02
    $ {D2}^{1997Q3} $ −0.01* −2.69 0.002
    $ {\Delta IC}_{t}^{+} $ 0.01 0.025 0.24
    $ {\Delta IC}_{t}^{-} $ −0.05 −0.027 −0.69
    $ {\Delta P}_{t}^{+} $ −0.02 −1.48 0.14
    $ {\Delta P}_{t}^{-} $ 0.03 0.42 0.67
    $ {\Delta G}_{t}^{+} $ 0.11 0.001 1.84
    $ {\Delta G}_{t}^{-} $ −0.09 0.07 −1.67
    $ {\Delta PI}_{t}^{+} $ −0.48 −0.69 0.49
    $ {\Delta PI}_{t}^{-} $ −0.0079 −0.99 0.32
    $ {\Delta V}_{t}^{+} $ −0.003 −1.19 0.06
    $ {\Delta V}_{t}^{-} $ 0.001 0.08 0.09
    $ {\Delta T}_{t}^{+} $ 0.05 1.58 0.11
    $ {\Delta T}_{t}^{-} $ 0.008 0.12 0.90
    Diagnostics Test
    ECMt-1 −0.63*
    R2 0.97
    J-B 1.68 0.43
    LM(1) 0.002 0.96
    LM(2) 0.37 0.54
    ARCH(1) 0.004 0.94
    ARCH(2) 0.52 0.76
    Notes: J-B denotes the Jarque-Bera test statistic for normality, LM(.) is the test for autocorrelation for lag order shown in (.) and ARCH(.) is the test for heteroscedasticity, up to the lag order shown in (.). (*), (**) and (***) denoted the level of significance of 1 per cent, 5 per cent and 10 per cent respectively. (+) and (-) superscripts indicate the positive and negative partial sums respectively (+) and (-) superscripts indicate the positive and negative partial sums respectively.

     | Show Table
    DownLoad: CSV

    Before analysing the asymmetric impact (both short-run and long-run) of COVID-19 induced uncertainty expressed through the newly formulated index (Discussion about Pandemics Index) on tourist arrivals alongside the other explanatory variables, we perform a series of diagnostic tests and parameter stability test for the robustness of our analysis, explained in Table 6 (lower panel). The Jarque-Bera (J-B) statistics show the test for normality, the Breusch-Godfrey correlation LM test statistic shows the autocorrelation test and Breusch Pagan-Godfrey (heteroskedasticity) statistic tests the ARCH LM tests. Parameters stability check is needed to check for the robustness of any statistical exploration, therefore Brown et al. (1975) CUSUM or CUSUMSQ parameters stability test is applied here. Figure 1 shows the parameter stability based on the CUSUM and CUSUMQ test. The results demonstrate that there is no violation of the standard assumptions of regression

    Figure 1.  CUSUM and CUSUM(Q) test on parameter stability.

    Before proceeding with the findings of our analysis, it would be useful to illustrate the implications of the coefficients based on the asymmetric parameters. For a significant positive coefficient for positive (negative) variations of an explanatory variable imply that when the explanatory variable rises (falls), the dependent variable tends to rise (fall). Again, for a significant negative coefficient for positive (negative) variations of the independent variable imply that when the explanatory variable increases (decreases), the dependent variable tends to fall (rise). Based on the results of Table (6) we find that in the short-run IC impacts positively and significantly upon TA but the negative impact is not significant, again for P the negative impact is not significant. Both for V and PI the asymmetric impact for both positive and negative change is significant in the short-run. One per cent rise in PI leads to a fall in tourist flows by 0.34 per cent again one per cent fall in uncertainty leads to a rise in tourist flows by 0.02 per cent. One per cent rise in exchange rate volatility leads to a fall in tourist flows by 0.03 again one per cent rise in exchange rate volatility leads to a rise in tourist flows by 0.02 per cent.

    The results of the long-term parameters are reported in Table 7. The baseline findings Table 7 puts forward that tourist arrivals are being affected by income, price, exchange rate volatility, globalization and COVID-19 uncertainty index namely PI, significantly and asymmetrically. One per cent rise (fall) in income leads to rising (fall) in tourist inflows by 0.067 (0.09) per cent. The largest impact on tourist arrivals come from uncertainty PI. One per cent rise in PI leads to a decline in tourism by 10 per cent while one per cent fall in uncertainty leads to a rise in tourist inflows by 0.22. So, the negative impact is higher than the positive impact implying the existence of asymmetric behaviour. The impact of the rise in per capita income on tourism is different from the impact due to the decline in income so the asymmetry is confirmed. Falling relative prices impact tourism more effectively than the rise in relative prices, verifying the high price elasticity behaviour of tourism. The negative impact on tourism due to one per cent fall in the globalization index is 0.15 per cent while rising globalization index by one per cent raises tourism demand by 0.06 per cent. Such a behaviour confirms the risk-averse nature of the majority of travellers. It is widely acknowledged in the tourism literature that the sector faces high flexibility in demand and is also vulnerable to shocks owing to war, pandemics and political uncertainty. The new globalized order implies that shocks have a whirlpool effect on the major economies and this makes tourism all the more vulnerable during downswings. The Wald test result reported in the lower panel of Table 7 confirm the asymmetric behaviour.2

    Table 7.  Long-run relations.
    Dependent variable $ ∆{TA}_{t} $ Variables Coefficient P-value
    Constant −1.86** 0.01
    $ {IC}^{+} $ 0.067** 0.00
    $ {IC}^{-} $ −0. 099* 0.029
    $ {P}^{+} $ −0.001** 0.024
    $ {P}^{-} $ 0.040* 0.00
    $ {G}^{+} $ 0.06** 0.02
    $ {G}^{-} $ −0.15** 0.00
    $ {PI}^{+} $ −0.10* 0.001
    $ {PI}^{-} $ 0.22* 0.002
    $ {V}^{+} $ −0.02** 0.01
    $ {V}^{-} $ 0.004** 0.03
    $ {T}^{+} $ −0.12** 0.001
    $ {T}^{-} $ −0.023* 0.04
    Symmetric Estimation
    $ {W}_{LRIC} $ 6.29** 0.007
    $ {W}_{LRP} $ 12.17** 0.004
    $ {W}_{LRG} $ 19.3** 0.00
    $ {W}_{LRPI} $ 4.67** 0.00
    $ {W}_{LRV} $ 260.0* 0.00
    $ {W}_{LRT} $ 11.28** 0.001
    Notes$ {: W}_{LRIC} $, $ {W}_{LRP}, {W}_{LRG}, {W}_{LRV}, {W}_{LRU}and{W}_{LRT} $ refer to the Wald test for long-run symmetry for the variables IC, P, G, V, PI and T. (*), (**) and (***) denoted the level of significance of 1 per cent, 5 per cent and 10 per cent respectively (+) and (-) superscripts indicate the positive and negative partial sums respectively.

     | Show Table
    DownLoad: CSV

    2 The short-run results for the Wald Test is not provided because they were found to be statistically insignificant implying there is no significant short-run asymmetry impact. Moreover, our focus is on the long-run behaviour.

    The response of tourist arrivals to uncertainty (COVID-19 induced) and other macro factors diverge subject to the stage of other economic actions. The nonlinear ARDL which takes into consideration the asymmetric connections between the variables helps in better understanding of the crucial role of uncertainty (COVID-19 induced) in conjunction to other macro variables in impacting tourist arrivals unlike the analysis based on the linear model. The key results put forward a nonlinear association between the variables. The results are indeed notable for some important reasons as enumerated below. First, we must not ignore that against the background of current economic situation tourist arrivals is not only impacted by COVID-19 induced uncertainty analyzed through the recently constructed index of Ahir et al. (2020) but it is also impacted by the feedback effect of other macro factors. The net effect on tourist arrivals depends on how the new uncertainty index impacts income, prices and exchange rate. With these considerations, a rise in uncertainty induced by the pandemic will not only harm consumers expectations but the consumers will have to function with reduced household incomes. This is the reflection of the deteriorating conditions of production which has major ramifications on tourism. Such findings confirm the works of Chong and Tong et al. (2020), Lanouar, & Goaied (2019), Novelli et al. (2018), Wang, (2009) and Tsai & Chen, (2010).

    Social distancing impacts functioning of restaurants, entertainment theatres and shopping malls all of which are significantly interlinked with travel. To be fair, policymakers themselves are confronted with high degrees of uncertainty. There is no precedent for a pandemic of this magnitude in modern times, and imposing public health measures (such as travel bans, border closures, prohibiting public events, and closing down businesses) entails complex trade-offs that are changing over time as contagion evolves. In such a situation a certain degree of policy uncertainty is inevitable.

    The economic agents which include firms and households are absolutely in a state of shock because they cannot understand what to expect from the government. Quarantine measures are creating a kind of wait and see approach which is also dampening economic activity. Smith (2006) observes that epidemic occurrences, for example, the SARS in 2003 had led to policies of public health management like quarantine, closures of establishments, which augmented individual’s uncertainty about economic policies. Beutels et al. (2009) discuss that in China the impact of SARS was indeed considerable for sectors like hospitality and leisure, international air travel and tourism during the third quarter of the outbreak but it had a substantial long-term impact. Such findings confirm the analysis obtained from the present study.

    Complementary macro-economic policy guidelines can help to reinstate confidence levels among travellers and this would facilitate in the revival of tourism demand as the curve of the COVID-19 contagion flattens. Since tourism is dependent upon the state of affairs of other competing economies the adverse consequences of the pandemic are strongly felt. The widespread fall in international travel has percolated into the financial markets. Such behaviour is enhancing the risk aversion nature of consumers which in the long-run lowers the consumer confidence. A downfall in the consumer confidence has a negative feedback impact on economic growth. In comparison to the negative impact of the SARS epidemic, the situation at present is graver because the global chain of integration has expanded. This heightens the negative spill-over impacts. China being a major player as far the contribution in global output is concerned, the adverse shock wave from China is augmenting the risks in trade and travel industry.

    In the long-run improvement in household spending behaviour will positively impact tourism however the net impact depends on the rate of new job creation and productivity gains. As of now, uncertainty impact will keep investment opportunities particularly in the tourism sector feeble and this will constrain overall expansion of the economy.

    This paper explored the impact of COVID-19 pandemic induced uncertainty through the new index “Discussion about Pandemics Index (PI)” conceptualized by Baker et al. (2020) and the methodology developed by Ahir et al. (2018) and Ahir et al. (2020) on international tourist arrivals in Australia from China based on the nonlinear autoregressive distributed lag model postulated by Shin et al. (2014). This is the newly generated version of the World economic Uncertainty Index is adapted to encapsulate the pandemic impact, Ahir et al. (2020) by calculating the per cent of the words related to pandemic episodes in the Economist Intelligence Unit country reports. The period of observations run from 1996 Q1 to 2020Q1. For wide-ranging understanding the importance of major control variables widely used in the tourism literature has been incorporated for example income, relative prices, exchange rate volatility, index of globalization and temperature differences to proxy climatic impact. The major outcome of this study confirms the results of previous studies which have utilized EPU as an explanatory variable to explain the demand for tourism. One per cent rise in uncertainty induced by pandemics expressed through the index PI leads to a decline in tourism by 10 per cent while one per cent decline leads to a rise in tourism by 0.22 per cent. The impact of the positive change of the uncertainty index expressed through PI is more pervading than the impact of the negative change so the asymmetric behaviour is confirmed. The results of the Wald Test confirm the long-run asymmetric association between tourism, income, relative price, uncertainty, exchange rate volatility, globalization and climatic conditions. To encapsulate, the COVID-19 pandemic has generated huge shock waves of uncertainty which may be similar to the level of uncertainty witnessed during the periods of the Great Depression. Our study implies that the shrinkage in tourism demand in the recent times is largely due to the pandemic because it creates “the quarantine economy” that stops mobility, raises public concern on health and keeps people indoors.

    Travel agents raise serious questions whether in the short-run local tourism will reopen. The situation is indeed grave because of the method of social-distancing. The period around the end of 2020 predicts downfall of the tourism sector by 60 to70 per cent. However, there may be variations depending on the gradualism of reopening the international borders. The situation of decline may not be so grimed if travel restrictions are gradually lifted in July however if restrictions continue till December then we are indeed facing a tough scenario.

    As travelling raises the chances of the susceptibility of infection the travel restrictions are imposed in all countries. The strict government orders have generated fear among consumers which will exacerbate uncertainty in travelling in the long-run. Moreover, from the supply-side perspective, there may dearth of hospitality services over the short to medium period because many tourist employees particularly related to wellness tourism are working in the capacity of temporary health workers. This may raise prices of tourism services. So, one can assume a kind of negative association between health care and tourism. The household utility function is dependent on the total consumption of goods and services of which consumption for health is an important determinant. As health deteriorates there is the substitution effect of expenditure from other consumables. Tourism being highly elastic in demand may be substituted for raising health care benefits. The government of Australia needs to put efforts to boost tourism in the post-crisis period so that the sector sees quick recovery, subsidy for tourists may be generated this will crowd-in investment to tourism ancillary industries. For all-inclusive policy implications, the government needs to put efforts to rebuild the health status of the nation along with subsidizing tourism. Such policy instances will raise the overall welfare of the households because tourism expansion will boost employment which will raise income and hence consumption.


    Limitations of the study


    The shortcoming of the study is its inability to discuss how intersectoral behaviour may impact the tourism industry. Tourism is linked to several key sectors like agriculture, infrastructure development and ancillary services like the travel and hotel sector, perhaps the impact of interlinkages will throw greater understanding on how uncertainty due to pandemic effects tourism. Owing to the paucity of data such investigation could not be generated. The study has not delved into the role of entrepreneurship in tourism to revive confidence among travellers owing to lack of dense time-series data. However, this indeed leaves further scope for research. In sum, a broad socioeconomic policy planning is required to include related sectors of tourism so that business houses can evaluate the role of the risks amidst the pandemic.

    Valuable comments of two anonymous referees are greatly appreciated. Remaining shortcomings, however, is mine.

    The author declares no conflict of interest in this paper.

    All data sets are available in the domain figshare: https://figshare.com/s/003efbd1db90a65ff3bb.


    Abbreviation CaMKII: calcium calmodulin kinase II; cAMP/PK: cyclic adenosine monophosphate/protein kinase; DBS: deep brain stimulation; FOG: freezing of gait; PD: Parkinson's disease; PPN: pedunculopontine nucleus; RAS: reticular activating system; REM: rapid eye movement;
    Acknowledgments


    Supported by NIH award P30 GM110702 from the IDeA program at NIGMS to the CTN. This work was also supported by the University of Arkansas Clinician Scientist Program award (to Dr. Virmani). In addition, this work was supported by grants from FONCYT-Agencia Nacional de Promoción Científica y Tecnológica; Préstamo BID 1728 OC.AR. PICT-2016-1728 (to Dr. Urbano); FONCYT-Agencia Nacional de Promoción Científica y Tecnológica; Préstamo BID 1728 OC.AR. PICT 2015-2594 (to Dr. Bisagno).

    Conflict of interest


    The authors certify that they have no affiliations with or involvement in any organization or entity with any financial interest, or non-financial interest in the subject matter or materials discussed in this manuscript.
    All of the published studies referred to from our labs secured UAMS institutional review board (IRB) permission for human studies or institutional animal care (IACUC) approval for all animal studies prior to the performance of experiments.
    None of the published studies referred to from our labs required public registration.
    The authors declare no conflict of interest.

    [1] Garcia-Rill E (1986) The basal ganglia and the locomotor regions. Brain Res 11: 47–63. doi: 10.1016/0165-0173(86)90009-3
    [2] Garcia-Rill E (1991) The pedunculopontine nucleus. Prog Neurobiol 36: 363–389. doi: 10.1016/0301-0082(91)90016-T
    [3] Aziz TZ, Davies J, Stein J, et al. (1998) The role of descending basal ganglia connections to the brain stem in Parkinsonian akinesia. Brit J Neurosurg 12: 245–249. doi: 10.1080/02688699845078
    [4] Garcia-Rill E, Mahaffey S, Hyde JR, et al. (2019) Bottom-up gamma maintenance in various disorders. In: Neurobiology of Disease: Pedunculopontine Nucleus Deep Brain Stimulation. Neurobiol Dis 128: 31–39.
    [5] Ferraye MU, Debu B, Fraix V, et al. (2010) Effects of pedunculopontine nucleus area stimulation on gait disorders in Parkinson's disease. Brain 133: 205–214. doi: 10.1093/brain/awp229
    [6] Mazzone P, Sposato S, Insola A, et al. (2008) Stereotactic surgery of nucleus tegmenti pedunculopontine [corrected]. Brit J Neurosurg 22: S33–S40. doi: 10.1080/02688690802448327
    [7] Moro E, Hamani C, Poon YY, et al. (2010) Unilateral pedunculopontine stimulation improves falls in Parkinson's disease. Brain 133: 215–224. doi: 10.1093/brain/awp261
    [8] Thevanasathan W, Silburn PA, Brooker H, et al. (2010) The impact of low-frequency stimulation of the pedunculopontine nucleus region on reaction time in Parkinsonism. J Neurol Neurosurg Psychiat 81: 1099–1104. doi: 10.1136/jnnp.2009.189324
    [9] Thevanasathan W, Cole MH, Grapel Cl, et al. (2012) A spatiotemporal analysis of gait freezing and the impact of pedunculopontine nucleus stimulation. Brain 135: 1446–1454. doi: 10.1093/brain/aws039
    [10] Vitale F, Capozzo A, Mazzone P, et al. (2019) Nweurophysiology of the pedunculopontine tegmental nucleus. Neurobiol Dis 128: 19–30. doi: 10.1016/j.nbd.2018.03.004
    [11] Costa A, Carlesimo GA, Caltagirone C, et al. (2010) Effects of deep brain stimulation of the peduncolopontine area on working memory tasks in patients with Parkinson's disease. Parkinsonism Relat Disord 16: 64–67. doi: 10.1016/j.parkreldis.2009.05.009
    [12] Lim AS, Moro E, Lozano A, et al. (2009) Selective enhancement of rapid eye movement sleep by deep brain stimulation of the human pons. Ann Neurol 66: 110–114. doi: 10.1002/ana.21631
    [13] Peppe A, Pierantozzi M, Baiamonte V, et al. (2012) Deep brain stimulation of pedunculopontine tegmental nucleus: role in sleep modulation in advanced Parkinson disease patients: one-year follow-up. Sleep 35: 1637–1642. doi: 10.5665/sleep.2234
    [14] Zanini S, Moschella V, Stefani A, et al. (2009) Grammar improvement following deep brain stimulation of the subthalamic and the pedunculopontine nuclei in advanced Parkinson's disease: a pilot study. Parkinsonism Relat Disord 15: 606–609. doi: 10.1016/j.parkreldis.2008.12.003
    [15] Stefani A, Pierantozzi M, Ceravolo R, et al. (2010) Deep brain stimulation of pedunculopontine tegmental nucleus (PPTg) promotes cognitive and metabolic changes: A target-specific effect or response to a low-frequency pattern of stimulation? Clin EEG Neurosci 41: 82–86. doi: 10.1177/155005941004100207
    [16] Fahn S (1995) The freezing phenomenon in parkinsonism. Adv Neurol 67: 53–63.
    [17] Schaafsma JD, Balash Y, Gurevich T, et al. (2003) Characterization of freezing of gait subtypes and the response of each to levodopa in Parkinson's disease. Eur J Neurol 10: 391–398. doi: 10.1046/j.1468-1331.2003.00611.x
    [18] Okuma Y, Silva de Lima AL, Fukae J, et al. (2018) A prospective study of falls in relation to freezing of gait and response fluctuations in Parkinson's disease. Parkinsonism Relat Disord 46: 30–35. doi: 10.1016/j.parkreldis.2017.10.013
    [19] Bloem BR, Hausdorff JM, Visser JE, et al. (2004) Falls and freezing of gait in Parkinson's disease: A review of two interconnected, episodic phenomena. Mov Disord 19: 871–884. doi: 10.1002/mds.20115
    [20] Johnell O, Melton LJ 3rd, Atkinson EJ, et al. (1992) Fracture risk in patients with parkinsonism: A population-based study in Olmsted County, Minnesota. Age Ageing 21: 32–38. doi: 10.1093/ageing/21.1.32
    [21] Adkin AL, Frank JS, Jog MS (2003) Fear of falling and postural control in Parkinson's disease. Mov Disord 18: 496–502. doi: 10.1002/mds.10396
    [22] Walton CC, Shine JM, Hall JM, et al. (2015) The major impact of freezing of gait on quality of life in Parkinson's disease. J Neurol 262: 108–115. doi: 10.1007/s00415-014-7524-3
    [23] Giladi N, McDermott MP, Fahn S, et al. (2001) Freezing of gait in PD: prospective assessment in the DATATOP cohort. Neurology 56: 1712–1721. doi: 10.1212/WNL.56.12.1712
    [24] Virmani T, Moskowitz CB, Vonsattel JP, et al. (2015) Clinicopathological characteristics of freezing of gait in autopsy-confirmed Parkinson's disease. Mov Disord 30: 1874–1884. doi: 10.1002/mds.26346
    [25] Espay AJ, Fasano A, van Nuenen BF, et al. (2012) "On" state freezing of gait in Parkinson disease: A paradoxical levodopa-induced complication. Neurology 78: 454–457. doi: 10.1212/WNL.0b013e3182477ec0
    [26] Nieuwboer A, Giladi N (2013) Characterizing freezing of gait in Parkinson's disease: models of an episodic phenomenon. Mov Disord 28: 1509–1519. doi: 10.1002/mds.25683
    [27] Plotnik M, Giladi N, Hausdorff JM (2012) Is freezing of gait in Parkinson's disease a result of multiple gait impairments? Implications for treatment. Parkinsons Dis 2012: 459321.
    [28] Lewis SJ, Barker RA (2009) A pathophysiological model of freezing of gait in Parkinson's disease. Parkinsonism Relat Disord 15: 333–338. doi: 10.1016/j.parkreldis.2008.08.006
    [29] Vandenbossche J, Deroost N, Soetens E, et al. (2012) Freezing of gait in Parkinson's disease: disturbances in automaticity and control. Front Hum Neurosci 6: 356.
    [30] Jacobs JV, Nutt JG, Carlson-Kuhta P, et al. (2009) Knee trembling during freezing of gait represents multiple anticipatory postural adjustments. Exp Neurol 215: 334–341. doi: 10.1016/j.expneurol.2008.10.019
    [31] Shah J, Pillai L, Williams DK, et al. (2018) Increased foot strike variability in Parkinson's disease patients with freezing of gait. Parkinsonism Relat Disord 53: 58–63. doi: 10.1016/j.parkreldis.2018.04.032
    [32] Virmani T, Pillai L, Glover A, et al. (2018) Impaired step-length setting prior to turning in Parkinson's disease patients with freezing of gait. Mov Disord 33: 1823–1825. doi: 10.1002/mds.27499
    [33] Nantel J, McDonald JC, Tan S, et al. (2012) Deficits in visuospatial processing contribute to quantitative measures of freezing of gait in Parkinson's disease. Neuroscience 221: 151–156. doi: 10.1016/j.neuroscience.2012.07.007
    [34] Amboni M, Cozzolino A, Longo K, et al. (2008) Freezing of gait and executive functions in patients with Parkinson's disease. Mov Disord 23: 395–400. doi: 10.1002/mds.21850
    [35] Braak H, Del Tredici K, Rub U, et al. (2003) Staging of brain pathology related to sporadic Parkinson's disease. Neurobiol Aging 24: 197–211. doi: 10.1016/S0197-4580(02)00065-9
    [36] Garcia-Rill E (2015) Waking and the Reticular Activating System in Health and Disease, New York: Elsevier, 313.
    [37] Moruzzi G, Magoun HW (1949) Brain stem reticular formation and activation of the EEG. Electroenceph Clin Neurophysiol 1: 455–473. doi: 10.1016/0013-4694(49)90219-9
    [38] Steriade M (1999) Cellular substrates of oscillations in corticothalamic systems during states of vigilance, In: Lydic R, Baghdoyan HA, Editors, Handbook of Behavioral State Control. Cellular and molecular mechanisms, New York: CRC Press, 327–347.
    [39] Datta S, Siwek DF (2002) Single cell activity patterns of pedunculopontine tegmentum neurons across the sleep-wake cycle in the freely moving rats. J Neurosci Res 70: 79–82.
    [40] Shik ML, Severin FV, Orlovskii GN (1966) Control of walking and running by means of electric stimulation of the midbrain. Biofizika 11: 659–666.
    [41] Garcia-Rill E, Houser C, Skinner RD, et al. (1987) Locomotion-inducing sites in the vicinity of the pedunculopontine nucleus. Brain Res Bull 18: 731–738. doi: 10.1016/0361-9230(87)90208-5
    [42] Garcia-Rill E, Skinner D (1988) Modulation of rhythmic function in the posterior midbrain. Neurosci 17: 639–654.
    [43] Skinner RD, Garcia-Rill E (1990) Brainstem modulation of rhythmic functions and behaviors, In: Klemm WR, Vertes RP, Editors, Brainstem Mechanisms of Behavior, New York: John Wiley & Sons, 419–445.
    [44] Garcia-Rill E, Skinner RD, Fitzgerald JA (1985) Chemical activation of the mesencephalic locomotor region. Brain Res 330: 43–54. doi: 10.1016/0006-8993(85)90006-X
    [45] Garcia-Rill E, Skinner RD, Fitzgerald JA (1983) Activity in the mesencephalic locomotor region during locomotion. Exptl Neurol 82: 606–622.
    [46] Kobayashi T, Good C, Biedermann J, et al (2004) Developmental changes in pedunculopontine nucleus (PPN) neurons. J Neurophysiol 91: 1470–1481. doi: 10.1152/jn.01024.2003
    [47] Reese NB, Garcia-Rill E, Skinner RD (1995) The pedunculopontine nucleus-auditory input, arousal and pathophysiology. Prog Neurobiol 47: 105–133. doi: 10.1016/0301-0082(95)00023-O
    [48] Wang HL, Morales M (2009) Pedunculopontine and laterodorsal tegmental nuclei contan distinct populations of cholinergic, glutamatergic and GABAergic neurons in the rat. Eur J Neurosci 29: 340–358. doi: 10.1111/j.1460-9568.2008.06576.x
    [49] Simon C, Kezunovic N, Ye M, et al. (2010) Gamma band unit activity and population responses in the pedunculopontine nucleus (PPN). J Neurophysiol 104: 463–474. doi: 10.1152/jn.00242.2010
    [50] Kezunovic N, Urbano FJ, Simon C, et al. (2011) Mechanism behind gamma band activity in the pedunculopontine nucleus (PPN). Eur J Neurosci 34: 404–415. doi: 10.1111/j.1460-9568.2011.07766.x
    [51] Luster B, D'Onofrio S, Urbano FJ, et al. (2015) High-Threshold Ca2+ channels behind gamma band activity in the pedunculopontine nucleus (PPN). Physiol Rep 3: e12431. doi: 10.14814/phy2.12431
    [52] Luster B, Urbano FJ, Garcia-Rill E (2016) Intracellular mechanisms modulating gamma band activity in the pedunculopontine nucleus (PPN). Physiol Rep 4: e12787. doi: 10.14814/phy2.12787
    [53] D'Onofrio S, Kezunovic N, Hyde JR, et al. (2015) Modulation of gamma oscillations in the pedunculopontine nucleus (PPN) by neuronal calcium sensor protein-1 (NCS-1): relevance to schizophrenia and bipolar disorder. J Neurophysiol 113: 709–719. doi: 10.1152/jn.00828.2014
    [54] D'Onofrio S, Urbano FJ, Mesias E, et al. (2016) Lithium decreases the effects of neuronal calcium sensor protein 1 in pedunculopontine neurons. Physiol Rep 4: e12740. doi: 10.14814/phy2.12740
    [55] Garcia-Rill E, Kezunovic N, D'Onofrio S, et al. (2014) Gamma band activity in the RAS- intracellular mechanisms. Exptl Brain Res 232: 1509–1522. doi: 10.1007/s00221-013-3794-8
    [56] Lai Y-Y, Siegel JM (1991) Pontomedullary glutamate receptors mediating locomotion and muscle tone suppression. J Neurosci 11: 2931–2937. doi: 10.1523/JNEUROSCI.11-09-02931.1991
    [57] Takakusaki K, Habaguchi T, Ohtinata-Sugimoto J, et al. (2003) Basal ganglia efferents to the brainstem centers controlling postural muscle tone and locomotion: A new concept for understanding motor disorders in basal ganglia dysfunction. Neuroscience 119: 293–308. doi: 10.1016/S0306-4522(03)00095-2
    [58] Ricciardi L, Sarchioto M, Morgante F (2019) Role of pedunculopontine nucleus in sleep-wake cycle and cognition in humans: A systematic review of DBS studies. Neurobiol Dis 128: 53–58. doi: 10.1016/j.nbd.2019.01.022
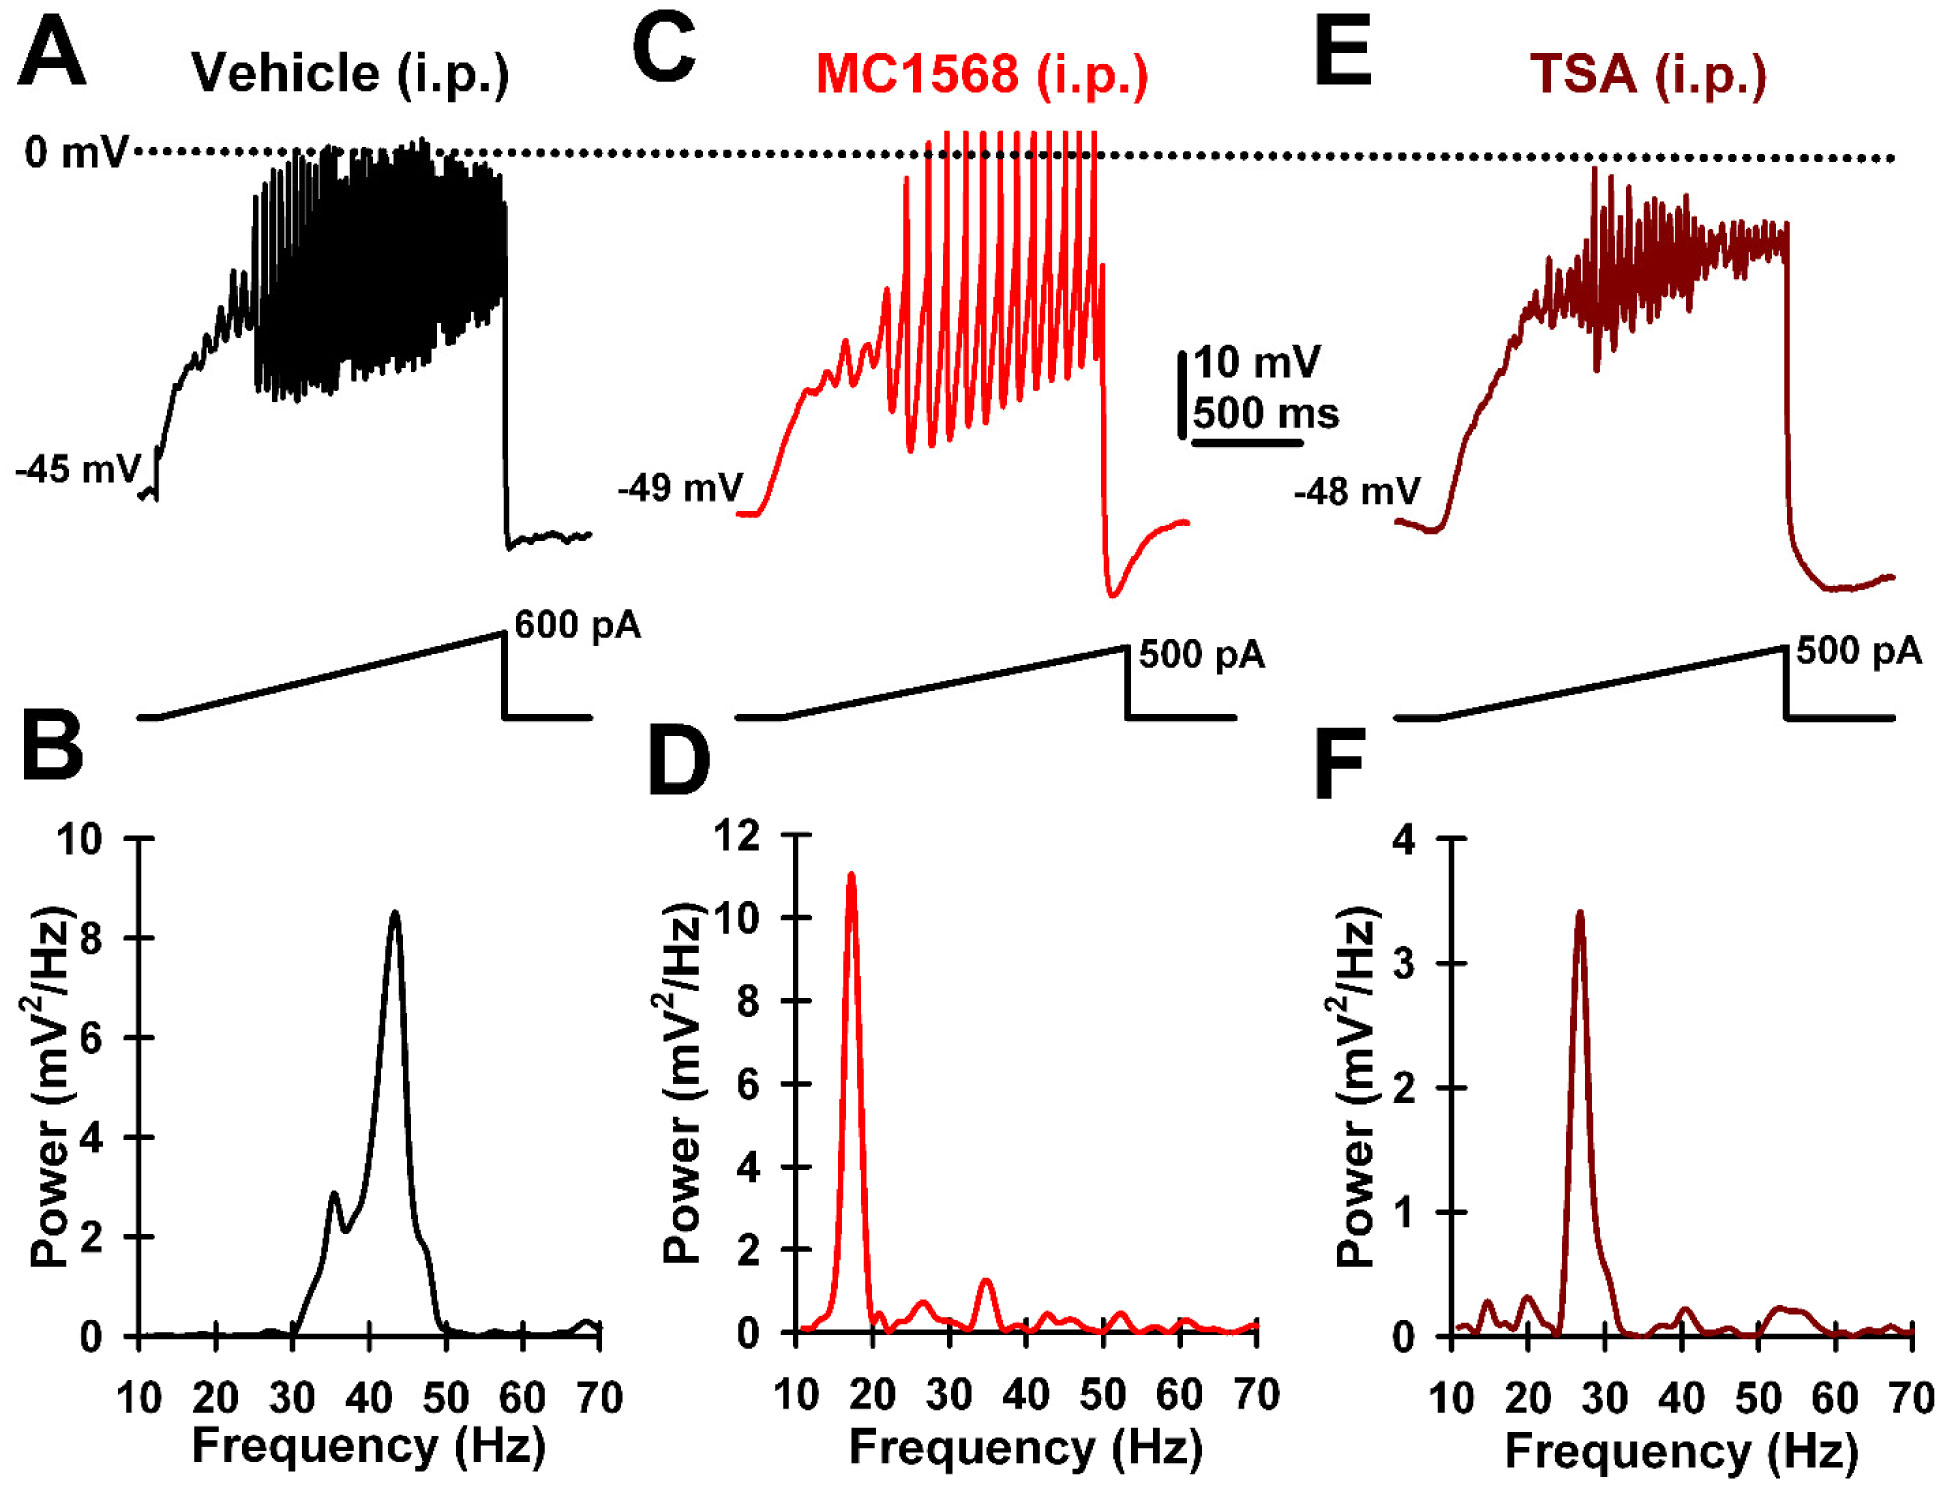
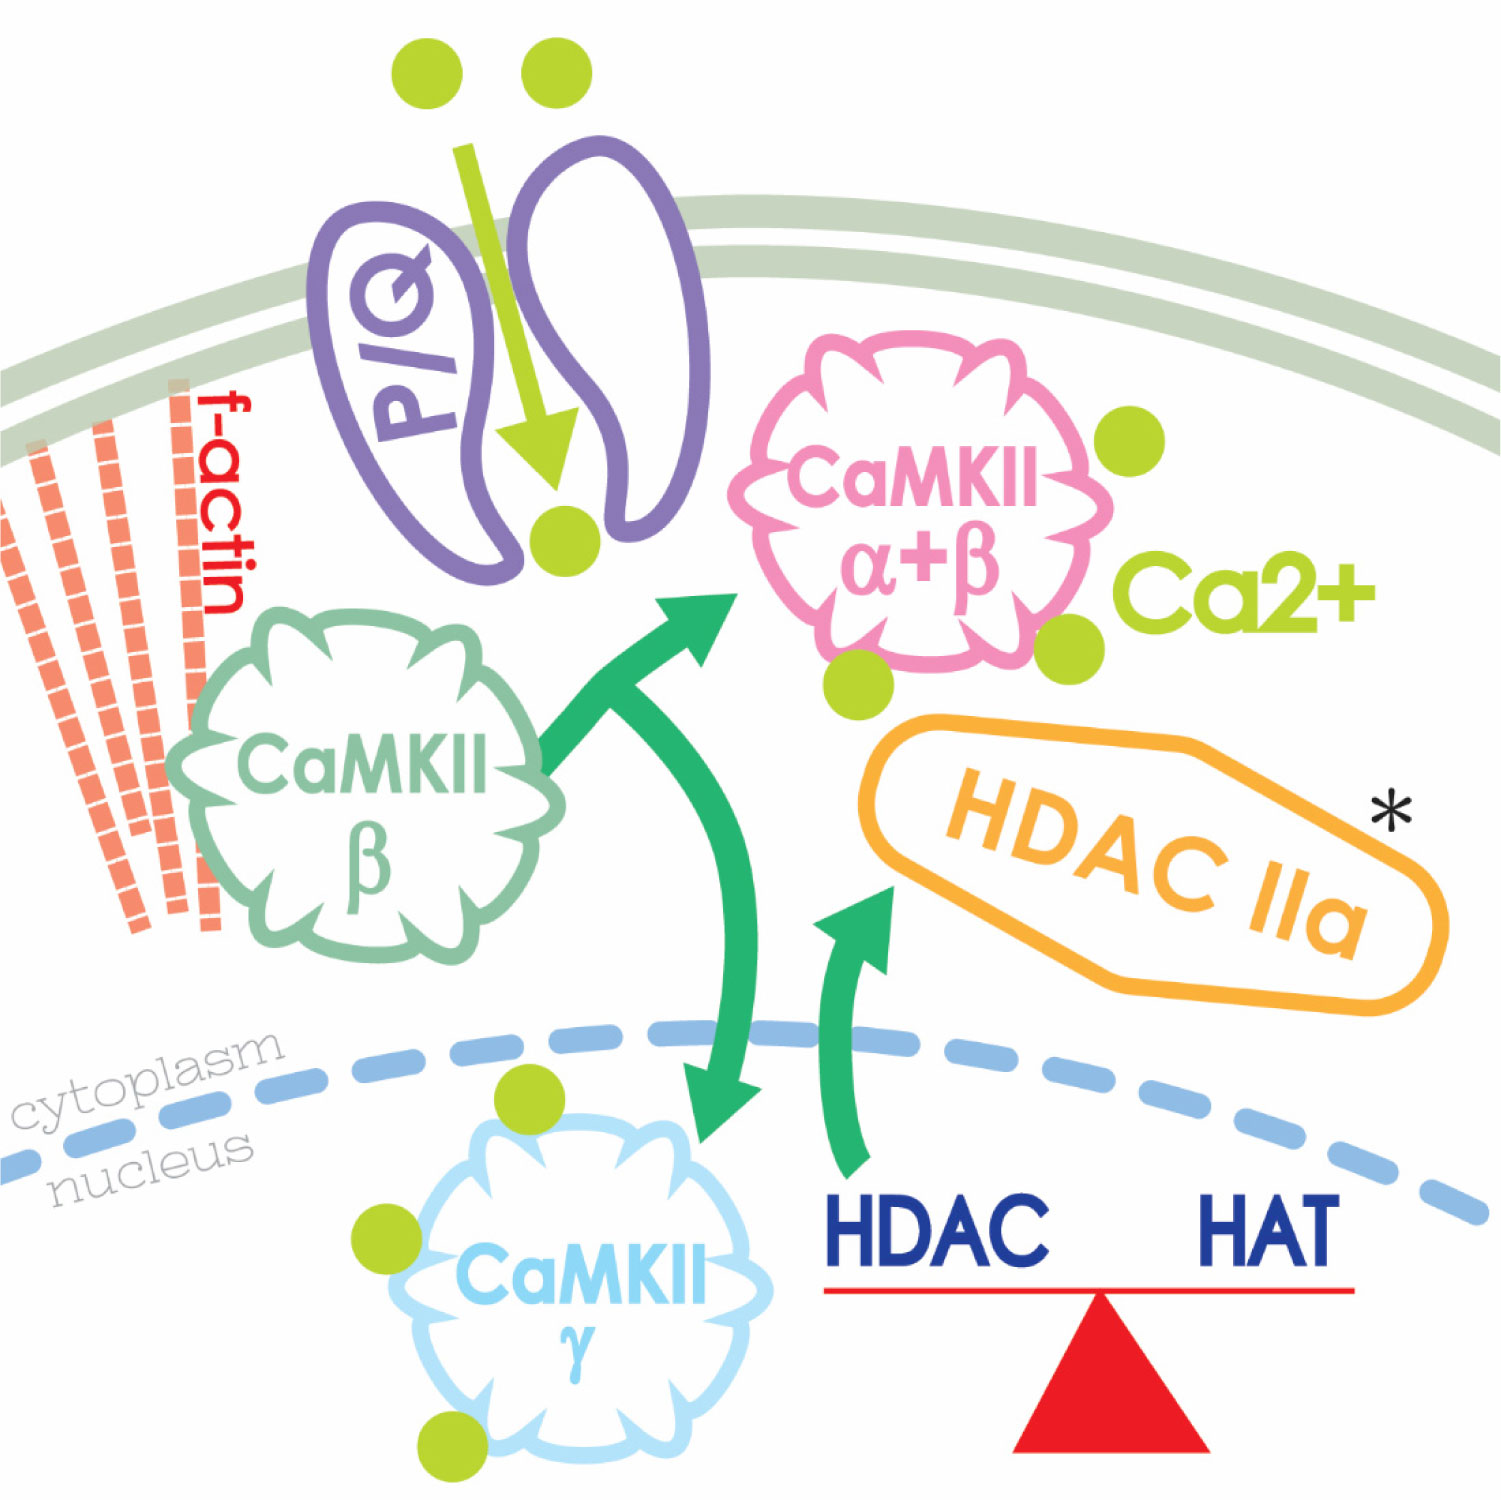
    [59] Urbano FJ, Bisagno V, Mahaffey S, et al. (2018) Class II histone deacetylases require P/Q-type Ca2+ channels and CaMKII to maintain gamma oscillations in the pedunculopontine nucleus. Nature Sci Rep 8: 13156.
    [60] Urbano FJ, Bisagno V, Garcia-Rill E (2019) Neuroepigenetic control of gamma oscillations in the pedunculopontine nucleus: From HDACs to F-actin. Abstract #P-08-0375. International Brain Research Organization (IBRO) Meeting, Daegu, Korea.
    [61] Garcia-Rill E, Tackett AJ, Byrum SD, et al. (2019) Local and relayed effects of deep brain stimulation of the pedunculopontine nucleus. Brain Sci 9: E64. doi: 10.3390/brainsci9030064
    [62] Byrum S, Washam C, Tackett A, et al. (2019) Proteomic measures of gamma oscillations. Heliyon 5: e02265. doi: 10.1016/j.heliyon.2019.e02265
    [63] Garcia-Rill E, Charlesworth A, Heister D, et al. (2008) The developmental decrease in REM sleep: The role of transmitters and electrical coupling. Sleep 31: 673–690. doi: 10.1093/sleep/31.5.673
    [64] Choudhary C, Kumar C, Gnad F, et al. (2009) Lysine acetylation targets protein complexes and co-regulates major cellular functions. Science 325: 834–840. doi: 10.1126/science.1175371
  • This article has been cited by:

    1. Yasemin KORKUT, Mert EKER, Feyyaz ZEREN, Remzi ALTUNIŞIK, THE IMPACT OF COVID-19 PANDEMIC ON TOURISM: AN APPROACH ON BORSA İSTANBUL TOURISM INDICES, 2020, 1303-0094, 10.21547/jss.774557
    2. Gizem Uzuner, Sudeshna Ghosh, Do pandemics have an asymmetric effect on tourism in Italy?, 2020, 0033-5177, 10.1007/s11135-020-01074-7
    3. Valentinas Navickas, Rima Kontautiene, Jurgita Stravinskiene, Yuriy Bilan, Paradigm shift in the concept of corporate social responsibility: COVID-19, 2021, 3, 2643-1092, 138, 10.3934/GF.2021008
    4. Hafiz Suliman Munawar, Sara Imran Khan, Fahim Ullah, Abbas Z. Kouzani, M. A. Parvez Mahmud, Effects of COVID-19 on the Australian Economy: Insights into the Mobility and Unemployment Rates in Education and Tourism Sectors, 2021, 13, 2071-1050, 11300, 10.3390/su132011300
    5. Safaa Hamada, Ahmed Ghodieh, 2023, Chapter 77, 978-3-031-10211-0, 937, 10.1007/978-3-031-10212-7_77
    6. Shuanglian Chen, Junhao Zhong, Pierre Failler, Does China transmit financial cycle spillover effects to the G7 countries?, 2022, 35, 1331-677X, 5184, 10.1080/1331677X.2021.2025123
    7. Jun Wen, Samia Khalid, Hamid Mahmood, Xiuyun Yang, Economic policy uncertainty and growth nexus in Pakistan: a new evidence using NARDL model, 2022, 55, 1573-9414, 1701, 10.1007/s10644-021-09364-2
    8. Ting Tan, Jianping Zha, Jianying Tang, Rong Ma, Wenjia Li, Spatial-temporal disparities in the impact of the coronavirus disease 2019 on domestic tourism demand: A study of Emeishan National Park in Mainland China, 2022, 28, 1356-7667, 261, 10.1177/13567667211053385
    9. Hélder da Silva Lopes, Paula C. Remoaldo, Vitor Ribeiro, Javier Martín-Vide, Effects of the COVID-19 Pandemic on Tourist Risk Perceptions—The Case Study of Porto, 2021, 13, 2071-1050, 6399, 10.3390/su13116399
    10. Ayşe ERGİN ÜNAL, Filiz YETİZ, Aynur SÜSAY, The Impact of COVID-19 on Industrial, Banking, and Tourism Indexes, 2022, 6, 2564-7504, 278, 10.25295/fsecon.1013123
    11. Ştefan Cristian Gherghina, Liliana Nicoleta Simionescu, Exploring the asymmetric effect of COVID-19 pandemic news on the cryptocurrency market: evidence from nonlinear autoregressive distributed lag approach and frequency domain causality, 2023, 9, 2199-4730, 10.1186/s40854-022-00430-w
    12. Giray Gozgor, Neelu Seetaram, Chi Keung Marco Lau, Effect of global uncertainty on international arrivals by purpose of visits and length of stay, 2021, 23, 1099-2340, 1086, 10.1002/jtr.2464
    13. Ömer Faruk TAN, Hakan CAVLAK, Yasin CEBECİ, Necati GÜNEŞ, CAN HIGH DIVIDEND YIELD SUSTAIN FIRM VALUE DURING THE COVID-19 CRASH? EVIDENCE FROM TURKISH FIRMS, 2021, 2148-029X, 10.11611/yead.915018
    14. Wanhai You, Yuming Huang, Chien‐Chiang Lee, Forecasting tourist flows in the COVID‐19 era using nonparametric mixed‐frequency VARs, 2023, 0277-6693, 10.1002/for.3044
    15. Muhammad Umer Arshad, Qiao Shao Hui, Gong Yufei, Guo Xinya, Lin Haiying, Baoyin Dureng, The role of heritage sites and other influential factors in domestic tourism inflow to Australian states: a gravity model approach, 2024, 27, 1368-3500, 1477, 10.1080/13683500.2023.2213880
    16. Shuping Zhang, Rural Tourism Development Planning Based on Nonlinear Differential Equation, 2023, 8, 2444-8656, 1621, 10.2478/amns.2023.1.00128
    17. Jin Zhao, Emine Kaya, Kishwar Ali, Cosimo Magazzino, Abdulkadir Barut, The Asymmetric Effect of Foreign Ownership and Concentration on Financial Dollarization: The Case of the Turkish Economy, 2024, 1868-7873, 10.1007/s13132-024-02326-9
    18. Francisca Mendonça Souza, Claudia Aline de Souza Ramser, Adriano Mendonça Souza, Claudimar Pereira da Veiga, Spillover Effects in the Presence of Structural Breaks, Persistence and Conditioned Heteroscedasticity, 2023, 18, 2010-4952, 10.1142/S2010495222500348
    19. Dimitrios Belias, Ioannis Rossidis, Angelos Ntalakos, Nikolaos Trihas, 2023, chapter 5, 9781668460559, 77, 10.4018/978-1-6684-6055-9.ch005
    20. Woraphon Yamaka, Xuefeng Zhang, Paravee Maneejuk, Vicente Ramos, Asymmetric effects of third-country exchange rate risk: A Markov switching approach, 2023, 103, 01607383, 103676, 10.1016/j.annals.2023.103676
    21. Ömer Faruk TAN, The Impact of News about Pandemic on Borsa Istanbul during the COVID-19 Financial Turmoil, 2021, 2630-6220, 109, 10.17829/turcom.859299
    22. Gour Gobinda Goswami, Meshbaul Hassan Chowdhury, Mostafizur Rahman, Mahnaz Aftabi Atique, Australian Tourist Flow: A Gravity Model Approach, 2024, 16, 2071-1050, 5740, 10.3390/su16135740
  • Reader Comments
  • © 2019 the Author(s), licensee AIMS Press. This is an open access article distributed under the terms of the Creative Commons Attribution License (http://creativecommons.org/licenses/by/4.0)
通讯作者: 陈斌, bchen63@163.com
  • 1. 

    沈阳化工大学材料科学与工程学院 沈阳 110142

  1. 本站搜索
  2. 百度学术搜索
  3. 万方数据库搜索
  4. CNKI搜索

Metrics

Article views(5363) PDF downloads(501) Cited by(7)

Figures and Tables

Figures(3)

/

DownLoad:  Full-Size Img  PowerPoint
Return
Return

Catalog