
D-pinitol is a natural compound related to the important family of inositols. It can be found and isolated from many plants, being the active component of ayurvedic remedies such as Talisa patra (Abies webbiana, A. pindrow) or antidiabetic as Bougainvillea (Bougainvillea spectabilis). Although many synthetic and semi-synthetic methods have been reported for D-pinitol and its derivatives, through chemical and biochemical transformations, Ceratonia siliqua L. (Carob), a Mediterranean tree now in decline, known because of its environmental advantages, is the only raw material from which D-pinitol can be isolated in quantities enough for a viable commercial exploitation. Fortunately, the pharmacological interest in this compound has risen enormously in the last years owing to their established multifunctional properties through a variety of signalling pathways: ⅰ) anti-cancer, through inhibition of TNF-ᾳ and suppression of NF-ⱪB pathway; ⅱ) insulinomimetic and metabolic regulator in type 2 diabetes mellitus, via a post-receptor pathway of insulin action; ⅲ) antioxidant; ⅳ) hepatoprotective; ⅴ) immuno-modulator, balancing Th1/Th2 cytokines; ⅵ) osteoporosis preventive, through p38/JNK and NF-ⱪB pathways; ⅶ) anti-aging, via reduction of the insulin/IGF-1 signaling (IIS) pathway; ⅷ) improver of creatine retention; ⅸ) preventive and ameliorative of Alzheimer's disease through selective g-secretase modulation.
Thus, the present review compress the literature reported to date in relation to the health-promoting effects and metabolic pathways of this naturally occurring super-food ingredient and its derivatives, providing an extensive guide for a future utilization of all of its potentialities, aiming a positive impact in the promotion and recovery of carob crops.
Citation: JoséIgnacio López-Sánchez, Diego A. Moreno, Cristina García-Viguer. D-pinitol, a highly valuable product from carob pods: Health-promoting effects and metabolic pathways of this natural super-food ingredient and its derivatives[J]. AIMS Agriculture and Food, 2018, 3(1): 41-63. doi: 10.3934/agrfood.2018.1.41
[1] | Ya'nan Wang, Sen Liu, Haijun Jia, Xintao Deng, Chunpu Li, Aiguo Wang, Cuiwei Yang . A two-step method for paroxysmal atrial fibrillation event detection based on machine learning. Mathematical Biosciences and Engineering, 2022, 19(10): 9877-9894. doi: 10.3934/mbe.2022460 |
[2] | Miao Zhu, Tao Yan, Shijie Zhu, Fan Weng, Kai Zhu, Chunsheng Wang, Changfa Guo . Identification and verification of FN1, P4HA1 and CREBBP as potential biomarkers in human atrial fibrillation. Mathematical Biosciences and Engineering, 2023, 20(4): 6947-6965. doi: 10.3934/mbe.2023300 |
[3] | Nattawan Chuchalerm, Wannika Sawangtong, Benchawan Wiwatanapataphee, Thanongchai Siriapisith . Study of Non-Newtonian blood flow - heat transfer characteristics in the human coronary system with an external magnetic field. Mathematical Biosciences and Engineering, 2022, 19(9): 9550-9570. doi: 10.3934/mbe.2022444 |
[4] | Shengjue Xiao, Yufei Zhou, Ailin Liu, Qi Wu, Yue Hu, Jie Liu, Hong Zhu, Ting Yin, Defeng Pan . Uncovering potential novel biomarkers and immune infiltration characteristics in persistent atrial fibrillation using integrated bioinformatics analysis. Mathematical Biosciences and Engineering, 2021, 18(4): 4696-4712. doi: 10.3934/mbe.2021238 |
[5] | Oualid Kafi, Nader El Khatib, Jorge Tiago, Adélia Sequeira . Numerical simulations of a 3D fluid-structure interaction model for blood flow in an atherosclerotic artery. Mathematical Biosciences and Engineering, 2017, 14(1): 179-193. doi: 10.3934/mbe.2017012 |
[6] | Huu Thuan Nguyen, Tu Anh Do, Benoît Cosson . Numerical simulation of submerged flow bridge scour under dam-break flow using multi-phase SPH method. Mathematical Biosciences and Engineering, 2019, 16(5): 5395-5418. doi: 10.3934/mbe.2019269 |
[7] | Annalisa Quaini, Sunčica Čanić, David Paniagua . Numerical characterization of hemodynamics conditions near aortic valve after implantation of left ventricular assist device. Mathematical Biosciences and Engineering, 2011, 8(3): 785-806. doi: 10.3934/mbe.2011.8.785 |
[8] | Hongtao Liu, Shuqin Liu, Xiaoxu Ma, Yunpeng Zhang . A numerical model applied to the simulation of cardiovascular hemodynamics and operating condition of continuous-flow left ventricular assist device. Mathematical Biosciences and Engineering, 2020, 17(6): 7519-7543. doi: 10.3934/mbe.2020384 |
[9] | Abdul Qadeer Khan, Azhar Zafar Kiyani, Imtiaz Ahmad . Bifurcations and hybrid control in a 3×3 discrete-time predator-prey model. Mathematical Biosciences and Engineering, 2020, 17(6): 6963-6992. doi: 10.3934/mbe.2020360 |
[10] | Li Cai, Yu Hao, Pengfei Ma, Guangyu Zhu, Xiaoyu Luo, Hao Gao . Fluid-structure interaction simulation of calcified aortic valve stenosis. Mathematical Biosciences and Engineering, 2022, 19(12): 13172-13192. doi: 10.3934/mbe.2022616 |
D-pinitol is a natural compound related to the important family of inositols. It can be found and isolated from many plants, being the active component of ayurvedic remedies such as Talisa patra (Abies webbiana, A. pindrow) or antidiabetic as Bougainvillea (Bougainvillea spectabilis). Although many synthetic and semi-synthetic methods have been reported for D-pinitol and its derivatives, through chemical and biochemical transformations, Ceratonia siliqua L. (Carob), a Mediterranean tree now in decline, known because of its environmental advantages, is the only raw material from which D-pinitol can be isolated in quantities enough for a viable commercial exploitation. Fortunately, the pharmacological interest in this compound has risen enormously in the last years owing to their established multifunctional properties through a variety of signalling pathways: ⅰ) anti-cancer, through inhibition of TNF-ᾳ and suppression of NF-ⱪB pathway; ⅱ) insulinomimetic and metabolic regulator in type 2 diabetes mellitus, via a post-receptor pathway of insulin action; ⅲ) antioxidant; ⅳ) hepatoprotective; ⅴ) immuno-modulator, balancing Th1/Th2 cytokines; ⅵ) osteoporosis preventive, through p38/JNK and NF-ⱪB pathways; ⅶ) anti-aging, via reduction of the insulin/IGF-1 signaling (IIS) pathway; ⅷ) improver of creatine retention; ⅸ) preventive and ameliorative of Alzheimer's disease through selective g-secretase modulation.
Thus, the present review compress the literature reported to date in relation to the health-promoting effects and metabolic pathways of this naturally occurring super-food ingredient and its derivatives, providing an extensive guide for a future utilization of all of its potentialities, aiming a positive impact in the promotion and recovery of carob crops.
The extensive utilization of fossil fuels has given rise to profound energy crisis challenges and greenhouse gas emission issues. Consequently, energy conservation and emission reduction has emerged as a topic of common concern for all countries in the present world [1]. Photovoltaic (PV) power generation is known as a clean, safe, and sustainable renewable energy source [2], which has received special attention from investors and researchers because of its low cost of use, long lifetime, no greenhouse gas emissions [3], easy accessibility, low maintenance difficulty, abundant resources, and fixed payback period [4]. However, the fluctuating and stochastic nature of solar irradiance has introduced complexities to short-term scheduling within power systems, thereby incurring substantial supplementary costs for power suppliers [5]. Therefore, accurate forecasting of PV power generation is extremely important and is of great benefit to both power suppliers and power systems. Power suppliers need to obtain accurate information about PV power generation in order to set up specialized commercial offers to reduce production costs and increase profits; power systems can mitigate the negative impacts caused by uncertainty in PV power generation and ensure its stable and reliable operation [6].
According to the classification criteria of reference [7], existing PV power generation prediction methods can be classified into four main categories: Physical models, statistical models, machine learning models and deep learning models.
The most distinctive feature of the physical model is that it does not require any historical data [8] and it is based on solar irradiance and a complex set of mathematical equations describing the physical state of the PV system [4]. Under stable weather conditions, a physical model can achieve an acceptable level of predictive accuracy. However, its precision cannot be guaranteed when there are significant weather fluctuations. In the literature [9,10], several typical physical models are presented. In addition physical models can only produce meteorological data values after 6 hours, thus limiting its applicability for very short-term forecasting purposes [11].
Statistical models use purely mathematical equations to create a mapping relationship between historical and target forecast data to predict future PV generations [12]. These are data-driven approaches with the advantages of easy modeling and inter-regional generalizability. As a result, various statistical methods have been widely used in recent years to forecast PV power generation, including regression methods (RM) [13], autoregressive moving average models (ARMA) [14] and its improved version seasonal autoregressive integrated moving average model (SARIMA) [15]. However, the volatility and non-periodicity of the PV power generation time series may undermine the prerequisites required for the application of statistical methods, such as a substantial amount of suitable and high-quality input data, as well as an appropriate input time range.
Machine learning (ML) models, which have evolved from the foundation of statistical models, have been used in recent years in various fields of science and engineering, including the prediction of PV power generation. It follows the process of preparing data, training algorithms, generating models, and then making and refining predictions [16]. ML models frequently used in PV power generation prediction include artificial neural networks (ANN) [17], support vector machines (SVM) [18] and extreme learning machine (ELM) [19].
The above models are shallow networks and are suitable for handling small-scale datasets. With the explosive growth of data volume, these methods are not able to mine effective features from massive data, so deep learning can be used to address this bottleneck. Deep learning (DL) models have been used to solve many research areas and have been successfully applied to PV power generation [20]. Deep learning is capable enough to extract, transform and model the intricate features inherent in the PV power generation time series and provide not only more effective but also superior prediction results than traditional models. LSTM, as one of the most important deep learning techniques, has been frequently applied in related work [2].
Literature [21] compared LSTM with the persistence algorithm, linear least squares regression algorithm and back propagation algorithm using a dataset collected in the island of Santiago, Cape Verde, as an input, and the experimental results showed that the LSTM algorithm performs better in terms of prediction accuracy and generalization ability. Although a single LSTM unit outperforms compared to traditional physical and ML models, its prediction accuracy is still limited by the simple network structure. Literature [22] first uses the Bayesian optimization algorithm to optimize the hyperparameters of the deep neural network, which solves the problem of unidirectional data transfer of LSTM and achieves bidirectional propagation of historical and future information. However, the BiLSTM network is still essentially a simple RNN model, which is capable of effectively extracting historical useful information of the time series, but has a weak feature extraction capability for the input data. Literature [23] uses CNNto extract the features of the influencing factors of the input data and uses BiLSTM for time series prediction. However, in order to achieve longer time-size convolution, an extremely deep network of convolutional layers is required. In addition, most of the above prediction models are based only on a large amount of data, ignoring its real-world issues or physical implications, thereby potentially yielding irrational predictive outcomes.
Therefore, based on the above studies, this paper proposes a PV prediction model based on dilated causal convolution network (DCCN) and stacked LSTM (SLSTM) in conjunction with the physical constraints. The main contributions of our work can be summarized as follows:
● The introduction of the basic characteristics of PV power plants as physical constraints ensures the rapidity of subsequent model training and the reasonableness of model output;
● Employing temporal convolutional network for feature extraction can fully exploit the spatial features of PV historical data and improve the prediction accuracy of the subsequent model;
● The stacked network structure is used for training. Compared with the original LSTM model, the superiority of SLSTM is that it can more fully learn the temporal features in the PV sequences, thus elevating the prediction accuracy of the model.
The rest of the paper is described as follows: Section 2 gives details of the theoretical background of the proposed prediction model; Section 3 presents the experimental results and discussions, comparing the designed model against various others; Section 4 summarises the work of this paper and provides an outlook for future work.
The overall framework of the proposed dilated causal convolution network-stacked LSTM model (DSLSTM) is shown in Figure 1. The structure of the method consists of a dilated causal convolutional network for feature extraction and a SLSTM layer. It consists of three main steps: Data preprocessing, training of the DL network and PV power prediction.
In this subsection, physical constraints are initially extracted from the domain knowledge and physical laws of PV and then integrated into the construction of the DSLSTM model. The aim is to overcome the limitations of DL algorithms, which often yields predictions based solely on extensive data, potentially leading to results that do not adhere to the physical laws of the real world. This includes scenarios such as negative power generation during daytime hours (05:00 to 19:00) and positive power generation during nighttime hours (19:00 to 05:00), which may not align with the actual physical constraints.
Specifically, there are two types of constraints in the structure of DSLSTM (denoted as Cons1 and Cons2 in Figure 1). The first constraint, known as the data cropping module, is designed based on physical knowledge or general knowledge of PVs [17]. Its purpose is to eliminate physically unreasonable predictions during the training and testing processes by cropping the data. For instance, it addresses the occurrence of positive power generation during the nighttime hours of PVs (from 19:00 on the first day to 05:00 on the following day). The original dataset contained data points at 15-minute intervals, totaling 96 points per day. Given that the photovoltaic power generation remains at 0 before 5:00 in the morning and after 19:00 in the evening, data for the training of the model was only selected from the period 05:00 to 19:00 each day. Consequently, the data scale reduced from 35,040 data points per year to 20,440 data points per year, representing a decrease of 41.7%. This approach not only prevents occurrences of positive power generation during nighttime but also reduces the model training time.
The second constraint, called the data filtering module, is used to limit the output of the model to a reasonable range during training and testing. It is designed based on knowledge of the natural science of PV to eliminate physically unreasonable predictions such as negative power generation. According to the laws of physics, the generation value of PV should be greater than zero in reality, so the output of the model should be positive. Therefore, the predicted output of DSLSTM ypt should be constrained by Eq (1):
ypt=ReLU(f(x1,x2,...,xn)), | (1) |
where ReLU() represents the rectified linear unit function. When the input to the ReLU function is less than 0, the ReLU function returns 0; when the input is greater than 0, the original value of the input is returned. xi represents the ith input and f() represents the neural network.
The inclusion of the above two constraints ensures the rapidity of the DSLSTM model training and the reasonableness of the output.
The principle of causal convolution is that the current state cannot contain future information. In other words, the output at time step t + 1 is only correlated with the previous time steps, i.e., t, t-1, ..., t-n (as illustrated in Figure 3, where n = 14 in this paper). This approach effectively prevents the issue of information leakage caused by regular convolution.
A significant drawback of causal convolution lies in its requirement for extremely deep networks or exceedingly large filters to achieve convolutions over longer time spans, both of which were not initially entirely practical. Therefore, the introduction of the dilation factor, denoted as 'd', serves to enlarge the receptive field and accept a broader range of input information.
A simple causal convolution can only recall a history that is linearly related to the depth of the network. This makes causal convolution difficult to apply to tasks that require longer time sizes. In this paper, dilation convolution is used to increase the sense field. Dilation convolution is equivalent to introducing a fixed-length interval between two neighboring elements in the convolution kernel of ordinary convolution. When the dilation factor is equal to 1, the dilation convolution is the ordinary convolution. The use of larger dilation factor represents a larger receptive field. The structure of the dilation causal convolution is shown in the following figure.
With the increase of convolutional layers, there is a risk of losing crucial feature information, so the residual connection that can realize the transfer of data across layers is introduced. At the same time, the residual connection can also effectively alleviate the gradient disappearance or gradient explosion problem that exists in the deep network. The structure of the feature extraction module proposed in this paper is shown in Figure 3, which consists of two parts: The left section is the dilation causal convolution, while the right section employs a 1 × 1 convolution for residual connections. The 1 × 1 convolution ensures matching tensor shapes when elements are added together [24]. The formula for the residual connection is shown in Eq (2):
DCCN(x)=DCC(x)+Conv(x), | (2) |
where x denotes the input, Conv(x) denotes the output of the 1 × 1 convolution, DCC(x) denotes the output of the dilation causal convolution and DCCN(x) denotes the output of the dilated causal convolutional network.
Different architectures for DL, such as RNNs and deep neural networks (DNNs), have been used in many application areas and have produced superior to most data modeling techniques. A distinctive aspect separating RNNs from DNNs lies in the fact that RNNs generate not only outputs but also hidden states. These hidden states, subsequently coupled with input data at the subsequent timestamp, are employed to adapt network weights, thereby giving rise to the construction of deep learning architectures. The hidden states have the capacity to retain prior information and deploy it in subsequent training phases [24].
RNN is a powerful and robust neural network that uses existing time series data to predict future data for a specific length of time. In RNN, the output of the previous timestamp as well as the internal state of the current timestamp will be fed into the RNN unit. Consequently, the current output of the model depends not only on the current inputs, but also bears the influence of the previous states. Therefore, RNN is very promising in processing the historical PV data characterized by sequential characteristics.
Although RNN can effectively extract temporal information from temporal data, RNN encounters issues of vanishing and exploding gradients during training on lengthy sequences. To overcome the limitations of RNN, Hochreiter and Schmidhuber [25] proposed LSTM architecture. LSTM adds forget gate, input gate, update gate and output gate to RNN. As the name suggests, the forget gate determines the percentage of long-term memory that is forgotten, the input gate determines what percentage of the current moment can be passed to the amount of cell state at the current moment, the update gate is used to update the cell state and the output gate produces the output at the current moment. These four main components of the LSTM will work and interact with each other in a special way. The internal structure of the LSTM is illustrated in Figure 4.
The forget gate determines the proportion by which the previous timestep cell state, serving as long-term memory, is to be forgotten. The forget gate consists of the hidden state of the previous moment and the input of the current moment, which is finally obtained by the activation function. The process of calculating the forget gate ft is shown in Eq (3):
ft=σ(Wifxt+Whfht−1+bf), | (3) |
where xt is the input of the current moment, Wif is the weight of the current input, ht−1 denotes the hidden state functioning as short-term memory from the previous timestep, Whf represents the weight of the hidden state in the previous moment, and bf is the bias of the forget gate. The symbol σ denotes the activation function and its outputs take on the range of [0, 1], where 0 means complete forgetting and 1 means complete retention.
The input gate determines the proportion of short-term information at the current moment that can be updated into long-term memory, and the process of calculating the input gate it is described in Eq (4):
it=σ(Wiixt+Whiht−1+bi), | (4) |
where Wii, Whi and bi stand for the weight matrix of the current input of the input gate, the weight matrix of the hidden state at the previous moment and the bias of the input gate, respectively.
The update gate is used to control the update of the candidate cell state and the candidate cell state gt is obtained by the tanh activation function, which takes the value in the range of [–1, 1]; the calculation is shown in Eq (5):
gt=tanh(Wigxt+Whght−1+bg), | (5) |
where Wig, Whg and bg, respectively, denote the weight matrix of the current input of the candidate cell state, the weight matrix of the hidden state at the previous moment and the bias of the candidate cell state.
The cell state at the current moment is jointly determined by the forget gate and the input gate. The calculation is shown in Eq (6):
ct=ft∗ct−1+it∗gt, | (6) |
The output gate is used to control the output of a cell state and transfer that state to the next cell. The process of calculating the output gate ot value is shown in Eq (7):
ot=σ(Wioxt+Whoht−1+bo), | (7) |
where Wio represents the weight matrix of the output gate, Who is the weight of the hidden state in the previous moment and bo stands for the bias of the output gate.
Upon calculating the forget gate, input gate, update gate, output gate and candidate cell state, LSTM will calculate the output as well as update the hidden state with the following formula:
yt=ot∗tanh(ct), | (8) |
ht=yt. | (9) |
Deep network architectures have demonstrated strong capabilities in dealing with complex nonlinear feature representations [26]. Research indicates that although a single LSTM unit can solve the gradient vanishing and explosion problems in RNN models, its prediction accuracy is still limited by the simple network structure [27]. Therefore, by increasing the stacking depth of the LSTMs, the features of the input sequences can be better learnt, consequently improving the network performance.
The structure of SLSTM is shown in Figure 5. It consists of multiple LSTM layers, where the input of the first LSTM layer is the original data and the output of the last LSTM layer is the prediction result. The inputs of the other intermediate LSTM layers come from the outputs of their previous LSTM layer, and the outputs are used as inputs to the latter LSTM layer. As with the original LSTM, the hidden states and cell states in the stacked LSTM are also passed to the next moment. The difference is that the dimension is increased in this stacked structure.
While stacking multiple LSTM layers significantly enhances the network's capacity to learn from long sequences, excessive layer stacking should be avoided. An increase in the number of layers can lead to slower model update iterations, reduced convergence effectiveness and exponential growth in temporal and memory costs during training. This can make the model susceptible to issues such as gradient vanishing. Therefore, in this paper we choose to adopt a stacked LSTM module consisting of three LSTM layers.
The PV data utilized in this study is from Gaoyou, Jiangsu with the PV power plant positioned at 32 degrees, 58 minutes, 31 seconds north latitude and 119 degrees, 36 minutes, eight seconds east longitude, boasting an installed capacity of 10MW. The selected data used for model training and validation spanned from January 1, 2017, 00:00:00 to December 31, 2017, 23:45:00, with a temporal resolution of 15 minutes and 8:2 split ratio for the training and testing sets. As anticipated, solar irradiance is generally higher between 11:00 and 14:00, corresponding to elevated PV power generation during daylight hours. Comparatively, power generation is notably lower during the early morning hours (05:00 to 11:00) and the afternoon (14:00 to 19:00). Notably, power generation remains at zero during the night (19:00 to 05:00 the following day) due to the absence of solar irradiance.
Recent studies have used multivariate datasets consisting of meteorological data or other environmental variables to improve the performance of prediction models [2,5,15,16]. However, in many cases, such as in short-term studies, the addition of these variables has little effect on the accuracy of the predictions due to their small variation over a short period of time (i.e., 15 minutes) [28]. Nonetheless, additional variables complicate the model and slow down the training process. Consequently, this study exclusively considers historical PV generation data as the model input to validate the superiority of the proposed DSLSTM model.
The normalization of data can eliminate the effect of magnitude and dimensions, and overcome the problem of overflow of individual data during the training process. Common normalization techniques are max-min normalization, mean normalization and Z-Score normalization. Considering that the PV generation data is all positive, this study uses max-min normalization that scales the PV data between [0, 1]. The formulation for this normalization process is presented as Eq (10):
x=x′−xminxmax−xmin, | (10) |
where x′ and x are the original and normalized values of PV, respectively, xmin denotes the minimum value of PV data and xmax denotes the maximum value of PV data.
In this paper, we employ four performance evaluation metrics to assess the predictive outcomes: Coefficient of determination (R2), mean absolute error (MAE), mean squared error (MSE) and root mean squared error (RMSE) [18,21,24]. These metrics are used to quantify the accuracy and performance of the predictive model. The MAE value represents the average magnitude of prediction errors, quantifying the average absolute difference between predicted values and actual values; the MSE reflects the average Euclidean distance between the predicted and actual values, and these two metrics are often used to gauge the overall performance of predictive models. RMSE is a widely used method in evaluating prediction errors, which defines the degree of error that exists between the prediction and the actual result, and is usually more sensitive to large deviations between measurements and predictions. Smaller values of MAE, MSE and RMSE indicate better predictive performance. The R2 reflects the correlation between inputs and outputs and is frequently used to assess the fit quality of regression models. In regression models, the closer the sum of squared residuals is to zero, the closer the R2 value is to 1, indicating higher precision in the model's predictions. It is worth noting that due to scenarios where both actual and predicted values are zero within this study, the mean absolute percentage error (MAPE) and symmetric mean absolute percentage error (SMAPE) were not adopted as evaluation metrics. Below are the specific formulas for calculating these four metrics used to measure predictive model performance:
MAE(yA,yP)=1n∑ni=1|yAi−yPi|, | (11) |
MSE(yA,yP)=1n∑ni=1(yAi−yPi)2, | (12) |
RMSE(yA,yP)=√1n∑ni=1(yAi−yPi)2, | (13) |
R2(yA,yP)=1−SSres(yA,yP)SStot(yA,yP), | (14) |
where ˉyA and ˉyP denote the average value of the actual output and the average value of the predicted output, respectively; yAi and yPi denote the true value and the predicted value at the i moment, respectively; n denotes the length of the training samples; SSres stands for the sum of squares of the residuals and SStot represents the total sum of squares of the real data, which are expressed in the following formulas:
SSres(yA,yP)=∑ni=1(yAi−yPi)2, | (15) |
SStot(yA,yP)=∑ni=1(yAi−ˉyA)2. | (16) |
In the following section, a case study will be conducted to validate the feasibility and effectiveness of the proposed methodology using real-world PV datasets.
All experiments were conducted on a desktop computing workstation running on an Intel(R) Core(TM) i5-9500F central processing unit (CPU) @ 3.00GHz, NVIDIA GeForce GTX 1060 GPU, 16GB DDR4 RAM, and the operating system is Windows 10 Professional. The network proposed in this paper is built under Python 3.10.9, Pytorch 1.12.1. The Adam optimizer with weight decay set to 0.0001 and a learning rate of 0.0001 is used for optimization and iterative training of the networks through backpropagation.
The choice of hyperparameters of the model is essential for the correct training of the model. The main hyperparameters of the model are set as Table 1.
Hyper-Parameters | Qty |
Input size (lag) | 15 (225 min) |
Batch size | 8 |
Kernel size of Conv1d | 1 × 3 |
Dilation step of Conv1d | 2 |
Layers of Conv1d | 3 |
Layers of LSTM | 3 |
Dropout rate of LSTM | 0.2 |
Hidden size of LSTM | 64 |
Theoretically, the more the number of LSTM hidden layers, the stronger the curve fitting ability of the predicted data. However, as the number of layers increases, the neural network structure becomes more and more complex, the training time becomes longer and longer, it is easy to appear overfitting phenomenon and the generalization ability becomes worse. In this paper, we compare the prediction effect when the number of hidden layers is one, two, three, four, five, six, seven, respectively, and at the same time, in order to avoid chance, we randomly do ten experiments and take the average of the best two of them as the most results. The results are shown in Figure 6.
In Figure 6, although the single-layer LSTM prediction results deviate from the actual value, the training time is small; the prediction results of the two, three, four and five-layer LSTM have significant improvement, while the three-layer LSTM has the smallest prediction error; as for the six or seven layers, with the increase of the number of layers, the training time of the LSTM model increases significantly. The possible reason for this is that the network structure is getting more and more complex to appear the phenomenon of overfitting and the generalization ability becomes worse. Taken together, the three-layer LSTM model is optimal for prediction.
To validate the effectiveness of DSLSTM, the proposed predictive model is compared with MLP, RNN, GRU, LSTM, SGRU, SLSTM, DSGRU and DSLSTM. In order to strictly control the variables, the same dataset is used as input, and to ensure the accuracy of the experimental results and avoid the influence of chance factors, the average value is taken as the prediction result after several experiments on the test set. The effectiveness of the application of various prediction algorithms is shown in Table 2 below.
MAE | MSE | RMSE | R2 | |
MLP | 4.531 | 66.575 | 8.159 | 0.898 |
RNN | 4.297 | 65.321 | 8.082 | 0.899 |
GRU | 4.414 | 65.948 | 8.121 | 0.901 |
LSTM | 4.154 | 63.264 | 7.954 | 0.903 |
SGRU | 4.263 | 63.482 | 7.967 | 0.903 |
SLSTM | 4.145 | 62.287 | 7.892 | 0.905 |
DSGRU | 3.872 | 62.400 | 7.899 | 0.905 |
DSLSTM | 3.728 | 59.094 | 7.687 | 0.910 |
First and foremost, concerning individual models, it is evident from Table 2 that, compared to MLP, RNNs demonstrate superior adaptability and learning capabilities in time-series prediction tasks due to their capacity to retain previous information and incorporate it into current output computation. Moreover, an analysis of Table 2 reveals that, although GRU simplifies LSTM computations and reduces parameters, it falls short of effectively controlling data flow; thus, leading to inferior performance compared to LSTM, especially in scenarios involving sizable datasets. This assertion is corroborated by the comparative results between LSTM and GRU.
Second, we can infer that the performance of stacked models surpasses that of individual models. Single models, constrained by their simplistic network structures, benefit from increased depth through stacked networks, thereby enhancing the learning of distinctive features within input sequences and, consequently, improving network performance. This assertion finds support in the lower MSE of SLSTM by 1.5% and SGRU by 3.7% compared to LSTM and GRU, respectively.
Furthermore, it can be concluded that composite models exhibit significantly superior performance compared to stacked models. Observing Figure 7, it is apparent that the proposed DSLSTM and DSGRU models demonstrate lower MAE, MSE and RMSE and higher R-squared (R2) values. Specifically, compared to the stacked models without the expanded causal convolution network, DSLSTM achieves a reduction of 10, 5.13 and 2.6% in MAE, MSE and RMSE, respectively, while increasing R2 by 0.55%. Similarly, in the case of DSGRU, the MAE, MSE and RMSE decrease by 9.17, 1.7 and 0.86%, respectively, with a corresponding increase of 0.19% in R2. Figure 8 illustrates that prediction models incorporating the expanded causal convolution network exhibits superior performance, primarily owing to the network's ability to capture holistic feature information from historical data, thereby facilitating more accurate PV output predictions. This highlights the significance of feature extraction capabilities.
Finally, compared to DSGRU, DSLSTM demonstrates a 3.7, 5.3 and 2.7% reduction in MAE, MSE, and RMSE evaluation metrics, respectively, along with a 0.6% increase in R2. Figure 9 also indicates that the prediction deviation of the DSLSTM model is less than that of DSGRU, underscoring the ability of the proposed model to offer more precise and reliable PV predictions, thus exhibiting promising practical application prospects.
Naturally, the DSLSTM network proposed in this paper demands more time for training. However, in practical applications, our focus remains on prediction time (testing time), while training can be completed during offline and idle periods.
The prediction of PV power generation has been extremely important in the development of the entire PV industry. This article presents an innovative deep learning-based framework to address the short-term prediction challenges inherent in PV power generation. Through experimental simulations and analytical examinations, the following conclusions have been drawn:
1) The introduction of the fundamental physical constraint properties of PV power plants ensures the rapidity of the subsequent model training and the reasonableness of the model prediction output.
2) For the huge dataset, the use of DCCN for feature extraction can fully exploit the relevant features to the PV historical data, thereby enhancing the prediction accuracy of the model.
3) The adoption of a SLSTM model for training presents an advantage over the conventional LSTM model due to its intricate network architecture, which more comprehensively captures the patterns of variation within the solar sequence; thus, enhancing the predictive accuracy of the model.
Through comparative analysis with various alternative models, it becomes evident that the proposed DSLSTM model outperforms in all performance metrics. From the comprehensive results, this indicates that the proposed DSLSTM model possesses excellent overall performance, thereby demonstrating substantial feasibility for practical applications.
In future work, the anticipated direction will involve an in-depth anticipation of various decomposition algorithms to improve the accuracy of short-term PV power forecasting. In addition, migration learning will be considered to enhance the practicality of the model in response to the insufficient amount of data from PV power plants.
The authors declare they have not used Artificial Intelligence (AI) tools in the creation of this article.
The authors declare there is no conflict of interest.
[1] |
Nasar-Abbas SM, E-Huma Z, Vu T, et al. (2016) Carob Kibble: A Bioactive-Rich Food Ingredient. Compr Rev Food Sci Food Saf 15: 63-72. doi: 10.1111/1541-4337.12177
![]() |
[2] |
Bhat KA, Shah BA, Gupta KK, et al. (2009) Semi-synthetic analogs of pinitol as potential inhibitors of TNF-alpha cytokine expression in human neutrophils. Bioorg Med Chem Lett 19: 1939-1943. doi: 10.1016/j.bmcl.2009.02.050
![]() |
[3] |
Anderson AB, MacDonald DL, Fischer HOL (1952) The structure of pinitol. J Am Chem Soc 74: 1479-1480. doi: 10.1021/ja01126a036
![]() |
[4] |
Posternak T (1936) Recherches dans la série des cyclites Ⅲ. Sur la configuration des inosites actives. Helv Chim Acta 19: 1007-1010. doi: 10.1002/hlca.193601901132
![]() |
[5] |
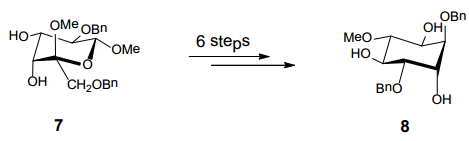
Catelani G, D'Andrea F, Griselli A, et al. (2008) A new stereoselective approach to a selectively protected derivative of D-pinitol and its evaluation as alpha-L-rhamnopyranose mimetic. Tetrahedron Lett 49: 4534-4536. doi: 10.1016/j.tetlet.2008.05.040
![]() |
[6] |
Dowd M, Stevens E (2002) The crystal structures of D-Pinitol and 1-Quebrachitol by low-temperature X-ray diffraction. J Carbohydr Chem 21: 373-383. doi: 10.1081/CAR-120014901
![]() |
[7] | Dowd MK, Stevens ED, Experimental Crystal Structure Determination. CCDC 172582,2014. Available from: https://dx.doi.org/10.5517/cc5sl5p. |
[8] |
Raya-Gonzalez D, Pamatz-Bolanos T, Rio-Torres R, et al. (2008) D-(+)-Pinitol, a component of the heartwood of Enterolobium cyclocarpum (Jacq.) Griseb. Z Naturforsch C: J Biosci 63: 922-924. doi: 10.1515/znc-2008-11-1225
![]() |
[9] | Anderson I, (1972) The cyclitols, In: Pigman W, Horton D. Eds. The Carbohydrates, 2nd ed., New York and London: Academic Press, Inc., Vol. 1A Chemistry and Biochemisty. |
[10] |
Calle J, Rivera A, Josephnathan P (1987) Pinitol from leaves of Gliricidia sepium. Planta Med 53: 303. doi: 10.1055/s-2006-962717
![]() |
[11] | Poongothai G, Sripathi SK (2013) A review on insulinomimetic pinitol from plants. Int J Pharm Bio Sci 4: 992-1009. |
[12] |
Al-Suod H, Lior M, Ratiu IA, et al. (2016) A window on cyclitols: Characterization and analytics of inositols. Phytochem Lett 20: 507-519. doi: 10.1016/j.phytol.2016.12.009
![]() |
[13] |
Labed A, Ferhat M, Labed-Zouad I, et al. (2016) Compounds from the pods of Astragalus armatus with antioxidant, anticholinesterase, antibacterial and phagocytic activities. Pharm Biol 54: 3026-3032. doi: 10.1080/13880209.2016.1200632
![]() |
[14] | Lahuta LB, Ciak M, Rybinski W, et al. (2017) Diversity of the composition and content of soluble carbohydrates in seeds of the genus Vicia (Leguminosae). Genet Resour Crop Evol 2017: 1-14. |
[15] |
Phillips DV, Dougherty DE, Smith AE (1982) Cyclitols in soybean. J Agric Food Chem 30: 456-458. doi: 10.1021/jf00111a011
![]() |
[16] |
Adinarayana D, Ramachandraiah P (1985) C-Glycosylphenolics from Rhynchosia suaveolens. J Nat Prod 48: 156-157. doi: 10.1021/np50037a042
![]() |
[17] |
Tetik N, Turhan I, Oziyci HR, et al. (2011) Determination of D-pinitol in carob syrup. Int J Food Sci Nutr 62: 672-676. doi: 10.3109/09637486.2011.560564
![]() |
[18] |
Sharma N, Verma MK, Gupta DK, et al. (2016) Isolation and quantification of pinitol in Argyrolobium roseum plant, by 1H-NMR. J Saudi Chem Soc 20: 81-87. doi: 10.1016/j.jscs.2014.07.002
![]() |
[19] | Pérez-Pastor A, Soares-Neto JP, de la Rosa JM, et al. (2016) Carbon footprint assessment in carob tree plantations. Vida Rural April: 52-60. |
[20] |
Baumgartner S, Gennerritzmann R, Haas J, et al. (1986) Isolation and identification of cyclitols in carob pods (Ceratonia siliqua L.). J Agric Food Chem 34: 827-829. doi: 10.1021/jf00071a015
![]() |
[21] | Oziyci HR, Turhan I, Tetik N (2015) Concentration of D-pinitol in carob extract by using multi-stage enrichment processes. GIDA 40: 125-131. |
[22] | Turhan I (2011) Optimization of extraction of D-pinitol and phenolics from cultivated and wild types of carob pods using response surface methodology. Int J Food Eng 7: 639-646. |
[23] |
Turhan I (2014) Relationship between sugar profile and D-pinitol content of pods of wild and cultivated types of carob bean (Ceratonia siiqua L.). Int J Food Prop 17: 363-370. doi: 10.1080/10942912.2011.631255
![]() |
[24] |
Lin TH, Tan TW, Tsai TH, et al. (2013) D-pinitol inhibits prostate cancer metastasis through inhibition of aVb3 integrin by modulating FAK, c-Src and NF-kB pathways. Int J Mol Sci 14: 9790-9802. doi: 10.3390/ijms14059790
![]() |
[25] |
Streeter JG (1980) Carbohydrates in soybean nodules: Ⅱ. Distribution of compounds in seedlings during the onset of nitrogen fixation. Plant Physiol 66: 471-476. doi: 10.1104/pp.66.3.471
![]() |
[26] |
Hudlicky T, Price JD, Rulin F, et al. (1990) Efficient and enantiodivergent synthesis of (+)-and (-)-pinitol. J Am Chem Soc 112: 9439-9440. doi: 10.1021/ja00181a081
![]() |
[27] |
Hudlicky T, Rulin F, Tsunoda T, et al. (1991) Biocatalysis as a rational approach to enantiodivergent synthesis of highly oxygenated compounds: (+)-and (-)-Pinitol and Other Cyclitols. Isr J Chem 31: 229-238. doi: 10.1002/ijch.199100027
![]() |
[28] |
Hudlicky T, Mandel M, Rouden J, et al. (1994) Microbial Oxidation of Aromatics in Enantiocontrolled Synthesis. Part 1. Expedient and General Asymmetric Synthesis of lnositols and Carbohydrates via an Unusual Oxidation of a Polarized Diene with Potassium Permanganate. J Chem Soc Perkin Trans 1 1: 1553-1567. doi: 10.1039/p19940001553
![]() |
[29] |
Ley SV, Sternfeld F (1989) Microbial oxidation in synthesis: Preparation of (+)-and (-)-pinitol from benzene. Tetrahedron 45: 3463-3476. doi: 10.1016/S0040-4020(01)81025-5
![]() |
[30] |
Ley SV, Sternfeld F, Taylor S (1987) Microbial oxidation in synthesis: A six step preparation of (+)-Pinitol from benzene. Tetrahedron Lett 28: 225-226. doi: 10.1016/S0040-4039(00)95692-2
![]() |
[31] |
Aceña JL, Arjona O, Plumet J (1996) Total synthesis of (+)-pinitol. Tetrahedron: Asymmetry 7: 3535-3544. doi: 10.1016/S0957-4166(96)00461-2
![]() |
[32] |
Sethi G, Ahn KS, Sung B, et al. (2008) Pinitol targets nuclear factor-kB activation pathway leading to inhibition of gene products associated with proliferation, apoptosis, invasion, and angiogenesis. Mol Cancer Ther 7: 1604-1614. doi: 10.1158/1535-7163.MCT-07-2424
![]() |
[33] |
Gao Y, Zhang M, Wu T, et al. (2015) Effects of D-pinitol on insulin resistance through the PI3K/Akt signaling pathway in type 2 diabetes mellitus rats. J Agric Food Chem 63: 6019-6026. doi: 10.1021/acs.jafc.5b01238
![]() |
[34] |
Liu SC, Chuang SM, Tang CH (2012) D-pinitol inhibits RANKL-induced osteoclasteogenesis. Int Immunopharmacol 12: 494-500. doi: 10.1016/j.intimp.2012.01.002
![]() |
[35] |
Zhou Y, Park CM, Cho CW, et al. (2008) Protective effect of pinitol against D-galactosamine-induced hepatotoxicity in rats fed on a high-fat diet. Biosci Biotechnol Biochem 72: 1657-1666. doi: 10.1271/bbb.70473
![]() |
[36] | Shin YC, Jeon JY (2004) The physiological activities of pinitol isolated from soybean. Food Ind Nutr 30: 2680-2688. |
[37] |
Choi MS, Lee MK, Jung UJ, et al. (2009) Metabolic response of soy pinitol on lipid-lowering, antioxidant and hepatoprotective action in hamsters fed-high fat and high cholesterol diet. Mol Nutr Food Res 53: 751-759. doi: 10.1002/mnfr.200800241
![]() |
[38] |
Rengarajan T, Nandakumar N, Rajendran P, et al. (2014) D-pinitol promotes apoptosis in MCF-7 cells via induction of p53 and Bax and inhibition of Bcl-2 and NF-kB. Asian Pac J Cancer Prev 15: 1757-1762. doi: 10.7314/APJCP.2014.15.4.1757
![]() |
[39] |
Rengarajan T, Nandakumar N, Rajendran P, et al. (2015) D-pinitol mitigates tumor growth by modulating interleukins and hormones and induces apoptosis in rat breast carcinogenesis through inhibition of NF-kB. J Physiol Biochem 71: 191-204. doi: 10.1007/s13105-015-0397-9
![]() |
[40] | Fentiman IS (2001) Fixed and modifiable risk factors for breast cancer. Int J Clin Pract 55: 527-530. |
[41] |
Parkin DM, Bray F, Ferlay J, et al. (2001) Estimating the world cancer burden: Globocan 2000. Int J Cancer 94: 153-156. doi: 10.1002/ijc.1440
![]() |
[42] |
Mundy GR (2002) Metastasis: Metastasis to bone: Causes, consequences and therapeutic opportunities. Nat Rev Cancer 2: 584-593. doi: 10.1038/nrc867
![]() |
[43] |
Bryant RJ, Hamdy FC (2008) Screening for prostate cancer: An update. Eur Urol 53: 37-44. doi: 10.1016/j.eururo.2007.08.034
![]() |
[44] |
Ernst DS, Hanson J, Venner PM (1991) Analysis of prognostic factors in men with metastatic prostate cancer. Uro-Oncology Group of Northern Alberta. J Urol 146: 372-376. doi: 10.1016/S0022-5347(17)37797-2
![]() |
[45] |
Jayasooriya R, Kang CK, Park SR, et al. (2015) Pinitol suppresses tumor necrosis factor-a-induced invasion of prostate cancer LNCaP cells by inhibiting nuclear factor-kB-Mediated matrix metalloproteinase-9 expression. Trop J Pharm Res 14: 1357-1364. doi: 10.4314/tjpr.v14i8.6
![]() |
[46] |
Ayala GE, Dai H, Ittmann M, et al. (2004) Growth and survival mechanisms associated with perineural invasion in prostate cancer. Cancer Res 64: 6082-6090. doi: 10.1158/0008-5472.CAN-04-0838
![]() |
[47] |
Nakamachi H, Suzuki H, Akakura K, et al. (2002) Clinical significance of pulmonary metastases in stage D2 prostate cancer patients. Prostate Cancer Prostatic Dis 5: 159-163. doi: 10.1038/sj.pcan.4500573
![]() |
[48] |
Pezzuto JM (1997) Plant-derived anticancer agents. Biochem Pharmacol 53: 121-133. doi: 10.1016/S0006-2952(96)00654-5
![]() |
[49] |
Conney AH, Lou YR, Xie JG, et al. (1997) Some perspectives on dietary inhibition of carcinogenesis: Studies with curcumin and tea. Proc Soc Exp Biol Med 216: 243-245. doi: 10.3181/00379727-216-44173
![]() |
[50] |
Park EJ, Pezzuto JM (2002) Botanicals in cancer chemoprevention. Cancer Metastasis Rev 21: 231-255. doi: 10.1023/A:1021254725842
![]() |
[51] | Available from: a) https://www.cancer.gov/about-cancer/treatment/cam/patient/suns-soup-pdq. b) https://www.cancer.gov/about-cancer/treatment/cam/patient/prostate-supplements-pdq#section/_95. |
[52] |
Rengarajan T, Nandakumar N, Balasubramanian MP (2013) D-pinitol prevents rat breast carcinogenesis induced by 7, 12-dimethylbenz (a) anthracene through inhibition of Bcl-2 and induction of p53, caspase-3 proteins and modulation of hepatic biotransformation enzymes and antioxidants. Biomed Prev Nutr 3: 31-41. doi: 10.1016/j.bionut.2012.07.001
![]() |
[53] | Kim YS, Park JS, Kim MJ, et al. (2014) Inhibitory effect of D-pinitol on both growth and recurrence of breast tumor from MDA-MB-231 Cancer Cells. Korean J Pharmacogn 45: 174-180. |
[54] |
Rengarajan T, Nandakumar N (2012) Protective efficacy of dietary D-pinitol on hepatic and renal tissues during experimental breast cancer in rats challenged with 7, 12-Dimethylbenz (a) anthracene: A biochemical approach. Biomed Aging Pathol 2: 85-93. doi: 10.1016/j.biomag.2012.07.008
![]() |
[55] |
Rengarajan T, Rajendran P, Nandakumar N, et al. (2014) Free radical scavenging and antioxidant activity of D-pinitol against 7, 12-Dimethylbenz (a) anthracene induced breast cancer in sprague dawley rats. Asian Pac J Trop Dis 4: 384-390. doi: 10.1016/S2222-1808(14)60592-2
![]() |
[56] | Rengarajan T, Nandakumar N, Balasubramanian MP (2012) D-pinitol attenuates 7, 12-dimethylbenz (a) anthracene induced hazards through modulating protein bound carbohydrates, adenosine triphosphatases and lysosomal enzymes during experimental mammary carcinogenesis. J Exp Ther Oncol 10: 39-49. |
[57] | Song SG, Park JS, Kim YS (2015) Use of pinitol and D-chiro inositol in cancer treatment and prevention of cancer relapse. Korean patent KR 20150088589 (A). |
[58] |
Kumar A, Takada Y, Boriek AM, et al. (2004) Nuclear factor-kB: Its role in health and disease. J Mol Med 82: 434-448. doi: 10.1007/s00109-004-0555-y
![]() |
[59] |
Chaturvedi MM, Sung B, Yadav VR, et al. (2011) NF-kB addiction and its role in cancer: 'One size does not fit all'. Oncogene 30: 161-1630. doi: 10.1038/onc.2010.566
![]() |
[60] |
Kong D, Li Y, Wang Z, et al. (2007) Inhibition of angiogenesis and invasion by 3, 3'-diindolylmethane is mediated by the nuclear factor-kB downstream target genes MMP-9 and uPA that regulated bioavailability of vascular endothelial growth factor in prostate cancer. Cancer Res 67: 3310-3319. doi: 10.1158/0008-5472.CAN-06-4277
![]() |
[61] |
Lechertier T, Hodivala-Dilke K (2012) Focal adhesion kinase and tumour angiogenesis. J Pathol 226: 404-412. doi: 10.1002/path.3018
![]() |
[62] |
Hwangbo C, Kim J, Lee JJ, et al. (2010) Activation of the integrin effector kinase focal adhesion kinase in cancer cells is regulated by crosstalk between protein kinase Calpha and the PDZ adapter protein mda-9/Syntenin. Cancer Res 70: 1645-1655. doi: 10.1158/0008-5472.CAN-09-2447
![]() |
[63] |
Boukerche H, Su ZZ, Prévot C, et al. (2008) Mda-9/Syntenin promotes metastasis in human melanoma cells by activating c-Src. Proc Natl Acad Sci USA 105: 15914-15919. doi: 10.1073/pnas.0808171105
![]() |
[64] | Kumar K, Sachdanandam P, Arivazhagan R (1991) Studies on the changes in plasma lipids and lipoproteins proteins in patients with benign and malignant breast cancer. Biochem Int 23: 581-589. |
[65] |
Damen J, Ramshorst JV, Hoeven RPV, et al. (1984) Alterations in plasma lipoprotein and heparin-releasable lipase activities in mice bearing the grsl ascites tumor. Biochim Biophys Acta 793: 287-296. doi: 10.1016/0005-2760(84)90331-X
![]() |
[66] |
Rengarajan T, Nandakumar N, Balasubramanian MP (2012) D-pinitol a low molecular cyclitol prevents 7, 12-dimethylbenz (a) anthracene induced experimental breast cancer through regulating anti-apoptotic protein Bcl-2, mitochondrial and carbohydrate key metabolizing enzymes. Biomed Prev Nutr 2: 25-30. doi: 10.1016/j.bionut.2011.11.001
![]() |
[67] |
Rawal LB, Tapp RJ, Williams ED, et al. (2012) Prevention of type 2 diabetes and its complications in developing countries: A review. Int J Behav Med 19: 121-133. doi: 10.1007/s12529-011-9162-9
![]() |
[68] |
Rathmann W, Giani G (2004) Global prevalence of diabetes: Estimates for the year 2000 and projections for 2030. Diabetes Care 27: 1047-1053. doi: 10.2337/diacare.27.10.2568
![]() |
[69] |
Zhang BB, Moller DE (2000) New approaches in the treatment of type 2 diabetes. Curr Opin Chem Biol 4: 461-467. doi: 10.1016/S1367-5931(00)00103-4
![]() |
[70] |
Buse JB (2011) Type 2 diabetes mellitus in 2010: Individualizing treatment targets in diabetes care. Nat Rev Endocrinol 7: 67-68. doi: 10.1038/nrendo.2010.230
![]() |
[71] |
Sivakumar S, Palsamy P, Subramanian SP (2010) Impact of D-pinitol on the attenuation of proinflammatory cytokines, hyperglycemia-mediated oxidative stress and protection of kidney tissue ultrastructure in streptozotocin-induced diabetic rats. Chem Biol Interact 188: 237-245. doi: 10.1016/j.cbi.2010.07.014
![]() |
[72] |
Geethan PK, Prince PS (2008) Antihyperlipidemic effect of D-pinitol on streptozotocin-induced diabetic Wistar rats. J Biochem Mol Toxicol 22: 220-224. doi: 10.1002/jbt.20218
![]() |
[73] | WHO Expert Committee on Diabetes Mellitus: Second Report (1980) World Health Organ Tech Rep Ser 646: 1-80. |
[74] |
Bates SH, Jones RB, Bailey CJ (2000) Insulin like effect of pinitol. Br J Pharmacol 130: 1944-1948. doi: 10.1038/sj.bjp.0703523
![]() |
[75] | Narayanan CR, Joshi DD, Mujumdar AM, et al. (1987) Pinitol, a new antidiabetic compound from the leaves of Bougainvillea pectabilis. Curr Sci 56: 139-141. |
[76] | Rastegar S, Soltani S, Roohipoor A, et al. (2017) Study of plants with D-chiro-inositol and its derivatives on diabetes. Int J Pharmacogn 4: 43-53. |
[77] |
Nascimento N, Cortez LU, Sousa LG, et al. (2014) Pinitol ameliorates impaired pressurenatriuresis in experimental diabetes. FASEB J 28: 1063-1065. doi: 10.1096/fasebj.28.1_supplement.1063.5
![]() |
[78] |
Sivakumar S, Palsamy P, Subramanian SP (2010) Attenuation of oxidative stress and alteration of hepatic tissue ultrastructure by D-pinitol in streptozotocin-induced diabetic rats. Free Radic Res 44: 668-678. doi: 10.3109/10715761003733901
![]() |
[79] |
Sivakumar S, Subramanian SP (2009) Pancreatic tissue protective nature of D-pinitol studied in streptozotocin-mediated oxidative stress in experimental diabetic rats. Eur J Pharmacol 622: 65-70. doi: 10.1016/j.ejphar.2009.09.021
![]() |
[80] |
Davis A, Christiansen M, Horowitz JF, et al. (2000) Effect of pinitol treatment on insulin action in subjects with insulin resistance. Diabetes Care 23: 1000-1005. doi: 10.2337/diacare.23.7.1000
![]() |
[81] |
Ortmeyer HK, Huang LC, Zhang L, et al. (1993) Chiroinositol deficiency and insulin resistance. Ⅱ. Acute effects of D-chiroinositol administration in streptozotocin diabetic rats, normal rats given a glucose load, and spontaneously insulin-resistant rhesus monkeys. Endocrinology 132: 646-651. doi: 10.1210/endo.132.2.8425484
![]() |
[82] |
Fonteles MC, Huang LC, Larner J (1996) Infusion of pH 2.0 D-chiroinositol glycan insulin putative mediator normalizes plasma glucose in streptozotocin diabetic rats at a dose equivalent to insulin without inducing hypoglycaemia. Diabetologia 39: 731-734. doi: 10.1007/BF00418546
![]() |
[83] |
Fonteles MC, Almeida MQ, Larner J (2000) Antihyperglycemic effects of 3-O-methyl-D-chiro-inositol and D-chiro-inositol associated with manganese in sterptozotocin diabetic rats. Horm Metab Res 32: 129-132. doi: 10.1055/s-2007-978606
![]() |
[84] |
Ortmeyer HK, Larner J, Hansen BC (1995) Effects of D-chiroinositol added to a meal on plasma glucose and insulin in hyperinsulinemic rhesus monkeys. Obes Res 3: 605S-608S. doi: 10.1002/j.1550-8528.1995.tb00232.x
![]() |
[85] |
Kang MJ, Kim JI, Yoon SY, et al. (2006) Pinitol from soybeans reduces postprandials blood glucose in patients with type 2 diabetes mellitus. J Med Food 9: 182-186. doi: 10.1089/jmf.2006.9.182
![]() |
[86] |
Dang NT, Mukai R, Yoshida K, et al. (2010) D-pinitol and myo-inositol stimulate translocation of glucose transporter 4 in skeletal muscle of C57BL/6 mice. Biosci Biotechnol Biochem 74: 1062-1067. doi: 10.1271/bbb.90963
![]() |
[87] |
Yu J, Choi S, Park ES, et al. (2012) D-chiro-inositol negatively regulates the formation of multinucleated osteoclasts by down-regulating NFATc1. J Clin Immunol 32: 1360-1371. doi: 10.1007/s10875-012-9722-z
![]() |
[88] |
Kim JI, Kim JC, Kang MJ, et al. (2005) Effects of pinitol isolated from soybeans on glycemic control and cardiovascular risk factors in patients with type 2 diabetes mellitus: A randomized controlled study. Eur J Clin Nutr 59: 456-458. doi: 10.1038/sj.ejcn.1602081
![]() |
[89] |
Kim MJ, Yoo KH, Kim JH, et al. (2007) Effect of pinitol on glucose metabolism and adipocytokines in uncontrolled type 2 diabetes. Diabetes Res Clin Pract 77: S247-S251. doi: 10.1016/j.diabres.2007.01.066
![]() |
[90] |
Kim HJ, Park KS, Lee SK, et al. (2012) Effects of pinitol on glycemic control, insulin resistance and adipocytokine levels in patients with type 2 diabetes mellitus. Ann Nutr Metab 60: 1-5. doi: 10.1159/000334834
![]() |
[91] |
Yap A, Nishiumi S, Yoshida KI, et al. (2007) Rat L6 myotubes as an in vitro model system to study GLUT4-dependent glucose uptake stimulated by inositol derivatives. Cytotechnology 55: 103-108. doi: 10.1007/s10616-007-9107-y
![]() |
[92] |
Larner J (2002) D-chiro-inositol its functional role in insulin action and its deficit in insulin resistance. Int J Exp Diabetes Res 3: 47-60. doi: 10.1080/15604280212528
![]() |
[93] |
Yamashita Y, Yamaoka M, Hasunuma T, et al. (2013) Detection of orally administered inositol stereoisomers in mouse blood plasma and their effects on translocation of glucose trasporter 4 in skeletal muscle cells. J Agric Food Chem 61: 4850-4854. doi: 10.1021/jf305322t
![]() |
[94] |
Hernández-Mijares A, Bañuls C, Peris JE, et al. (2013) A single acute dose of pinitol from a naturally-occurring food ingredient decreases hyperglycaemia and circulating insulin levels in healthy subjects. Food Chem 141: 1267-1272. doi: 10.1016/j.foodchem.2013.04.042
![]() |
[95] | Martin-Lomas M, Rademacher TW, Caro HN, et al. (2001) Alkylated inositolglycans and their use. Worldwide patent WO 0185747(A1). |
[96] | Ostlund RE, Sherman WR (1998) Pinitol and derivatives thereof for the treatment of metabolic disorders. United States patent US 5827896(A). |
[97] | Larner J, Price J, Picariello T, et al. (1997) Method of treating defective glucose metabolism using synthetic insulin substances. United States patent US 5652221(A). |
[98] | Koon MH (2013) Combination of pinitol and natural product for treating diabetes mellitus. Korean patent KR 20130017864(A). |
[99] | Koon MH (2013) Combination of pinitol and drug for treating diabetes mellitus. Korean patent KR 20130017859(A). |
[100] | Jun JG, Jun YJ, Kim JJ, et al. (2004) Use of chiro-inositol or pinitol for prevention of oxidative damage and prophylaxis composition for diabetic complications containing the chiro-inositol or pinitol. Korean patent KR 20040051455(A). |
[101] |
Holman GD, Kasuga M (1997) From receptor to transporter: Insulin signalling to glucose transport. Diabetologia 40: 991-1003. doi: 10.1007/s001250050780
![]() |
[102] |
White MF (1997) The insulin signaling system and IRS proteins. Diabetologia 40: S2-S17. doi: 10.1007/s001250051387
![]() |
[103] |
Huang LC, Fonteles MC, Houston DB, et al. (1993) Chiroinositol deficiency and insulin resistance. Ⅲ. Acute glycogenic and hypoglycemic effects of two inositol phospsoglycan insulin mediators in normal and streptozotocin diabetic rats. Endocrinology 132: 652-657. doi: 10.1210/endo.132.2.8425485
![]() |
[104] | PI3 Kinase/Akt Signaling Pathway, In: Cell Signaling Technology. Available from: https://www.cellsignal.com/contents/science-pathway-research-pi3k-akt-signaling-resources/pi3k-akt-signaling-pathway/pathways-akt-signaling. |
[105] |
Rahal A, Kumar A, Singh V, et al. (2014) Oxidative stress, pro-oxidants, and antioxidants: The interplay. Biomed Res Int 2014: 761264. doi: 10.1155/2014/761264
![]() |
[106] | Shin YC, Jeon YJ, Kim JJ (2007) Use of pinitol or chiroinositol for protecting the liver. United States patent US 2007098826 (A1). |
[107] |
Magielse J, Arcoraci T, Breynaert A, et al. (2013) Antihepatotoxic activity of a quantified desmodium adscendens decoction and D-pnitol against chemically-induced liver in rats. J Ethnopharmacol 146: 250-256. doi: 10.1016/j.jep.2012.12.039
![]() |
[108] |
Keppler D, Lesch R, Reutter W, et al. (1968) Experimental hepatitis induced by D-galactosamine. Exp Mol Pathol 9: 279-290. doi: 10.1016/0014-4800(68)90042-7
![]() |
[109] |
Beck G, Habicht GS (1996) Immunity and the invertebrates. Sci Am 275: 60-66. doi: 10.1038/scientificamerican1196-60
![]() |
[110] | Alexander P (1975) Tumour immunology in perspective, In: Schcultz J, Leiff RC. Eds., Critical factors in cancer immunology, New York: Academic Press, 213-222. |
[111] |
Katz A (1983) Immunobiologic staging of patients with carcinoma of the nad and neck. Laryngoscope 93: 445-463. doi: 10.1002/lary.1983.93.4.445
![]() |
[112] |
Gleich GJ, kita H (1997) Bronchial asthma: Lessons from murine models. Proc Natl Acad Sci USA 94: 2101-2102. doi: 10.1073/pnas.94.6.2101
![]() |
[113] |
Chauhan PS, Gupta KK, Bani S (2011) The immunosuppressive effects of Agyrolobium roseum and pinitol in experimental animals. Int Immunopharmacol 11: 286-291. doi: 10.1016/j.intimp.2010.11.028
![]() |
[114] |
Kim JC, Shin JY, Shin DH, et al. (2005) Synergistic anti-inflammatory effects of pinitol and glucosamine in rats. Phytother Res 19: 1048-1051. doi: 10.1002/ptr.1788
![]() |
[115] |
Lee JS, Lee CM, Jeong YI, et al. (2007) D-pinitol regulates Th1/Th2 balance via suppressing Th2 immune response in ovalbumin-induced asthma. FEBS Lett 581: 57-64. doi: 10.1016/j.febslet.2006.11.077
![]() |
[116] | Lee JS, Jung ID, Jeong YI, et al. (2007) D-pinitol inhibits Th1 polarization via the suppression of dendritic cells. Int Immunopharmacol 7: 79-804. |
[117] | Heo JC, Lee SH, Hwang YH, (2011) Extract of immuno-suppressive activities of pinitol isolated from soybean. Korean patent KR 20110116627(A). |
[118] | Yun YC, Choi CM, Jeon YJ, (2007) Composition for preventing and treating inflammatory disease comprising glucosamine and Pinitol. Korean patent KR 20070002401(A). |
[119] |
Goltzman D (2002) Discoveries, drugs and skeletal disorders. Nat Rev Drug Discov 1: 784-796. doi: 10.1038/nrd916
![]() |
[120] |
Rodan GA, Martin TJ (2000) Therapeutic approaches to bone diseases. Science 289: 1508-1514. doi: 10.1126/science.289.5484.1508
![]() |
[121] | Jaerang R, Hyeon-Koon M (2010) Composition for prevention or treatment of bone metabolism disorder comprising d-pinitol as an active ingredient. Chinese patent CN 101808628(A). |
[122] |
Kirkwood TB, Austad SN (2000) Why do we age? Nature 408: 233-238. doi: 10.1038/35041682
![]() |
[123] |
Hada B, Yoo MR, Seong KM, et al. (2013) D-chiro-inositol and pinitol extend the life span of Drosophila Melanogaster. J Gerontol 68: 226-234. doi: 10.1093/gerona/gls156
![]() |
[124] | Fontana L, Partridge L, Longo V (2010) Science 328: 321-326. |
[125] |
Bartke A, Chandrashekar V, Dominici F, et al. (2003) Insulin-like growth fact 1 (IGF-1) and aging: Controversies and new insights. Biogerontology 4: 1-8. doi: 10.1023/A:1022448532248
![]() |
[126] | Van-Heemst D (2010) Insulin, IGF-1 and logevity. Aging Dis 1: 147-157. |
[127] |
Chung HY, Kim HJ, Kim JW, et al. (2001) The inflammation hypothesis of aging: Molecular modulation by calorie restriction. Ann N Y Acad Sci 928: 327-335. doi: 10.1111/j.1749-6632.2001.tb05662.x
![]() |
[128] | Ishida M, Suzuki T, Tsuji A (2015) Biological clock adjusting agent. Japanese patent JP 2015140305(A). |
[129] | Choi SK, Park KD, Kim DA, et al. (2013) Preparation method for Ceratonia siliqua fruit extract and cosmetic composition for anti-aging comprising the same. Korean patent KR 101339915(B1). |
[130] | Choi SK, Park KD, Kim DA, et al. (2015) Cosmetic composition for anti-aging comprising Ceratonia siliqua fruit extract. Korean patent KR 20150060004(A). |
[131] |
Barcelos RP, Stefanello ST, Mauriz JL, et al. (2016) Creatine and the liver: Metabolism and possible interactions. Mini Rev Med Chem 16: 12-18. doi: 10.2174/1389557515666150722102613
![]() |
[132] |
Cooper R, Naclerio F, Allgrove J, et al. (2012) Creatine supplementation with specific view to exercise/sports performance: An update. J Int Soc Sports Nutr 9: 1-11. doi: 10.1186/1550-2783-9-33
![]() |
[133] | Greenwood M, Kreider RB, RasMussen C, et al. (2001) D-pinitol augments whole body creatine retention in man. J Exerc Physiol Online 4: 41-47. |
[134] | Cooke MB, Cribb PJ (2015) Effective nutritional supplement combinations, In: Greenwood M, Cooke MC, Ziegenfuss T, Kalman DS, Jose-Antonio Eds., Nutritional Supplements in Sports and Exercise, 2nd ed., Switzerland: Springer. |
[135] | Chantler S, Smit K (2015) Pinitol, In: Castell LM, Stear SJ, Burke LM Eds., Nutritional Supplements in Sport, Exercise and Health: An A-Z Guide, London and New York: Routledge-Taylor & Francis Group. |
[136] |
Kerksick CM, Wilborn CD, Campbell WI, et al. (2009) The effects of creatine monohydrate supplementation with and without D-pinitol on resistance training adaptations. J Strength Cond Res 23: 2673-2682. doi: 10.1519/JSC.0b013e3181b3e0de
![]() |
[137] | Dykstra JC (2001) A combination of pinitol and creatine to enhance uptake and retention of creatine. Worldwide patent WO 0180853(A1). |
[138] | Heuer MA, Clement K, Chaudhuri S (2008) Composition and method for enhancing or promoting the activity of insulin, enhancing skeletal muscle growth, reducing skeletal muscle loss, and increasing the energy supply to skeletal muscle. Worldwide patent WO 2008025116(A1). |
[139] | Weeks C (2003) Stimulating transport of glucose into animal administration of pinitol. United States patent US 6518318. |
[140] | Ferrante RM, Cunnigham CK (2012) Performance enhancing composition and method of delivering nutrients. United States patent US 2012100247(A1). |
[141] | Ferrante RM, Cunnigham CK (2012) Performance enhancing compositions and method of delivering nutrients. United States patent US 2012100120(A1). |
[142] | Ferrante RM, Cunnigham CK (2015) Performance enhancing composition and method of delivering nutrients. United States patent US 2015196579(A1). |
[143] | Heuer MA, Clement K, Chaudhuri S (2008) Composition and method for enhancing or promoting the activity of insulin, enhancing skeletal muscle growth, reducing skeletal muscle loss, and increasing the energy supply to skeletal muscle. United States patent US 2008058254(A1). |
[144] | Dykstra JC, Prairie E (2003) Combination of pinitol and creatine to enhance uptake and retention of creatine. United States patent US 2003212134(A1). |
[145] | Heuer MA, Clement K, Chaudhuri S (2008) Composition and method for enhancing or promoting the activity of insulin, enhancing skeletal muscle growth, reducing skeletal muscle loss, and increasing the energy supply to skeletal muscle. Canadian patent CA 2558110(A1). |
[146] |
Folch J, Petrov D, Ettcheto M, et al. (2016) Current research therapeutic strategies for Alzheimer's disease treatment. Neural Plast 2016: 1-15. doi: 10.1155/2016/8501693
![]() |
[147] |
Pitt J, Thorner M, Brautigan D, et al. (2013) Protection against the synaptic targeting and toxicity of Alzheimer's-associated Aβ oligomers by insulin mimetic chiro-inositols. FASEB J 27: 199-207. doi: 10.1096/fj.12-211896
![]() |
[148] |
Wischik CM, Harrington CR, Storey JMD (2014) Tau-aggregation inhibitor therapy for Alzheimer's disease. Biochem Pharmacol 88: 529-539. doi: 10.1016/j.bcp.2013.12.008
![]() |
[149] |
Shea TB, Remington R (2015) Nutritional supplementation for Alzheimer's disease? Curr Opin Psychiatry 28: 141-147. doi: 10.1097/YCO.0000000000000138
![]() |
[150] |
Amirrad F, Bousoik E, Shamloo K, et al. (2017) Alzheimer's disease: Dawm of a new era? J Pharm Pharm Sci 20: 184-225. doi: 10.18433/J3VS8P
![]() |
[151] |
Hung SY, Fu WM (2017) Drug candidates in clinical trials for Alzheimer's disease. J Biomed Sci 24: 1-12. doi: 10.1186/s12929-016-0310-z
![]() |
[152] | Acton QA (2013) Therapies and treatments, In: Neurodegenerative diseases: New insights for the healthcare professional, Georgia: ScholarlyEditions, 203-204. |
[153] | Yates P, Woodward M (2017) Drug treatments in development for Alzheimer's disease, In: Ames D, O'Brien JT, Burns A. Editors, Dementia, 5 Eds., New York: CRC Press, 559. |
[154] | Pasinetti GM (2006) Compositions and methods for treating Alzheimer's disease and related disorders and promoting a healthy nervous system. United States patent US 2006/0111450A1. |
[155] | Pasinetti GM (2013) Compositions and methods for treating Alzheimer's disease and related disorders and promoting a healthy nervous system. United States patent US 2013/0123370A1. |
[156] | McLaurin J (2010) Methods of preventing, treating and diagnosing disorders of protein aggregation. European patent EU 2153829A1. |
[157] | Available from: a) https://clinicaltrials.gov/ct2/show/NCT00470418. b) Available from: https://clinicaltrials.gov/ct2/show/NCT01928420. |
[158] |
Falshaw A, Hart JB, Tyler PC (2000) New synthesis of 1 d-and 1 L-1, 2-anhydro-myo-inositol and assessment of their glycosidase inhibitory activities. Carbohydr Res 329: 301-308. doi: 10.1016/S0008-6215(00)00192-0
![]() |
[159] |
Zhan T, Lou H (2007) Synthesis of azole nucleoside analogues of D-pinitol as potential antitumor agents. Carbohydr Res 342: 865-869. doi: 10.1016/j.carres.2007.01.004
![]() |
[160] |
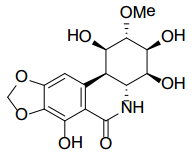
Li M, Wu A, Zhou P (2006) A concise synthesis of (+)-pancratistatin using pinitol as a chiral building blog. Tetrahedron Lett 47: 3707-3710. doi: 10.1016/j.tetlet.2006.03.138
![]() |
[161] |
Tegge W, Ballou CE (1989) Chiral synthesis of D-and L-myo-inositol 1, 4, 5-triphosphate. Proc Natl Acad Sci USA 86: 94-98. doi: 10.1073/pnas.86.1.94
![]() |
[162] |
Ballou CE, Fischer HOL (1953) Derivatives of D-mannohexodialdose (6-aldo-D-Mannose). J Am Chem Soc 75: 3673-3675. doi: 10.1021/ja01111a020
![]() |
1. | Runxin Fang, Yang Li, Yanjuan Zhang, Qiang Chen, Quanjun Liu, Zhiyong Li, Impact of left atrial appendage location on risk of thrombus formation in patients with atrial fibrillation, 2021, 1617-7959, 10.1007/s10237-021-01454-4 | |
2. | Alejandro Gonzalo, Manuel García‐Villalba, Lorenzo Rossini, Eduardo Durán, Davis Vigneault, Pablo Martínez‐Legazpi, Oscar Flores, Javier Bermejo, Elliot McVeigh, Andrew M. Kahn, Juan C. del Alamo, Non‐Newtonian blood rheology impacts left atrial stasis in patient‐specific simulations , 2022, 38, 2040-7939, 10.1002/cnm.3597 | |
3. | Pedro Morais, Dominik Nelles, Vivian Vij, Baravan Al-Kassou, Marcel Weber, Georg Nickenig, Jan Wilko Schrickel, João L. Vilaça, Alexander Sedaghat, Assessment of LAA Strain and Thrombus Mobility and Its Impact on Thrombus Resolution—Added-Value of a Novel Echocardiographic Thrombus Tracking Method, 2022, 13, 1869-408X, 950, 10.1007/s13239-022-00629-z | |
4. | YiRen Sun, Yunfei Ling, Zijia Chen, Zhengjie Wang, Tao Li, Qi Tong, Yongjun Qian, Finding low CHA2DS2-VASc scores unreliable? Why not give morphological and hemodynamic methods a try?, 2023, 9, 2297-055X, 10.3389/fcvm.2022.1032736 | |
5. | Lida Alinezhad, Farzan Ghalichi, Majid Ahmadlouydarab, Maryam Chenaghlou, Left atrial appendage shape impacts on the left atrial flow hemodynamics: A numerical hypothesis generating study on two cases, 2022, 213, 01692607, 106506, 10.1016/j.cmpb.2021.106506 | |
6. | Wen-Jing Xiang, Jia-Dong Huo, Wei-Tao Wu, Peng Wu, Influence of Inlet Boundary Conditions on the Prediction of Flow Field and Hemolysis in Blood Pumps Using Large-Eddy Simulation, 2023, 10, 2306-5354, 274, 10.3390/bioengineering10020274 | |
7. | Ahmed Qureshi, Gregory Y. H. Lip, David A. Nordsletten, Steven E. Williams, Oleg Aslanidi, Adelaide de Vecchi, Imaging and biophysical modelling of thrombogenic mechanisms in atrial fibrillation and stroke, 2023, 9, 2297-055X, 10.3389/fcvm.2022.1074562 | |
8. | Kan Huang, Haitao Wen, Canjun Liu, Association Between Ischemic Stroke and Left Atrial Appendage Morphology in Patients With Atrial Fibrillation and Low CHA2DS2-VASc Scores, 2022, 49, 1526-6702, 10.14503/THIJ-20-7544 | |
9. | Lianru Zang, Kaihao Gu, Xingkai Ji, Hao Zhang, Shengjie Yan, Xiaomei Wu, Comparative Analysis of Temperature Rise between Convective Heat Transfer Method and Computational Fluid Dynamics Method in an Anatomy-Based Left Atrium Model during Pulsed Field Ablation: A Computational Study, 2023, 10, 2308-3425, 56, 10.3390/jcdd10020056 | |
10. | Runxin Fang, Yang Li, Jun Wang, Zidun Wang, John Allen, Chi Keong Ching, Liang Zhong, Zhiyong Li, Stroke risk evaluation for patients with atrial fibrillation: Insights from left atrial appendage, 2022, 9, 2297-055X, 10.3389/fcvm.2022.968630 | |
11. | Runxin Fang, Zidun Wang, Xie Zhao, Jun Wang, Yang Li, Yanjuan Zhang, Qiang Chen, Jiaqiu Wang, Quanjun Liu, Minglong Chen, Zhiyong Li, Stroke risk evaluation for patients with atrial fibrillation: Insights from left atrial appendage with fluid-structure interaction analysis, 2022, 148, 00104825, 105897, 10.1016/j.compbiomed.2022.105897 | |
12. | Kaihao Gu, Shengjie Yan, Xiaomei Wu, Influence of pulsating intracardiac blood flow on radiofrequency catheter ablation outcomes in an anatomy-based atrium model, 2022, 39, 0265-6736, 1064, 10.1080/02656736.2022.2108149 | |
13. | Jordi Mill, Victor Agudelo, Andy L. Olivares, Maria Isabel Pons, Etelvino Silva, Marta Nuñez-Garcia, Xabier Morales, Dabit Arzamendi, Xavier Freixa, Jérôme Noailly, Oscar Camara, Sensitivity Analysis of In Silico Fluid Simulations to Predict Thrombus Formation after Left Atrial Appendage Occlusion, 2021, 9, 2227-7390, 2304, 10.3390/math9182304 | |
14. | Yonghui Qiao, Kun Luo, Jianren Fan, Computational Prediction of Thrombosis in Food and Drug Administration’s Benchmark Nozzle, 2022, 13, 1664-042X, 10.3389/fphys.2022.867613 | |
15. | Mattia Corti, Alberto Zingaro, Luca Dede’, Alfio Maria Quarteroni, Impact of atrial fibrillation on left atrium haemodynamics: A computational fluid dynamics study, 2022, 150, 00104825, 106143, 10.1016/j.compbiomed.2022.106143 | |
16. | Lianru Zang, Kaihao Gu, Xingkai Ji, Hao Zhang, Shengjie Yan, Xiaomei Wu, Effect of Anisotropic Electrical Conductivity Induced by Fiber Orientation on Ablation Characteristics of Pulsed Field Ablation in Atrial Fibrillation Treatment: A Computational Study, 2022, 9, 2308-3425, 319, 10.3390/jcdd9100319 | |
17. | Ehsan Khalili, Cécile Daversin‐Catty, Andy L. Olivares, Jordi Mill, Oscar Camara, Kristian Valen‐Sendstad, On the importance of fundamental computational fluid dynamics toward a robust and reliable model of left atrial flows, 2024, 40, 2040-7939, 10.1002/cnm.3804 | |
18. | Carlos Albors, Andy L. Olivares, Xavier Iriart, Hubert Cochet, Jordi Mill, Oscar Camara, 2023, Chapter 50, 978-3-031-35301-7, 485, 10.1007/978-3-031-35302-4_50 | |
19. | Henrik A. Kjeldsberg, Carlos Albors, Jordi Mill, David Viladés Medel, Oscar Camara, Joakim Sundnes, Kristian Valen‐Sendstad, Impact of left atrial wall motion assumptions in fluid simulations on proposed predictors of thrombus formation, 2024, 40, 2040-7939, 10.1002/cnm.3825 | |
20. | Yan Wang, Buyun Xu, Kun Luo, Jianren Fan, Meixiang Xiang, The impact of left atrial morphology on thrombosis risk in atrial fibrillation, 2024, 36, 1070-6631, 10.1063/5.0214185 | |
21. | Qi Gao, Hongtao Lin, Jianghong Qian, Xingli Liu, Shengze Cai, He Li, Hongguang Fan, Zhe Zheng, A deep learning model for efficient end-to-end stratification of thrombotic risk in left atrial appendage, 2023, 126, 09521976, 107187, 10.1016/j.engappai.2023.107187 | |
22. | Jordi Mill, Josquin Harrison, Marta Saiz-Vivo, Carlos Albors, Xabier Morales, Andy L. Olivares, Xavier Iriart, Hubert Cochet, Jerome Noailly, Maxime Sermesant, Oscar Camara, The role of the pulmonary veins on left atrial flow patterns and thrombus formation, 2024, 14, 2045-2322, 10.1038/s41598-024-56658-2 | |
23. | Lan Ge, Yawei Xu, Jun Li, Yuan Li, Yifeng Xi, Xinyan Wang, Jing Wang, Yang Mu, Hongsen Wang, Xu Lu, Jun Guo, Zengsheng Chen, Tao Chen, Yundai Chen, The impact of contrast retention on thrombus formation risks in patients with atrial fibrillation: A numerical study, 2024, 10, 24058440, e26792, 10.1016/j.heliyon.2024.e26792 | |
24. | Sara Valvez, Manuel Oliveira-Santos, Ana P. Piedade, Lino Gonçalves, Ana M. Amaro, Computational Flow Dynamic Analysis in Left Atrial Appendage Thrombus Formation Risk: A Review, 2023, 13, 2076-3417, 8201, 10.3390/app13148201 | |
25. | Alberto Zingaro, Zan Ahmad, Eugene Kholmovski, Kensuke Sakata, Luca Dede’, Alan K. Morris, Alfio Quarteroni, Natalia A. Trayanova, A comprehensive stroke risk assessment by combining atrial computational fluid dynamics simulations and functional patient data, 2024, 14, 2045-2322, 10.1038/s41598-024-59997-2 | |
26. | Runxin Fang, Zidun Wang, Jiaqiu Wang, Jiayu Gu, Geman Yin, Qiang Chen, Xunrong Xia, Zhiyong Li, Patient-specific pulmonary venous flow characterization and its impact on left atrial appendage thrombosis in atrial fibrillation patients, 2024, 257, 01692607, 108428, 10.1016/j.cmpb.2024.108428 | |
27. | Åshild Telle, Clarissa Bargellini, Yaacoub Chahine, Juan C. Del Álamo, Nazem Akoum, Patrick M Boyle, Personalized biomechanical insights in atrial fibrillation: opportunities & challenges, 2023, 21, 1477-9072, 817, 10.1080/14779072.2023.2273896 | |
28. | João Loures Salinet, ĺtalo Sandoval Ramos de Oliveira, John Andrew Sims, João Lameu, 2023, Chapter 7, 978-3-031-38742-5, 107, 10.1007/978-3-031-38743-2_7 | |
29. | Yanlu Chen, Buyun Xu, Yuzhou Cheng, Kun Luo, Jianren Fan, Meixiang Xiang, Hemodynamic differences caused by left atrial appendage modeling contours, 2023, 35, 1070-6631, 10.1063/5.0172261 | |
30. | Ahmed Qureshi, Paolo Melidoro, Maximilian Balmus, Gregory Y.H. Lip, David A. Nordsletten, Steven E. Williams, Oleg Aslanidi, Adelaide de Vecchi, MRI-based modelling of left atrial flow and coagulation to predict risk of thrombogenesis in atrial fibrillation, 2025, 101, 13618415, 103475, 10.1016/j.media.2025.103475 | |
31. | Henrik Aasen Kjeldsberg, Renate B. Schnabel, Joakim Sundnes, Kristian Valen-Sendstad, Estimation of inlet flow rate in simulations of left atrial flows: A proposed optimized and reference-based algorithm with application to sinus rhythm and atrial fibrillation, 2025, 00219290, 112594, 10.1016/j.jbiomech.2025.112594 |
Hyper-Parameters | Qty |
Input size (lag) | 15 (225 min) |
Batch size | 8 |
Kernel size of Conv1d | 1 × 3 |
Dilation step of Conv1d | 2 |
Layers of Conv1d | 3 |
Layers of LSTM | 3 |
Dropout rate of LSTM | 0.2 |
Hidden size of LSTM | 64 |
MAE | MSE | RMSE | R2 | |
MLP | 4.531 | 66.575 | 8.159 | 0.898 |
RNN | 4.297 | 65.321 | 8.082 | 0.899 |
GRU | 4.414 | 65.948 | 8.121 | 0.901 |
LSTM | 4.154 | 63.264 | 7.954 | 0.903 |
SGRU | 4.263 | 63.482 | 7.967 | 0.903 |
SLSTM | 4.145 | 62.287 | 7.892 | 0.905 |
DSGRU | 3.872 | 62.400 | 7.899 | 0.905 |
DSLSTM | 3.728 | 59.094 | 7.687 | 0.910 |