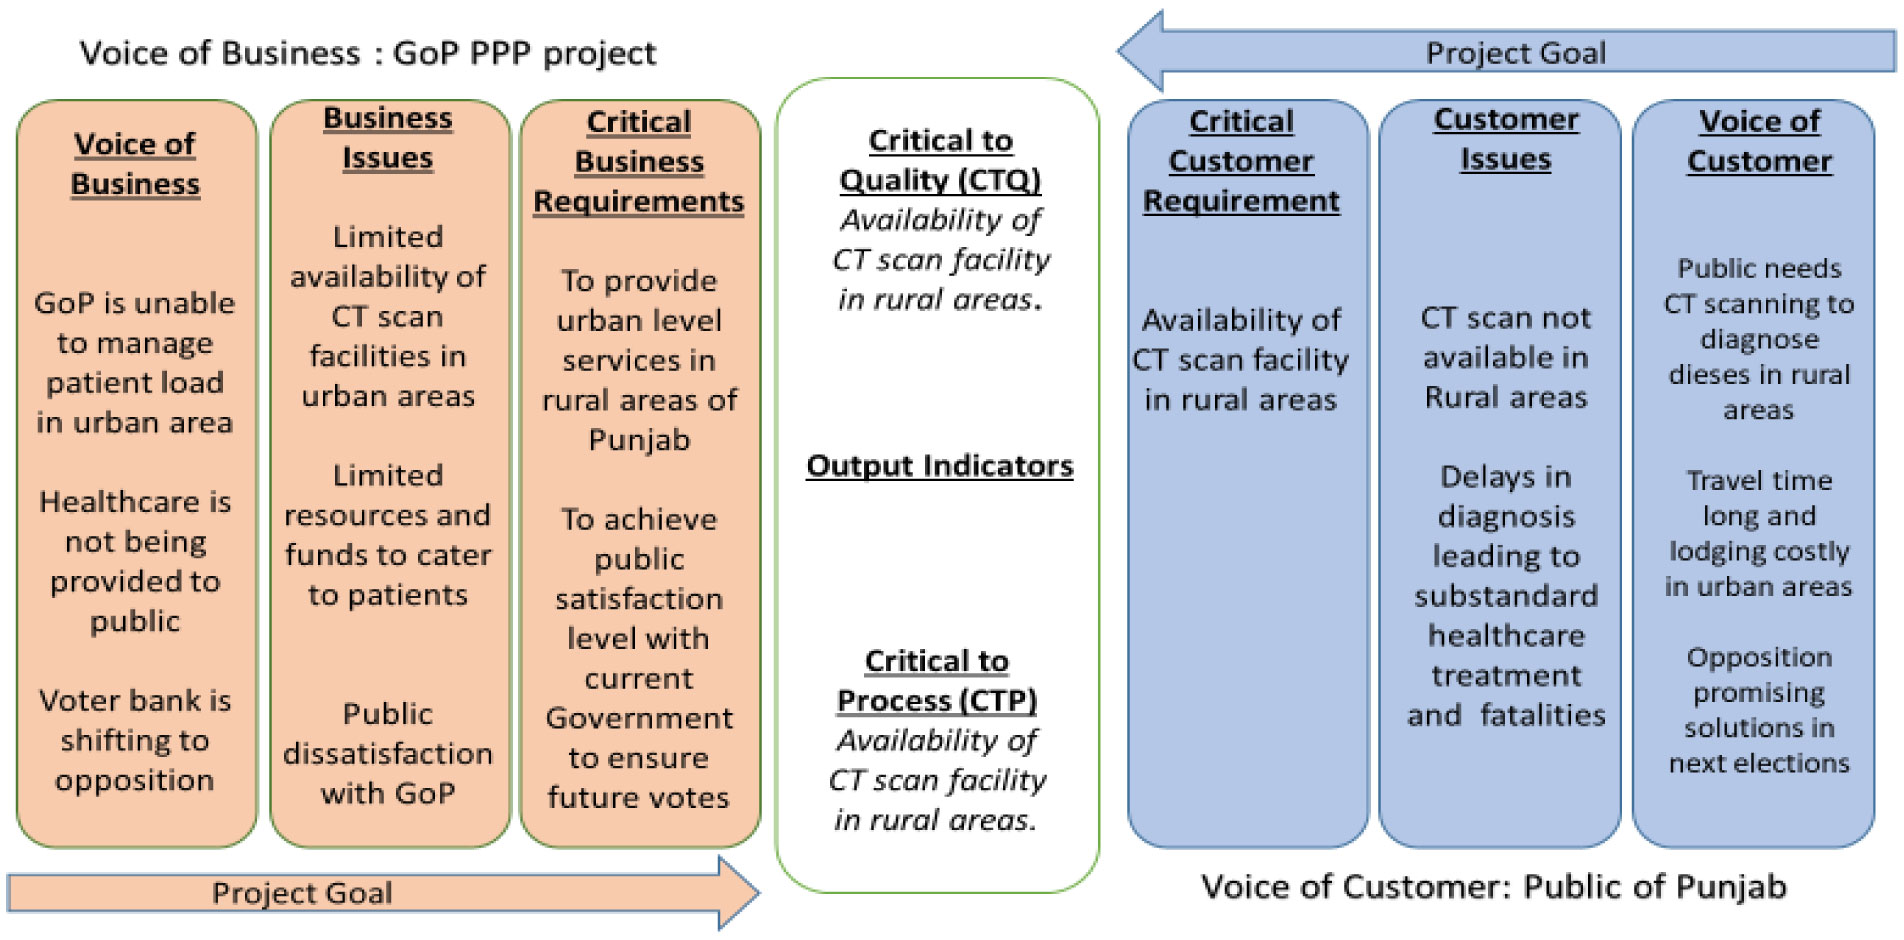
The health care delivery system in Pakistan is in a process of rapid growth, and it consists of public and private sectors. The provincial government is preliminarily responsible for providing health care facilities within its province except in federally administered areas. In Pakistan, there are three tiers of governmental healthcare delivery systems, which comprise government, semi-government, and parastatal organizations. The purpose of this study is to understand the rapid increase in influx of patients in major city hospitals of the Punjab province. The reasons for patient flow towards the major city areas can vary, but our point of focus is mainly on those patients who are prescribed to get a computed tomography (CT) scan done for better diagnosis and early treatment, including but not limited to roadside accident cases. The study targets the define, measure, analyze, improve and control (DMAIC) problem solving approach to assess the potential cause of CT patient flow and the challenges that the health department is facing to cater to such a patient niche and process while minimizing the congestion in city government hospitals. The approach in this study summarizes with numerous quality tools like Voice of Customer (VOC) which is customer feedback, Customer Output Process Input and Supplier (COPIS) processes use for high-level process map to know what your customer value, Approver Resource Member Interested (ARMI) chart which is use to analyze the stakeholders on management of the project, evaluation with the help of fishbone diagram and house of quality, and for process improvement methodology we use the team brainstorming technique and the kaizen 5-why technique. The technique came up with an idea of a public-private partnership (PPP) project—partnership between public agency and private firm, as the health care industry in Punjab province is going through budgetary issues. In a PPP project, the Government will allocate the space to a private firm to build the facility on their own and provide quality service for CT scan diagnosis to the public of Punjab. The study identified the top 10 critical factors that the patients have expected from the government to be provided on priority. The Kaizen process improvement methodology has been adopted to provide the possible solution of government budgetary issues. The set of tools in this study can be adopted by other PPP projects to enhance the project performance.
Citation: Muhammad Mutasim Billah Tufail, Asad Shamim, Asghar Ali, Muhammad Ibrahim, Danial Mehdi, Waseem Nawaz. DMAIC methodology for achieving public satisfaction with health departments in various districts of Punjab and optimizing CT scan patient load in urban city hospitals[J]. AIMS Public Health, 2022, 9(2): 440-457. doi: 10.3934/publichealth.2022030
The health care delivery system in Pakistan is in a process of rapid growth, and it consists of public and private sectors. The provincial government is preliminarily responsible for providing health care facilities within its province except in federally administered areas. In Pakistan, there are three tiers of governmental healthcare delivery systems, which comprise government, semi-government, and parastatal organizations. The purpose of this study is to understand the rapid increase in influx of patients in major city hospitals of the Punjab province. The reasons for patient flow towards the major city areas can vary, but our point of focus is mainly on those patients who are prescribed to get a computed tomography (CT) scan done for better diagnosis and early treatment, including but not limited to roadside accident cases. The study targets the define, measure, analyze, improve and control (DMAIC) problem solving approach to assess the potential cause of CT patient flow and the challenges that the health department is facing to cater to such a patient niche and process while minimizing the congestion in city government hospitals. The approach in this study summarizes with numerous quality tools like Voice of Customer (VOC) which is customer feedback, Customer Output Process Input and Supplier (COPIS) processes use for high-level process map to know what your customer value, Approver Resource Member Interested (ARMI) chart which is use to analyze the stakeholders on management of the project, evaluation with the help of fishbone diagram and house of quality, and for process improvement methodology we use the team brainstorming technique and the kaizen 5-why technique. The technique came up with an idea of a public-private partnership (PPP) project—partnership between public agency and private firm, as the health care industry in Punjab province is going through budgetary issues. In a PPP project, the Government will allocate the space to a private firm to build the facility on their own and provide quality service for CT scan diagnosis to the public of Punjab. The study identified the top 10 critical factors that the patients have expected from the government to be provided on priority. The Kaizen process improvement methodology has been adopted to provide the possible solution of government budgetary issues. The set of tools in this study can be adopted by other PPP projects to enhance the project performance.

| [1] | Sotirios E, Panagiotis A, Konstantinos K, et al. (2020) The impact of radiation protection training on the radiological safety and the related culture of exposed workers in Greece. J Radiol Prot 40: 997-1009. https://doi.org/10.1088/1361-6498/abaf3e |
| [2] | Kumar BS, Debasis D, Abinash A, et al. (2011) Clinico-pathological profile of lung cancer in a tertiary medical centre in India: Analysis of 266 cases. J Dent Oral Hyg 3: 30-33. |
| [3] | World Bank GroupSustainable industrial development in Punjab, Pakistan (2019). ahttps://doi.org/10.1596/32119 |
| [4] | Callen M, Gulzar S, Hasanain A, et al. (2013) Improving public health delivery in Punjab, Pakistan: Issues and opportunities. Lahore J Econ 18: 249. https://doi.org/10.35536/lje.2013.v18.isp.a11 |
| [5] | Furterer SL (2014) Lean six sigma case studies in the healthcare enterprise. Springer London. https://doi.org/10.1007/978-1-4471-5583-6 |
| [6] | Arafeh M, Barghash MA, Haddad N, et al. (2018) Using six sigma DMAIC methodology and discrete event simulation to reduce patient discharge time in King Hussein cancer center. J Healthc Eng . https://doi.org/10.1155/2018/3832151 |
| [7] | Tufail MMB, Shakeel M, Sheikh F, et al. (2021) Implementation of lean Six-Sigma project in enhancing health care service quality during COVID-19 pandemic. AIMS Public Health 8: 704. https://doi.org/10.3934/publichealth.2021056 |
| [8] | Young T, McClean S (2009) Some challenges facing Lean Thinking in healthcare. Int J Qual Health Care 21: 309-310. https://doi.org/10.1093/intqhc/mzp038 |
| [9] | Joosten T, Bongers I, Janssen R (2009) Application of lean thinking to health care: issues and observations. Int J Qual Health Care 21: 341-347. https://doi.org/10.1093/intqhc/mzp036 |
| [10] | Improta G, Guizzi G, Ricciardi C, et al. (2020) Agile six sigma in healthcare: Case study at santobono pediatric hospital. Int J Environ Res Public Health 17: 1052. https://doi.org/10.3390/ijerph17031052 |
| [11] | Sorrentino A, Scala A, Fiorillo A, et al. (2020) Six sigma approach for a first evaluation of a pharmacological therapy in tongue cancer. Cham, Switzerland: European Medical and Biological Engineering Conference, Springer International Publishing 1028-1037. https://doi.org/10.1007/978-3-030-64610-3_115 |
| [12] | Scala A, Ponsiglione AM, Loperto I, et al. (2021) Lean six sigma approach for reducing length of hospital stay for patients with femur fracture in a university hospital. Int J Environ Res Public Health 18: 2843. https://doi.org/10.3390/ijerph18062843 |
| [13] | Bhandari P, Badar MA, Childress V COVID-19 Surge planning in response to global pandemic in a healthcare setting: a lean six sigma approach (2021). |
| [14] | Ponsiglione AM, Ricciardi C, Scala A, et al. (2021) Application of DMAIC cycle and modeling as tools for health technology assessment in a university hospital. J Healthc Eng . https://doi.org/10.1155/2021/8826048 |
| [15] | Ponsiglione AM, Ricciardi C, Improta G, et al. (2021) A Six Sigma DMAIC methodology as a support tool for Health Technology Assessment of two antibiotics. Math Biosci Eng 18: 3469-3490. https://doi.org/10.3934/mbe.2021174 |
| [16] | Sá JC, Vaz S, Carvalho O, et al. (2022) A model of integration ISO 9001 with Lean six sigma and main benefits achieved. Total Qual Manag Bus 33: 218-242. https://doi.org/10.1080/14783363.2020.1829969 |
| [17] | Verma N, Sharma V, Badar MA (2021) Entropy-based lean, energy and six sigma approach to achieve sustainability in manufacturing system. Arab J Sci Eng 46: 8105-8117. https://doi.org/10.1007/s13369-021-05826-x |
| [18] | Ahmed S (2019) Integrating DMAIC approach of Lean Six Sigma and theory of constraints toward quality improvement in healthcare. Rev Environ Health 34: 427-434. https://doi.org/10.1515/reveh-2019-0003 |
| [19] | Verma N, Sharma V, Badar MA (2021) Improving sigma level of galvanization process by zinc over-coating reduction using an integrated Six Sigma and design-of-experiments approach. Arab J Sci Eng : 1-15. https://doi.org/10.1007/s13369-021-06341-9 |
| [20] | De Mast J, Lokkerbol J (2012) An analysis of the Six Sigma DMAIC method from the perspective of problem solving. Int J Prod Econ 139: 604-614. https://doi.org/10.1016/j.ijpe.2012.05.035 |
| [21] | Ramakrishnan S, Nagarkar K, DeGennaro M, et al. A study of the CT scan area of a healthcare provider (2004)2: 2025-2031. |
| [22] | Sokovic M, Pavletic D, Pipan KK (2010) Quality improvement methodologies–PDCA cycle, RADAR matrix, DMAIC and DFSS. J Achiev Mater Manuf Eng 43: 476-483. |
| [23] | Rese A, Sänn A, Homfeldt F (2015) Customer integration and voice-of-customer methods in the German automotive industry. Int J Auto Tech Manag 15: 1-19. https://doi.org/10.1504/IJATM.2015.067089 |
| [24] | Prístavka M, Bujna M (2013) Use of statistical methods in quality control. Acta Technol Agr 16: 35-38. https://doi.org/10.2478/ata-2013-0009 |
| [25] | Adzrie M, Armi M (2021) The awareness of lean manufacturing implemented practices in SME in Sabah State: TQM and TPM practices approach. Journal of Physics: Conference Series . IOP Publishing 012002. https://doi.org/10.1088/1742-6596/1878/1/012002 |
| [26] | Srinivasan K, Muthu S, Devadasan SR, et al. (2014) Enhancing effectiveness of shell and tube heat exchanger through six sigma DMAIC phases. Procedia Eng 97: 2064-2071. https://doi.org/10.1016/j.proeng.2014.12.449 |
| [27] | Sharma P, Malik SC, Gupta A, et al. (2018) A DMAIC Six Sigma approach to quality improvement in the anodising stage of the amplifier production process. Int J Qual Reliab Ma . https://doi.org/10.1108/IJQRM-08-2017-0155 |
| [28] | Carroll CT (2013) Six Sigma for powerful improvement: A green belt DMAIC training system with software tools and a 25-lesson Course. CRC Press. |


Figures(8) / Tables(8)

Muhammad Mutasim Billah Tufail, Asad Shamim, Asghar Ali, Muhammad Ibrahim, Danial Mehdi, Waseem Nawaz. DMAIC methodology for achieving public satisfaction with health departments in various districts of Punjab and optimizing CT scan patient load in urban city hospitals[J]. AIMS Public Health, 2022, 9(2): 440-457. doi: 10.3934/publichealth.2022030


 DownLoad: