
Figure 1.
The distribution of pliek-u processors in Aceh, Sumatra Island.


Citation: Scott Rollo, Anca Gaston, Harry Prapavessis. Cognitive and Motivational Factors Associated with Sedentary Behavior: A Systematic Review[J]. AIMS Public Health, 2016, 3(4): 956-984. doi: 10.3934/publichealth.2016.4.956
| [1] | Budi Suarti, Sukarno, Ardiansyah, Slamet Budijanto . Bio-active compounds, their antioxidant activities, and the physicochemical and pasting properties of both pigmented and non-pigmented fermented de-husked rice flour. AIMS Agriculture and Food, 2021, 6(1): 49-64. doi: 10.3934/agrfood.2021004 |
| [2] | María Cámara-Ruiz, José María García Beltrán, Francisco Antonio Guardiola, María Ángeles Esteban . In vitro and in vivo effects of purslane (Portulaca oleracea L.) on gilthead seabream (Sparus aurata L.). AIMS Agriculture and Food, 2020, 5(4): 799-824. doi: 10.3934/agrfood.2020.4.799 |
| [3] | Nelson Mpumi, Revocatus L. Machunda, Kelvin M. Mtei, Patrick A. Ndakidemi . Insecticidal Efficacy of Syzygium aromaticum, Tephrosia vogelii and Croton dichogamus Extracts against Plutella xylostella and Trichoplusia ni on Brassica oleracea crop in Northern Tanzania. AIMS Agriculture and Food, 2021, 6(1): 185-202. doi: 10.3934/agrfood.2021012 |
| [4] | Dody Dwi Handoko, Anisa Maharani Kaseh, Laras Cempaka, Wahyudi David, Bram Kusbiantoro, Afifah Zahra Agista, Yusuke Ohsaki, Hitoshi Shirakawa, Ardiansyah . Effects of household-scale cooking on volatile compounds, sensory profile, and hypotensive effect of Kenikir (Cosmos caudatus). AIMS Agriculture and Food, 2023, 8(1): 198-213. doi: 10.3934/agrfood.2023011 |
| [5] | Nicolas Nagahama, Bruno Gastaldi, Michael N. Clifford, María M. Manifesto, Renée H. Fortunato . The influence of environmental variations on the phenolic compound profiles and antioxidant activity of two medicinal Patagonian valerians (Valeriana carnosa Sm. and V. clarionifolia Phil.). AIMS Agriculture and Food, 2021, 6(1): 106-124. doi: 10.3934/agrfood.2021007 |
| [6] | Nirawan Gunun, Chatchai Kaewpila, Waroon Khota, Pongsatorn Gunun . Investigation of the effect of different additives on the qualities, in vitro degradation, and rumen fermentation profile of indigo waste silage. AIMS Agriculture and Food, 2024, 9(1): 169-182. doi: 10.3934/agrfood.2024010 |
| [7] | Richard Anthony Scuderi, Pascal Drouin, Emmanuelle Apper . Inoculation with heterofermentative strains Lentilactobacillus buchneri CNCM 40788 and Lentilactobacillus hilgardii CNCM I-4785 either alone or combined improves fermentation and aerobic stability of ensiled triticale (X-triticosecale). AIMS Agriculture and Food, 2023, 8(3): 914-931. doi: 10.3934/agrfood.2023048 |
| [8] | Tarik Ainane, Fatouma Mohamed Abdoul-Latif, Asmae Baghouz, Zineb El Montassir, Wissal Attahar, Ayoub Ainane, Angelo Maria Giuffrè . Correction: Essential oils rich in pulegone for insecticide purpose against legume bruchus species: Case of Ziziphora hispanica L. and Mentha pulegium L.. AIMS Agriculture and Food, 2023, 8(1): 236-238. doi: 10.3934/agrfood.2023013 |
| [9] | Clarissa Trindade, Carla S.S. Gouveia, Maria Cristina O. Oliveira, Humberto Nóbrega, José G.R. de Freitas, Miguel A.A. Pinheiro de Carvalho . Inhibitory activity of the peel and seed of Annona cherimola Mill. against Fusarium and Aspergillus pathogens. AIMS Agriculture and Food, 2025, 10(1): 155-176. doi: 10.3934/agrfood.2025009 |
| [10] | The Han Nguyen, Patrick Achiever Blamo Jr, Xiaoyong Liu, Thi Van Anh Tran, Sang Moo Kim . β-Glucuronidase inhibitory activity of bromophenol isolated from red alga Grateloupia lancifolia. AIMS Agriculture and Food, 2021, 6(2): 551-559. doi: 10.3934/agrfood.2021032 |
Coconut (Cocos nucifera) is a well-known plant used in Indian and African systems of medicine. The coconut fruit consists of the following layers: exocarp, mesocarp, endocarp, endosperm and embryo [1]. In Acehnese culture, we have an old tradition of processing coconut endosperm to produce pliek-u and coconut oil [2]. Pliek-u is dried fermented coconut endosperm. Presently, Acehnese society uses pliek-u as a spice in a special soup called kuah pliek, in a fruit salad called rujak for certain occasions, as well as in sauce [3]. However, the consumption rate of pliek-u tends to be low since the community does not know about its functional properties.
In other parts of the world, coconut oil is commonly produced through the fermentation of coconut milk [4,5,6], as well as by drying coconut kernels [7,8]. The tradition of processing coconut endosperm through fermentation, which is called pliek-u processing, only exists in Aceh. In batch processing, pliek-u processors can not only produce pliek-u, but also virgin coconut oil and crude coconut oil. Since it is made through a highly efficient process, we want to conserve the tradition of pliek-u processing. The conservation of this tradition can be used as a tool to improve the economy and public health [9].
There are about six species of fungi (Microascus sp., Sordaria sp., Curvularia sp., Trichurus sp., Acremonium sp. and Gonytrichum sp.) and approximately three species of gram-positive bacteria identified in pliek-u processing [3]. Another study has also shown nine isolates of fungi consisting of Aspergillus sp., Penicillium citrinum, Thielaviopsis paradoxa and Geotrichum candidum. Pliek-u contains lactic acid bacteria, and it can inhibit the growth of Escherichia coli and Staphylococcus aureus [10]. The gas chromatography–mass spectrometry (GC-MS) analysis had shown that pliek-u contained antimicrobial compounds as a result of fermentation [11]. Recently, the bioinformatic approach has shown the potential of the fatty acid in pliek-u as a component for atopic dermatitis treatment [12]. The antibacterial activity of pliek-u has been reported to be at a concentration of 5% [13] and at concentration of 4% against S. aureus [14]. The crude coconut oil also contains oleic acid, which can be used as a component for atopic dermatitis treatment [15]; and, its linoleic acid can be used against SARS-CoV-2 [16]. The use of pliek-u in feed had also improved the growth of African catfish significantly [17]. In contrast, the incidence of mycotoxins also degrades the quality of pliek-u after the infestation of Aspergillus flavus [18]. These findings motivate us to determine both the physicochemical and sensory quality of pliek-u.
Pliek-u processing consists of several steps, e.g., grating, fermentation, drying and pressing, and it takes a long time, i.e., about 13 to 16 days. The people who process pliek-u use traditional technologies that result in low productivity and quality. There are limited studies about improving the quality of pliek-u. The optimization of pliek-u quality has been achieved through the use of a kinetic dryer [19] and a Hohenheim solar tunnel dryer [9]. The quality of pliek-u could be determined by using near infrared spectroscopy [20]. The shelf life of pliek-u has been determined through the construction of an Arrhenius model [2], and the use of glass packaging can extend its shelf life [21] However, the standard quality of pliek-u has not been determined. Therefore, the objective of this study was to determine the physicochemical and sensory quality of pliek-u produced by random processors in Aceh. The results of this study are expected to help improve the understanding of pliek-u quality. Last but not least, we hope that this information will contribute to the standardization of pliek-u processing and prevention of mycotoxin contamination, thereby conserving this tradition and increasing its consumption rate.
A survey study was conducted in five local markets, namely, Rukoh, Ulee Kareng, Al Mahirah, Kampong Baro and Lambaro, to get random samples of pliek-u from various processors in Aceh, Indonesia. We conducted a survey in these local markets due to their locations in two districts i.e., Banda Aceh and Aceh Besar, as well as their large size, which made complete products available; thus, we had a high possibility of finding pliek-u products. A set of questionnaires built with KoboToolbox (https://kf.kobotoolbox.org/) was used to collect the samples of pliek-u. There were six questions that focused on the names of sellers, name of the market, origin of the pliek-u, price per kilogram, sample number and location of the market by coordinates. In these local markets, we looked for pliek-u, retrieved some information from the sellers according to the questionnaires and then bought the products to be later used as samples.
Another set of questionnaires built using KoboToolbox was also used for an organoleptic test. An organoleptic test was conducted using the hedonic scale. A hedonic score of 5 was applied, where 1 refers to extremely dislike, 2 refers to dislike, 3 refers to neither like nor dislike, 4 refers to like and 5 refers to extremely like. All collected samples were evaluated by experts on the organoleptic properties of aroma, color, texture and taste. In addition, there were 11 questions about the characteristics of pliek-u, recipes, pliek-u conservation and the consumption rate. We chose the three experts on the basis of their expertise as related to the products, i.e., their skill and experiences in the production of pliek-u, as well as their experience in using pliek-u in their recipes. To find these experts, we used snowball sampling.
The samples of pliek-u collected for the survey were stored in a plastic bag and sent to a laboratory for quality analysis. The parameters observed were the moisture, ash, fat, protein, fiber and carbohydrate contents, and the pH value and color. All parameters were analyzed by following the Indonesian National Standard (SNI) No. 01-2891-1992 in duplicate; the moisture content was analyzed by using the drying oven method at 105 ℃; the ash content was analyzed by conducting gravimetric analysis following implementation of the dry ashing method at 550 ℃; the fat content was analyzed via a direct extraction method; the protein content was analyzed by using the Kjeldahl method; and the fiber content was analyzed by using a gravimetric method. The carbohydrate content was calculated by using the pass difference method (it was by subtracting the measured water, protein, fat and ash from the total percentage) as it was used in the United States and Canada. The pH value was measured by using a pH meter (HM PH-80). The color of the pliek-u was determined by using a digital colorimeter (LS171) with a scale of Red (R), Green (G) and Blue (B).
For the three best samples with the highest organoleptic scores, the volatile compounds were analyzed by conducting the GC-MS method at the Laboratory of Science and Technology Faculty at State Islamic University Ar-Raniry. It is an internationally accepted analytical comparative technique whereby the compounds are separated in the gas phase and a characteristic pattern of separate compounds is obtained [22]. PerkinElmer apparatuses were used [23]. A PerkinElmer Turbomatrix HS 40 Headspace Trap automatic sampler with trap enrichment was used to extract the volatile compounds. Volatile compounds were analyzed using a PerkinElmer Clarus 680GC with an SQ8 mass spectrometer. They were separated on a capillary column with dimensions of 30 m × 0.25 mm, with helium as the mobile phase. The initial temperature of the oven, 40 ℃, was maintained for 3 min. An increase in temperature was applied at rate of 3 ℃/min up to 115 ℃ and held for 10 min, and then at 2 ℃/min up to 140 ℃ and kept for 5 min. The injector temperature was 210 ℃, and the transfer temperature was 150 ℃. The mass spectrometer was operated in the scan mode within a range of 45–500 AMU.
Data were analyzed by using Microsoft Excel, including the statistical descriptives of mean value and standard deviation, and by building a map of the processor regions. Data were also analyzed by performing principal component analysis (PCA) using IBM SPSS Statistic 20.
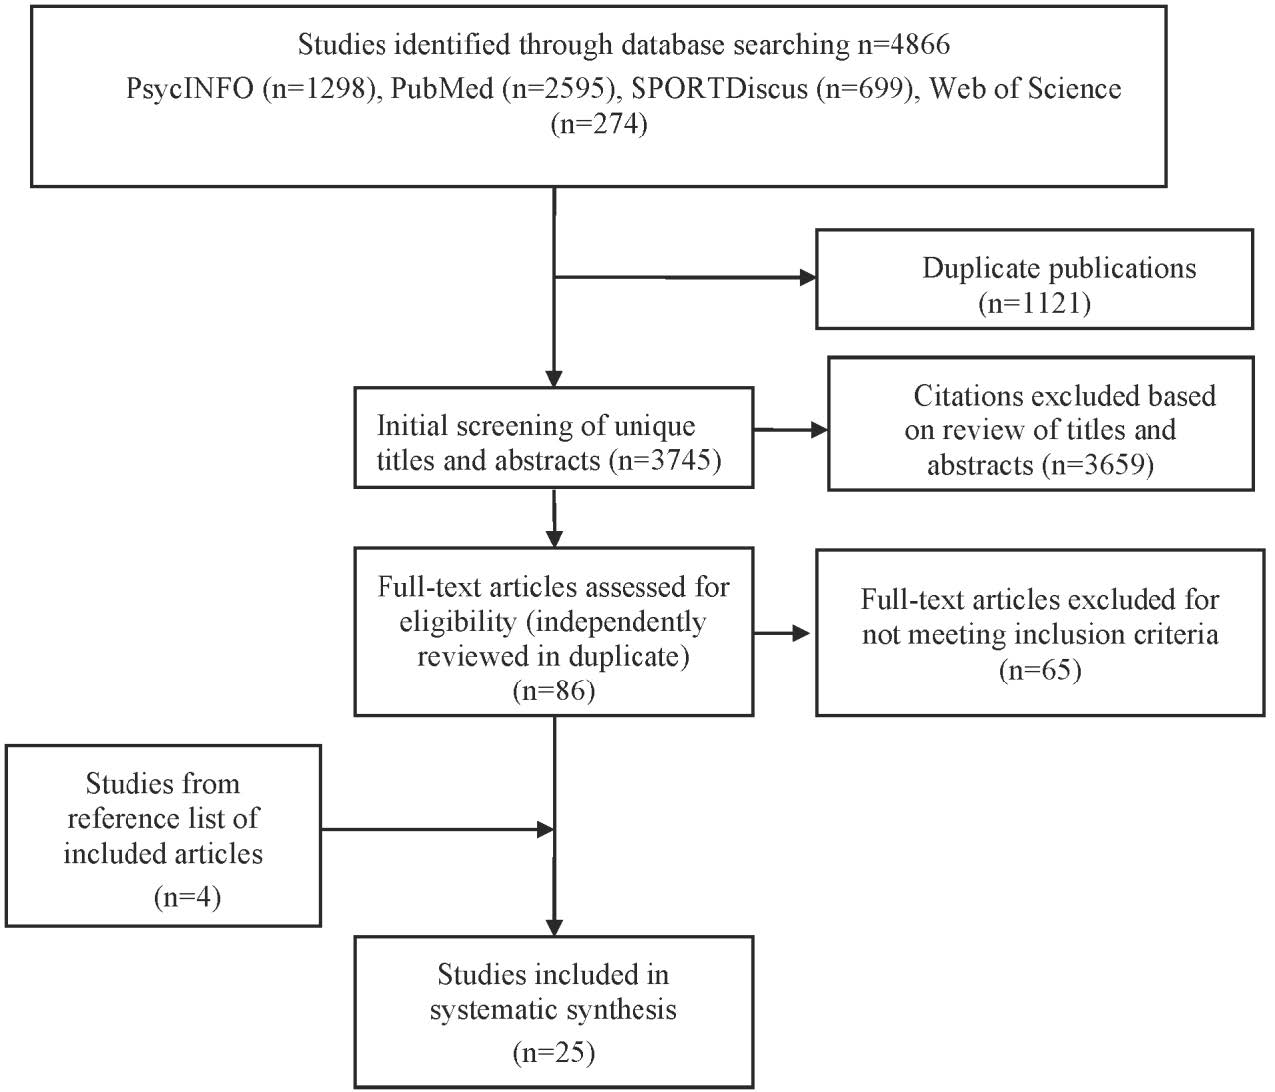
Aceh Province is located at the northwestern end of Sumatra Island, Indonesia. According to our survey, we collected 12 samples of pliek-u that were produced in four districts, i.e., Bireuen (eight samples), Banda Aceh (two samples), Aceh Besar (one sample) and Aceh Timur (one sample). The results showed that the central producer of pliek-u was the Bireuen subdistrict, which supplied about 67% of the pliek-u in the market. Aceh province has about 23 subdistricts; however, in other areas, a pliek-u processor was rarely found. Therefore, the conservation of this product should be initiated immediately.
From the survey, we also collected the information that the price of pliek-u in the local markets ranged from IDR 30,000 (USD 1.98) to IDR 50,000 (USD 3.3). Pliek-u was sold traditionally without labeling and packaging. Figure 1 shows the distribution of pliek-u processors in Aceh; the map was built by using Microsoft Excel.
Proximate analysis was conducted for all samples collected from the survey, as can be seen in Table 1. The moisture content of pliek-u ranged from 8% to 19%, the ash content ranged from 2% to 8%, the fat content ranged from 27% to 50%, the protein content ranged from 17% to 24%, the fiber content ranged from 2% to 5%, the carbohydrate content ranged from 13% to 29% and the pH value ranged from 3.97 to 5.04. Two samples were found to be moldy after a week of storage, i.e., sample numbers 2 and 10. High standard deviations were observed for fat content, carbohydrate content and moisture content. The variation in the physicochemical quality of the pliek-u was caused by the unstandardized quality of processing among the processors.
| Sample number | Origin | Moisture (%) | Ash (%) | Fat (%) | Protein (%) | Fiber (%) | Carbohydrate (%) | pH |
| 1 | Bireuen | 15.46 | 5.71 | 33.28 | 20.01 | 3.26 | 25.54 | 4.05 |
| 2 | Bireuen | 15.84 | 4.37 | 31.81 | 18.24 | 3.48 | 29.74 | 4.85 |
| 3 | Bireuen | 13.34 | 5.19 | 39.92 | 23.59 | 2.73 | 17.97 | 4.27 |
| 4 | Banda Aceh | 18.16 | 5.77 | 38.76 | 19.18 | 2.87 | 18.12 | 4.32 |
| 5 | Bireuen | 15.02 | 7.81 | 27.71 | 20.93 | 2.31 | 28.54 | 3.99 |
| 6 | Bireuen | 12.09 | 5.95 | 35.23 | 18.27 | 4.71 | 28.46 | 3.97 |
| 7 | Bireuen | 13.80 | 4.86 | 49.30 | 17.40 | 4.36 | 14.63 | 4.47 |
| 8 | Bireuen | 16.63 | 6.88 | 34.03 | 18.35 | 2.20 | 24.11 | 4.09 |
| 9 | Aceh Timur | 8.30 | 4.66 | 51.44 | 19.98 | 4.69 | 15.63 | 4.29 |
| 10 | Banda Aceh | 19.32 | 5.12 | 29.06 | 20.01 | 2.17 | 26.49 | 5.04 |
| 11 | Bireuen | 17.76 | 2.34 | 34.99 | 20.89 | 3.18 | 24.03 | 4.04 |
| 12 | Aceh Besar | 12.38 | 6.28 | 45.99 | 21.76 | 2.35 | 13.59 | 4.25 |
| Mean | 14.84 | 5.41 | 37.63 | 19.88 | 3.19 | 22.24 | 4.30 | |
| Standard deviation | 3.07 | 1.37 | 7.71 | 1.75 | 0.95 | 5.89 | 0.34 | |
| Note: Sample numbesr 2 and 10 were moldy after a week of storage | ||||||||
 DownLoad:
CSV
DownLoad:
CSV
Three experts were interviewed to evaluate the quality of pliek-u by using an organoleptic test. The ages of the experts were 62, 68 and 70 years; thus, each was well experienced in pliek-u processing. Since the sample numbers 2 and 10 were moldy, only 10 samples were evaluated. The results can be seen in Table 2.
| Sample number | Color | Aroma | Texture | Taste | TOTAL SCORE | AVERAGE SCORE |
| 1 | 4.0 ± 1 | 4.0 ± 1 | 3.7 ± 1.2 | 4.0 ± 1.7 | 15.7 | 4 |
| 3 | 4.0 ± 1 | 3.0 ± 0 | 4.0 ± 1 | 3.7 ± 0.6 | 14.7 | 4 |
| 4 | 4.0 ± 1 | 3.7 ± 0.6 | 3.3 ± 0.6 | 4.0 ± 1 | 15.0 | 4 |
| 5 | 3.3 ± 0.6 | 2.7 ± 0.6 | 3.3 ± 0.6 | 4.3 ± 0.6 | 13.7 | 3 |
| 6 | 3.3 ± 0.6 | 2.3 ± 1.2 | 3.3 ± 0.6 | 3.3 ± 1.2 | 12.3 | 3 |
| 7 | 2.7 ± 1.5 | 2.3 ± 0.6 | 1.7 ± 0.6 | 2.3 ± 0.6 | 9.0 | 2 |
| 8 | 3.0 ± 1.7 | 3.3 ± 1.5 | 4.0 ± 1 | 4.0 ± 1 | 14.0 | 4 |
| 9 | 4.0 ± 1.7 | 3.0 ± 1 | 2.7 ± 0.6 | 3.0 ±1 | 12.7 | 3 |
| 11 | 3.0 ± 1.7 | 2.3 ± 0.6 | 2.3 ± 0.6 | 3.7 ± 1.5 | 11.3 | 3 |
| 12 | 4.3 ± 1.2 | 4.3 ± 1.2 | 4.3 ± 1.2 | 4.3 ± 1.2 | 17.3 | 4 |
| Note: 1 refers to extremely dislike, 2 refers to dislike, 3 refers to neither like nor dislike, 4 refers to like and 5 refers to extremely like; sample numbers 2 and 10 were not evaluated due to their poor quality. | ||||||
DownLoad:
CSV
The highest total score was obtained for sample number 12, at 17.3 (from the district of Aceh Besar), followed by sample number 1, at 15.7 (from the district of Bireuen) and sample number 4, at 15 (from the district of Banda Aceh). However, about five out of 10 samples received average scores of 4 (i.e., "like"). The worst sample was obtained from the district of Bireuen for sample number 7, which had an average organoleptic score of 2 (i.e., "dislike"), as compared to the total score of 9.
From the extensive interviews with the experts, some information about the sensory quality of pliek-u was also documented. Pliek-u has a certain aroma, its color is light to dark brown and its taste can be best described as acidic but not bitter or rancid. All experts agreed on the importance of preserving traditional pliek-u processing in the future. They were consuming pliek-u at a low frequency (i.e., about once in a month), but they hoped for pliek-u to be produced with good and uniform quality by all processors. The taste of pliek-u was found to be very impressive, but they did not have knowledge about the health impact of consuming pliek-u.
Figure 2 shows the pictures of the pliek-u samples, and Figure 3 shows the color properties of pliek-u. The incidence of mold can be identified by a white color, and the color of moldy pliek-u appears darker (as can be seen on samples 2 and 10). According to Figure 3, it can be seen that the color properties of pliek-u are varied. The red (R) properties have average of 100 and deviation of 9. The reddest color is sample number 9 with highest R-value of 119. However, the green (G) and blue (B) values are more uniform indicated by lower deviation at 3.5 and 2.1, respectively. Overall, it can be said that the color of these samples was uniform as the deviation of each color properties was lower than its average.


The volatile compounds of the three best samples were analyzed, i.e., sample numbers 1, 4 and 12, as chosen because of their highest total scores for the organoleptic tests (Table 2). It can be seen in Figure 4 that pliek-u contained different volatile compounds. The volatile compounds that were found in all samples were 3-methylbutanal, [ethanol, 2-nitro, propionate (ester)] and (2R, 3R)-butanediol. The volatile compounds found only in sample number 1 were urea (14.59%), azulene (6.72%), cyclic octasulfur (4.75%) and [2-amino-4,5-dimethoxybenzonitrile, N-] (4.72%).

The volatile compounds identified only in sample number 4 were octanoic acid (8.4%) and [2-thiazolamine, 4-(3,4-dimethoxyphenyl)-5-] (5.9%). The volatile compound found only in sample number 12 was [nitrous acid, ethyl ester] (5.29%). The most volatile compounds were observed in sample number 12. It contained [butanal, 3-methyl] at about 15.496%, methyl formate at 15.013%, silver octanoate at 10.421%, 2-amino-1-pentanol at 6.719% and [2-amino-4,5-dimethoxybenzonitrile, N-] at about 6.307%. Sample numbers 4 and 12 had the same six volatile components, but sample number 12 had fewer volatile compounds compared to sample numbers 1 and 4.
The central production of pliek-u in Aceh is Bireuen District. It can be seen that pliek-u processors are rarely found in other parts of Aceh. This warrants attention from universities and the government to conserve this old tradition of coconut endosperm processing. Simple technology can be applied to these small-scale enterprises to improve the situation and attract young people to get involved in preserving the tradition. In addition, the product needs better packaging and labeling in order to be sold, not only in local markets, but also in bigger markets such as supermarkets and online markets. The use of glass material for packaging can also prolong the shelf life of pliek-u [21]. So, it is also important to introduce modern packaging methods to processors in Aceh, Indonesia. The short shelf life of the pliek-u in local markets (less than 2 months) is presumed to be associated with high moisture, and the improper storage and packaging of the products.
Considering the organoleptic assessment, five out of the 12 samples received an average score of 4, namely, sample numbers 1, 3, 4, 8 and 12. Using these selected samples, we found the pliek-u samples to have a moisture content of 12–18%, ash content of 5–7%, fat content of 33–46%, protein content of 18–24%, fiber content of 2–3%, carbohydrate content of 13–26% and pH value of 4.0–4.3. In the same manner, based on 3 best samples selected, the expected color of pliek-u is with Red-value ranged from 101 to 113, Green-value ranged from 85 to 94 and Blue-value ranged from 80 to 87.
Based on the PCA results, only five out of seven parameters were used to determine the pliek-u quality. They were the moisture content (, pH value ( protein content (, ash content ( and carbohydrate content (. The statistic descriptive of these parameters can be seen in Table A. 1. The excluded parameters were fat content and fiber content. The PCA was conducted by applying the Kaiser-Meyer-Olkin (KMO) value of 0.505 (Table A. 2). The first principal component ( contributed to 34.111% of the variance, with the highest correlation value being attributed to the pH value of about 0.510; the second principal component ( contributed to 24.968% of the variance, with the highest correlation value being attributed to the protein content of 0.537 (The contribution can be seen in Table A. 4 and the correlation value can be seen in Table A. 3). PC1 and PC2 can be written as follows (Table A. 5).
Here, it can be seen that the pH value and protein content play the most important roles in determining the quality of pliek-u compared to the other parameters. The importance of the pH value was demonstrated by sample number 4; even though it had a moisture content of 18%, the quality could be maintained without mold. According to the experts, acidity is an important characteristic of pliek-u. The use of a starter culture lowered the pH value from 5.16 to 4.3–4.5 after 3 days of fermentation [24]. A similar pH value can be achieved without a starter culture by extending the fermentation process [10]. The fermentation step is the core of pliek-u processing because, during this step, the volatile components of pliek-u are also developed. The maximum fermentation was 15 days, according to the age of the lactic acid bacteria, as was determined by Tsukamuto method [25]. Further studies are necessary to determine the condition of the fermentation process and its effects on pliek-u quality; improving the technology of the fermentation kettle should be conducted.
Both components (PC1 and PC2) had eigenvalues higher than 1, and the cumulative contribution of these components was 59.079%. According to the component plot in rotated space and biplot (Figure 5), the carbohydrate content was located in the same quadrant as the ash content, while the moisture content was located in the same quadrant as the pH value. About five samples were located in quadrant 1, i.e., sample numbers 2, 4, 6, 10 and 11, which had the characteristics of high ash and carbohydrate content. Then, two samples were located in quadrant 2, i.e., sample numbers 7 and 9, which had the same characteristics. Only one sample was located in quadrant 3, i.e., sample number 12, which had no prominent characteristics according to the PCA results, but this sample actually had high fat and protein content (as can be seen in Table 1). Also of importance is the origin of the sample, as sample number 12 was from the Aceh Besar district, which may have caused the different characteristics of the pliek-u. Four samples, i.e., numbers 1, 3, 5 and 8, were located in quadrant 4, indicating the characteristics of a high pH-value and high moisture content. The distribution of samples across all quadrants showed that the quality of the pliek-u highly varied among processors. Therefore, the standardization of pliek-u processing should be formulated.

Besides the pH value and protein content, the moisture content is commonly important for the quality. This fact was supported by a previous study that indicated that maintaining a moisture content for pliek-u that is below 10% can extend the shelf life up to 2 years [2]. Moisture content below 14% is very important for dried products since it can inhibit the growth of microorganisms. It can be the reason why sample numbers 2 and 10, which had moisture contents above 14%, had mold infestation after a week of storage.
The protein content of pliek-u was stable among all processors at 17–24%, with a deviation of about 1.75%. It is interesting that the protein content of pliek-u is higher than the protein content of coconut endosperm. Increasing the protein content was also confirmed in a previous study as the impact the fermentation process [26]. Therefore, pliek-u can be used as healthy food due to its high protein content. However, the fat content of pliek-u was highly varied among processors; this could be caused by the method of pressing. High fat content can increase the rancidness during storage of the pliek-u. An appropriate fermentation should increase the crude fat content due to microbial activity producing heat [26], but the later separation procedure of oil and pliek-u through the use of pressing technology should reduce the fat content of pliek-u.
The ash content of pliek-u, on average, was 5.41%, with a deviation of 1.37%. It was explained that the fermentation could decrease the ash content, as well as the moisture content [26]. A previous study has shown that the ash content of pliek-u was about 4.63% [19]. Introducing technology could reduce the contamination during processing and maintain the ash content of pliek-u below 7%.
According to the GC-MS results on volatile compounds, sample numbers 4 and 12 had better components compared to sample number 1 since the urea content in pliek-u sample number 1 was identified. However, sample number 1 also contained beneficial components such as azulene and octasulfur. Azulene is an aromatic hydrocarbon and isomer of naphthalene. Azulene and its derivatives occur naturally as a component of many plants [27]. In medicine, the potential use of this compound has been associated with anti-inflammatory, antineoplastic, antidiabetic, antiretroviral with HIV-1 and antimicrobial properties [28]. Octasulfur is an inorganic substance that is present in all living tissues. Sulfur is an indispensable food component for human health and disease prevention. Apart from pliek-u, sulfur is also found in abundance in garlic oil, which is often used for health therapy [29].
It can be seen that sample number 12 had the best quality since it contained larger amounts of methyl formate; butanal, 3-methyl; octanoid acid; Ag+ salt and amino acids. According to the PCA results, sample number 1 was located in quadrant 4, sample number 4 was located in quadrant 1 and sample number 12 was located in quadrant 3. This implies the different characteristics among these samples significantly, which was confirmed later by the differences in volatile compounds. It could be influenced by the unstandardized pliek-u processing. Further studies are recommended to find out the best processing steps in order to produce the beneficial volatile compounds expected from pliek-u.
Finally, pliek-u, as a traditional fermented food, can usually be consumed safely. However, mycotoxins could form during the fermentation of pliek-u [11]. A previous study has shown that pliek-u at traditional markets in Aceh had been infected with Aspergillus flavus [18]. Although the mycotoxin was not identified in our study, the incidence of urea in sample number 1 was also an example of failure production. Generally, the fermentation of coconut endosperm is predominantly a lactic acid fermentation process [4]. To avoid the occurrence of hazardous material in pliek-u, it is important to improve the pliek-u manufacturing process by giving skill and knowledge to the processors and developing simple technologies that can be used in the production. Last but not least, this study has also confirmed that the sensory quality could not stand alone and should be supported by the physicochemical quality to guarantee not only the taste, but also the quality and safety of pliek-u.
Twelve random samples of pliek-u were used to determine the quality of pliek-u produced in Aceh, Indonesia. According to the results of PCA, from the seven parameters evaluated, the most important parameters contributing to pliek-u quality were the pH value (4 to 4.5) and protein content (>19%). However, the three best samples selected by experts were located in different quadrants of the biplot derived from PCA, which revealed that they have different characteristics. The GC-MS results regarding the volatile compounds of these samples confirmed these unique characteristics, which could have been caused by the unstandardized pliek-u processing applied in the community. The step that most significantly affects pliek-u quality is the fermentation step. Further studies are also necessary to determine if a causal relationship exists among these parameters and how certain fermentation conditions would impact the volatile compounds in pliek-u.
| Mean | Std. Deviationa | Analysis Na | Missing N | |
| Moisture | 14.8416667 | 3.07419415 | 12 | 0 |
| pH | 4.3025000 | 0.33871750 | 12 | 0 |
| Protein | 19.8841667 | 1.75104363 | 12 | 0 |
| Ash | 5.4116667 | 1.37156071 | 12 | 0 |
| Carbohydrate | 22.2375 | 5.89233574 | 12 | 0 |
| Note: a. For each variable, missing values are replaced with the variable mean. | ||||
DownLoad:
CSV
| Kaiser-Meyer-Olkin measure of sampling adequacy. | 0.505 | |
| Bartlett's test of sphericity | Approx. Chi-Square | 4.371 |
| DoF | 10 | |
| Sig. | 0.929 | |
DownLoad:
CSV
| Moisture | pH | Protein | Ash | Carbohydrate | ||
| Anti-image covariance | Moisture | 0.720 | -0.229 | -0.038 | 0.060 | -0.328 |
| pH | -0.229 | 0.808 | 0.163 | 0.211 | 0.089 | |
| Protein | -0.038 | 0.163 | 0.910 | 0.028 | 0.186 | |
| Ash | 0.060 | 0.211 | 0.028 | 0.906 | -0.102 | |
| Carbohydrate | -0.328 | 0.089 | 0.186 | -0.102 | 0.747 | |
| Anti-image correlation | Moisture | 0.508a | -0.300 | -0.047 | 0.074 | -0.447 |
| pH | -0.300 | 0.510a | 0.190 | 0.247 | 0.115 | |
| Protein | -0.047 | 0.190 | 0.534a | 0.031 | 0.225 | |
| Ash | 0.074 | 0.247 | 0.031 | 0.537a | -0.125 | |
| Carbohydrate | -0.447 | 0.115 | 0.225 | -0.125 | 0.477a | |
| Note: a. Measures of sampling adequacy (MSA). | ||||||
DownLoad:
CSV
| Component | Initial eigenvalues | Extraction sums of squared loadings | Rotation sums of squared loadings | ||||||
| Total | % of Variance | Cumulative % | Total | % of Variance | Cumulative % | Total | % of Variance | Cumulative % | |
| 1 | 1.706 | 34.111 | 34.111 | 1.706 | 34.111 | 34.111 | 1.617 | 32.341 | 32.341 |
| 2 | 1.248 | 24.968 | 59.079 | 1.248 | 24.968 | 59.079 | 1.337 | 26.739 | 59.079 |
| 3 | 0.912 | 18.234 | 77.313 | ||||||
| 4 | 0.684 | 13.679 | 90.992 | ||||||
| 5 | 0.450 | 9.008 | 100.000 | ||||||
| Note: Extraction method: principal component analysis. | |||||||||
DownLoad:
CSV
| Component | ||
| 1 | 2 | |
| Moisture | 0.738 | -0.265 |
| pH | 0.313 | -0.744 |
| Protein | -0.532 | 0.049 |
| Ash | 0.113 | 0.813 |
| Carbohydrate | 0.824 | 0.221 |
| Note: Extraction method: principal component analysis; Rotation method: quartimax with Kaiser normalization; a. Rotation converged in three iterations. | ||
DownLoad:
CSV


We would like to thank the Ministry of Education, Culture, Research and Technology for funding this research through the National Program of Competitive Applied Research (PTKN) for the year 2022 (No. 105/UN11.2.1/PT.01.03/DRPM/2022).
We would like to declare that there is no conflict of interest that could affect the publication of this research.
| [1] |
Rezende, LF, Rodrigues Lopes M, Rey-López JP, et al. (2014) Sedentary behavior and health outcomes: An overview of systematic reviews. PLoS ONE 9: e105620. doi: 10.1371/journal.pone.0105620

|
| [2] | Sedentary Behavior Research Network (2012) Letter to the editor: standardized use of the terms "sedentary" and "sedentary behaviours". Appl Physiol Nutr Metab 37: 540-542. |
| [3] | Colley RC, Garriguet D, Janssen I, et al. (2011) Physical activity of Canadian adults: accelerometer results from the 2007 to 2009 Canadian health measures survey. Health Rep 22: 7-14. |
| [4] | Matthews CE, Chen KY, Freedson PS, et al. (2008) Amount of time spent in sedentary behaviors in the United States, 2003–2004. Am J Epidemiol 167: 875-881. |
| [5] | Owen N, Sugiyama T, Eakin EE, et al. (2011) Adults' sedentary behavior: determinants and interventions. Am J Prev Med 41: 189-196. |
| [6] | Sallis JF, Owen N, Fisher EB (2008) Ecological models of health behaviour, In: Glanz K, Rimer BK, & Viswanath K, Health behavior and health education: Theory, research, and practice, 4 Eds., San Francisco, CA: Jossey-Bass, 465-486. |
| [7] | Forgas JP (2008) Affect and cognition. Perspect Psychol Sci 3: 94-101. |
| [8] | Hilgard ER (1980) The trilogy of mind: Cognition, affection, and conation. J Hist Behav Sci 16: 107-117. |
| [9] | Rosenstock I (1974) The health belief model and preventive health behavior. Health Educ Monogr 2: 355-385. |
| [10] | Ajzen I & Fishbein M (1977) Attitude-behavior relations: A theoretical analysis and review of empirical research. Psychol Bull 84: 888. |
| [11] | Ajzen I (1991) The theory of planned behavior. Organ Behav Hum Decis Process 50: 179-211. |
| [12] | Rogers RW (1975) A protection motivation theory of fear appeals and attitude change. J Psychol 91: 93-114. |
| [13] | Bandura A (1977) Self-efficacy: toward a unifying theory of behavioral change. Psychol Rev 84: 191. |
| [14] | Schwarzer R (2008) Modeling health behavior change: how to predict and modify the adoption and maintenance of health behaviors. Appl Psychol 57: 1-29. |
| [15] | Deci EL & Ryan RM (2002) Handbook of self-determination research. Rochester, NY: University of Rochester Press. |
| [16] | Armitage CJ & Conner M (2000) Social cognition models and health behavior: A structured review. Psychol Health 15: 173-189. |
| [17] | Rhodes RE, Mark RS, Temmel CP (2012) Adult sedentary behavior: A systematic review. American J Prev Med 42: e3-e28. |
| [18] | Owen N, Salmon J, Koohsari MJ, et al. (2014) Sedentary behaviour and health: mapping environmental and social contexts to underpin chronic disease prevention. Br J Sports Med 48: 174-177. |
| [19] | Salmon J, Tremblay MS, Marshall SJ, et al. (2011) Health risks, correlates, and interventions to reduce sedentary behavior in young people. Am J Prev Med 41: 197-206. |
| [20] | Uijtdewilligen L, Twisk JWR, van der Horst K, et al. (2012) Determinants of physical activity and sedentary behaviour in young people: a review and quality synthesis of prospective studies. Br J Sports Med 45: 896-905. |
| [21] | Atkin AJ, Corder K, Goodyer I, et al. (2015) Perceived family functioning and friendship quality: cross-sectional association with physical activity and sedentary behaviours. Int J Behav Nutr Phys Act 12: 23. |
| [22] | Bai Y, Chen S, Vazou S, et al. (2015) Mediated effects of perceived competence on youth physical activity and sedentary behaviour. Res Q Exerc Sport 86: 406-413. |
| [23] | Busschaert C, De Bourdeaudhuij I, Van Cauwenberg J, et al. (2016) Intrapersonal, social-cognitive and physical environmental variables related to context-specific sitting time in adults: a one-year follow-up study. Int J Behav Nutr Phys Act 13: 28. |
| [24] | Chang AK & Sok SR (2015) Predictors of sedentary behavior in elderly Koreans with hypertension. J Nurs Res 23: 262-270. |
| [25] | Conroy DE, Maher JP, Elavsky S, et al. (2013) Sedentary behaviour as a daily process regulated by habits and intentions. Health Psychol 32: 1149-1157. |
| [26] | De Cocker K, Duncan MJ, Short C, et al. (2014) Understanding occupational sitting: Prevalence, correlates and moderating effects in Australian employees. Prev Med 67: 288-294. |
| [27] | Gaston A, De Jesus S, Markland D, et al. (2016) I sit because I have fun when I do so! Using self-determination theory to understand sedentary behavior motivation. Health Psychol Behav Med (In Press). |
| [28] | Gebremariam MK, Totland TH, Andersen LF, et al. (2012) Stability and change in screen-based sedentary behaviours and associated factors among Norwegian children in the transition between childhood and adolescence. BMC Public Health 12: 104. |
| [29] | Ham OK, Sung KM, Kim HK (2013) Factors associated with screen time among school-age children in Korea. J Sch Nurs 29: 425-434. |
| [30] | He M, Piché L, Beynon C, et al. (2010) Screen-related sedentary behaviors: Children’s and parents’ attitudes, motivations, and practices. J Nutr Educ Behav 42: 17-25. |
| [31] | Hoyos Cillero I, Jago R, Sebire S (2011) Individual and social predictors of screen-viewing among Spanish school children. Eur J Pediatr 170: 93-102. |
| [32] | Huang WY, Wong SH, Salmon J (2013) Correlates of physical activity and screen-based behaviors in Chinese children. J Sci Med Sport 16: 509-514. |
| [33] | Janssen X, Basterfield L, Parkinson KN, et al. (2015) Determinants of changes in sedentary time and breaks in sedentary time among 9 and 12 years old children. Prev Med Rep 2: 880-885. |
| [34] | Kremers SPJ & Brug J (2008) Habit strength of physical activity and sedentary behavior among children and adolescents. Pediatr Exerc Sci 20: 5-17. |
| [35] | Lowe SS, Danielson B, Beaumont C, et al. (2015) Correlates of objectively measured sedentary behavior in cancer patients with brain metastases: an application of the theory of planned behavior. Psycho-Oncology 24: 757-762. |
| [36] | Maher JP & Conroy DE (2015) Habit strength moderates the effects of daily action planning prompts on physical activity but not sedentary behavior. J Sport Exerc Psychol 37: 97-107. |
| [37] | Maher JP & Conroy DE (2016) A dual-process model of older adults’ sedentary behavior. Health Psychol 35: 262-272. |
| [38] | Norman GJ, Schmid BA, Sallis JF, et al. (2005) Psychosocial and environmental correlates of adolescent sedentary behaviors. Pediatrics 116: 908-916. |
| [39] | Prapavessis H, Gaston A, DeJesus S (2015) The theory of planned behavior as a model for understanding sedentary behavior. Psychol Sport Exerc 19: 23-32. |
| [40] | Quartiroli A & Maeda H (2014) Self-determined engagement in physical activity and sedentary behaviors of US college students. Int J Exerc Sci 7: 87-97. |
| [41] | Rhodes RE & Dean RN (2009) Understanding physical inactivity: Prediction of four sedentary leisure behaviors. Leis Sci 31: 124-135. |
| [42] | Salmon J, Owen N, Crawford D, et al. (2003) Physical activity and sedentary behavior: A population-based study of barriers, enjoyment, and preference. Health Psychol 22: 178-188. |
| [43] | Van Dyck D, Cardon G, Deforche B, et al. (2011) Socio-demographic, psychosocial and home-environmental attributes associated with adults’ domestic screen time. BMC Public Health 11: 668. |
| [44] | Wallmann-Sperlich B, Bucksch J, Schneider S, et al. (2014) Socio-demographic, behavioural and cognitive correlates of work-related sitting time in German men and women. BMC Public Health 14: 1259. |
| [45] | Wong TS, Gaston A, DeJesus S, et al. (2016) The utility of a protection motivation theory framework for understanding sedentary behaviour. Health Psychol Behav Med 4: 29-48. |
| [46] | Rhodes RE & Nigg CR (2011) Advancing physical activity theory: A review and future directions. Exerc Sport Sci Rev 39: 113-119. |
| [47] | Ajzen I & Fishbein M (2005) The influence of attitudes on behavior. In: Albarracín D, Johnson BT, & Zanna MP, The Handbook of Attitudes, Mahwah, NJ: Erlbaum, 173-221. |
| [48] | Manning M (2009) The effects of subjective norms on behavior in the theory of planned behavior: a meta-analysis. Br J Soc Psychol 48: 649e705. |
| [49] | Aarts H, Paulussen T, Schaalma H (1997) Physical exercise habit: On the conceptualization and formation of habitual health behaviours. Health Educ Res 12: 363-374. |
| [50] | Grove JR & Zillich I (2003) Conceptualisation and measurement of habitual exercise. In: Katsikitis M., Proceedings of the 38th Annual Conference of the Australian Psychological Society, Melbourne: Australian Psychological Society, 88-92. |
| [51] | Mullan E, Markland D, Ingledew DK (1997) A graded conceptualisation of self- determination in the regulation of exercise behavior: Development of a measure using confirmatory factor analytic procedures. Personal Individ Differ 23: 745-752. |
| [52] | Carr LJ, Karvinen K, Peavler M, et al. (2013) Multicomponent intervention to reduce daily sedentary time: a randomized controlled trial. BMJ Open Access 3: e003261. |
| [53] | Gardiner PA, Eakin EG, Healy GN, et al. (2011) Feasibility of reducing older adults’ sedentary time. Am J Prev Med 41: 174-177. |
| [54] | Gaston A & Prapavessis H (2014) Using a combine protection motivation theory and health action process approach intervention to promote exercise during pregnancy. J Behav Med 37: 173-184. |
| [55] | Deliens T, Deforche B, De Bourdeaudhuij I, et al. (2015) Determinants of physical activity and sedentary behavior in university students: a qualitative study using focus group discussion. BMC Public Health 15: 201. |
| [56] | Uijtdewilligen L, Singh AS, Chinapaw MJM, et al. (2015) Person-related determinants of TV viewing and computer time in a cohort of young Dutch adults: Who sits the most? Scand J Med Sci Sports 25: 716-723. |
| [57] | Breland JY, Fox AM, Horowitz CR (2013) Screen time, physical activity and depression risk in minority women. Ment Health Phys Act 6: 10-15. |
| [58] | Hagger MS, Chatzisarantis NLD, Biddle SJH (2002) A meta-analytic review of the theories of reasoned action and planned behavior in physical activity: predictive validity and the contribution of additional variables. J Sport Exerc Psychol 24: 3e32. |
| [59] | Moher D, Liberati A, Tetzlaff J, et al. (2010) Preferred reporting items for systematic reviews and meta-analyses: The PRISMA statement. Int J Surg 8: 336-341. |
| [60] | Downs SH & Black N (1998) The feasibility of creating a checklist for the assessment of the methodological quality both of randomised and non-randomised studies of health care interventions. J Epidemiol Community Health 52: 377-384. |
| [61] | Brocklebank LA, Falconer CL, Page AS, et al. (2015) Accelerometer-measured sedentary time and cardiometabolic biomarkers: A systematic review. Prev Med 76: 92-102. |
| [62] | Healy GN, Matthews CE, Dunstan DW, et al. (2011) Sedentary time and cardio-metabolic biomarkers in US adults: NHANES 2003-06. Eur Heart J 32: 590-597. |
| [63] |
Mansoubi M, Pearson N, Biddle S, et al. (2014) The relationship between sedentary behaviour and physical activity in adults: A systematic review. Prev Med 69: 28-35. doi: 10.1016/j.ypmed.2014.08.028
|

Figures(2) / Tables(2)

Scott Rollo, Anca Gaston, Harry Prapavessis. Cognitive and Motivational Factors Associated with Sedentary Behavior: A Systematic Review[J]. AIMS Public Health, 2016, 3(4): 956-984. doi: 10.3934/publichealth.2016.4.956

| Sample number | Origin | Moisture (%) | Ash (%) | Fat (%) | Protein (%) | Fiber (%) | Carbohydrate (%) | pH |
| 1 | Bireuen | 15.46 | 5.71 | 33.28 | 20.01 | 3.26 | 25.54 | 4.05 |
| 2 | Bireuen | 15.84 | 4.37 | 31.81 | 18.24 | 3.48 | 29.74 | 4.85 |
| 3 | Bireuen | 13.34 | 5.19 | 39.92 | 23.59 | 2.73 | 17.97 | 4.27 |
| 4 | Banda Aceh | 18.16 | 5.77 | 38.76 | 19.18 | 2.87 | 18.12 | 4.32 |
| 5 | Bireuen | 15.02 | 7.81 | 27.71 | 20.93 | 2.31 | 28.54 | 3.99 |
| 6 | Bireuen | 12.09 | 5.95 | 35.23 | 18.27 | 4.71 | 28.46 | 3.97 |
| 7 | Bireuen | 13.80 | 4.86 | 49.30 | 17.40 | 4.36 | 14.63 | 4.47 |
| 8 | Bireuen | 16.63 | 6.88 | 34.03 | 18.35 | 2.20 | 24.11 | 4.09 |
| 9 | Aceh Timur | 8.30 | 4.66 | 51.44 | 19.98 | 4.69 | 15.63 | 4.29 |
| 10 | Banda Aceh | 19.32 | 5.12 | 29.06 | 20.01 | 2.17 | 26.49 | 5.04 |
| 11 | Bireuen | 17.76 | 2.34 | 34.99 | 20.89 | 3.18 | 24.03 | 4.04 |
| 12 | Aceh Besar | 12.38 | 6.28 | 45.99 | 21.76 | 2.35 | 13.59 | 4.25 |
| Mean | 14.84 | 5.41 | 37.63 | 19.88 | 3.19 | 22.24 | 4.30 | |
| Standard deviation | 3.07 | 1.37 | 7.71 | 1.75 | 0.95 | 5.89 | 0.34 | |
| Note: Sample numbesr 2 and 10 were moldy after a week of storage | ||||||||
DownLoad:
CSV
| Sample number | Color | Aroma | Texture | Taste | TOTAL SCORE | AVERAGE SCORE |
| 1 | 4.0 ± 1 | 4.0 ± 1 | 3.7 ± 1.2 | 4.0 ± 1.7 | 15.7 | 4 |
| 3 | 4.0 ± 1 | 3.0 ± 0 | 4.0 ± 1 | 3.7 ± 0.6 | 14.7 | 4 |
| 4 | 4.0 ± 1 | 3.7 ± 0.6 | 3.3 ± 0.6 | 4.0 ± 1 | 15.0 | 4 |
| 5 | 3.3 ± 0.6 | 2.7 ± 0.6 | 3.3 ± 0.6 | 4.3 ± 0.6 | 13.7 | 3 |
| 6 | 3.3 ± 0.6 | 2.3 ± 1.2 | 3.3 ± 0.6 | 3.3 ± 1.2 | 12.3 | 3 |
| 7 | 2.7 ± 1.5 | 2.3 ± 0.6 | 1.7 ± 0.6 | 2.3 ± 0.6 | 9.0 | 2 |
| 8 | 3.0 ± 1.7 | 3.3 ± 1.5 | 4.0 ± 1 | 4.0 ± 1 | 14.0 | 4 |
| 9 | 4.0 ± 1.7 | 3.0 ± 1 | 2.7 ± 0.6 | 3.0 ±1 | 12.7 | 3 |
| 11 | 3.0 ± 1.7 | 2.3 ± 0.6 | 2.3 ± 0.6 | 3.7 ± 1.5 | 11.3 | 3 |
| 12 | 4.3 ± 1.2 | 4.3 ± 1.2 | 4.3 ± 1.2 | 4.3 ± 1.2 | 17.3 | 4 |
| Note: 1 refers to extremely dislike, 2 refers to dislike, 3 refers to neither like nor dislike, 4 refers to like and 5 refers to extremely like; sample numbers 2 and 10 were not evaluated due to their poor quality. | ||||||
DownLoad:
CSV
| Mean | Std. Deviationa | Analysis Na | Missing N | |
| Moisture | 14.8416667 | 3.07419415 | 12 | 0 |
| pH | 4.3025000 | 0.33871750 | 12 | 0 |
| Protein | 19.8841667 | 1.75104363 | 12 | 0 |
| Ash | 5.4116667 | 1.37156071 | 12 | 0 |
| Carbohydrate | 22.2375 | 5.89233574 | 12 | 0 |
| Note: a. For each variable, missing values are replaced with the variable mean. | ||||
DownLoad:
CSV
| Kaiser-Meyer-Olkin measure of sampling adequacy. | 0.505 | |
| Bartlett's test of sphericity | Approx. Chi-Square | 4.371 |
| DoF | 10 | |
| Sig. | 0.929 | |
DownLoad:
CSV
| Moisture | pH | Protein | Ash | Carbohydrate | ||
| Anti-image covariance | Moisture | 0.720 | -0.229 | -0.038 | 0.060 | -0.328 |
| pH | -0.229 | 0.808 | 0.163 | 0.211 | 0.089 | |
| Protein | -0.038 | 0.163 | 0.910 | 0.028 | 0.186 | |
| Ash | 0.060 | 0.211 | 0.028 | 0.906 | -0.102 | |
| Carbohydrate | -0.328 | 0.089 | 0.186 | -0.102 | 0.747 | |
| Anti-image correlation | Moisture | 0.508a | -0.300 | -0.047 | 0.074 | -0.447 |
| pH | -0.300 | 0.510a | 0.190 | 0.247 | 0.115 | |
| Protein | -0.047 | 0.190 | 0.534a | 0.031 | 0.225 | |
| Ash | 0.074 | 0.247 | 0.031 | 0.537a | -0.125 | |
| Carbohydrate | -0.447 | 0.115 | 0.225 | -0.125 | 0.477a | |
| Note: a. Measures of sampling adequacy (MSA). | ||||||
DownLoad:
CSV
| Component | Initial eigenvalues | Extraction sums of squared loadings | Rotation sums of squared loadings | ||||||
| Total | % of Variance | Cumulative % | Total | % of Variance | Cumulative % | Total | % of Variance | Cumulative % | |
| 1 | 1.706 | 34.111 | 34.111 | 1.706 | 34.111 | 34.111 | 1.617 | 32.341 | 32.341 |
| 2 | 1.248 | 24.968 | 59.079 | 1.248 | 24.968 | 59.079 | 1.337 | 26.739 | 59.079 |
| 3 | 0.912 | 18.234 | 77.313 | ||||||
| 4 | 0.684 | 13.679 | 90.992 | ||||||
| 5 | 0.450 | 9.008 | 100.000 | ||||||
| Note: Extraction method: principal component analysis. | |||||||||
DownLoad:
CSV
| Component | ||
| 1 | 2 | |
| Moisture | 0.738 | -0.265 |
| pH | 0.313 | -0.744 |
| Protein | -0.532 | 0.049 |
| Ash | 0.113 | 0.813 |
| Carbohydrate | 0.824 | 0.221 |
| Note: Extraction method: principal component analysis; Rotation method: quartimax with Kaiser normalization; a. Rotation converged in three iterations. | ||
DownLoad:
CSV
| Sample number | Origin | Moisture (%) | Ash (%) | Fat (%) | Protein (%) | Fiber (%) | Carbohydrate (%) | pH |
| 1 | Bireuen | 15.46 | 5.71 | 33.28 | 20.01 | 3.26 | 25.54 | 4.05 |
| 2 | Bireuen | 15.84 | 4.37 | 31.81 | 18.24 | 3.48 | 29.74 | 4.85 |
| 3 | Bireuen | 13.34 | 5.19 | 39.92 | 23.59 | 2.73 | 17.97 | 4.27 |
| 4 | Banda Aceh | 18.16 | 5.77 | 38.76 | 19.18 | 2.87 | 18.12 | 4.32 |
| 5 | Bireuen | 15.02 | 7.81 | 27.71 | 20.93 | 2.31 | 28.54 | 3.99 |
| 6 | Bireuen | 12.09 | 5.95 | 35.23 | 18.27 | 4.71 | 28.46 | 3.97 |
| 7 | Bireuen | 13.80 | 4.86 | 49.30 | 17.40 | 4.36 | 14.63 | 4.47 |
| 8 | Bireuen | 16.63 | 6.88 | 34.03 | 18.35 | 2.20 | 24.11 | 4.09 |
| 9 | Aceh Timur | 8.30 | 4.66 | 51.44 | 19.98 | 4.69 | 15.63 | 4.29 |
| 10 | Banda Aceh | 19.32 | 5.12 | 29.06 | 20.01 | 2.17 | 26.49 | 5.04 |
| 11 | Bireuen | 17.76 | 2.34 | 34.99 | 20.89 | 3.18 | 24.03 | 4.04 |
| 12 | Aceh Besar | 12.38 | 6.28 | 45.99 | 21.76 | 2.35 | 13.59 | 4.25 |
| Mean | 14.84 | 5.41 | 37.63 | 19.88 | 3.19 | 22.24 | 4.30 | |
| Standard deviation | 3.07 | 1.37 | 7.71 | 1.75 | 0.95 | 5.89 | 0.34 | |
| Note: Sample numbesr 2 and 10 were moldy after a week of storage | ||||||||
| Sample number | Color | Aroma | Texture | Taste | TOTAL SCORE | AVERAGE SCORE |
| 1 | 4.0 ± 1 | 4.0 ± 1 | 3.7 ± 1.2 | 4.0 ± 1.7 | 15.7 | 4 |
| 3 | 4.0 ± 1 | 3.0 ± 0 | 4.0 ± 1 | 3.7 ± 0.6 | 14.7 | 4 |
| 4 | 4.0 ± 1 | 3.7 ± 0.6 | 3.3 ± 0.6 | 4.0 ± 1 | 15.0 | 4 |
| 5 | 3.3 ± 0.6 | 2.7 ± 0.6 | 3.3 ± 0.6 | 4.3 ± 0.6 | 13.7 | 3 |
| 6 | 3.3 ± 0.6 | 2.3 ± 1.2 | 3.3 ± 0.6 | 3.3 ± 1.2 | 12.3 | 3 |
| 7 | 2.7 ± 1.5 | 2.3 ± 0.6 | 1.7 ± 0.6 | 2.3 ± 0.6 | 9.0 | 2 |
| 8 | 3.0 ± 1.7 | 3.3 ± 1.5 | 4.0 ± 1 | 4.0 ± 1 | 14.0 | 4 |
| 9 | 4.0 ± 1.7 | 3.0 ± 1 | 2.7 ± 0.6 | 3.0 ±1 | 12.7 | 3 |
| 11 | 3.0 ± 1.7 | 2.3 ± 0.6 | 2.3 ± 0.6 | 3.7 ± 1.5 | 11.3 | 3 |
| 12 | 4.3 ± 1.2 | 4.3 ± 1.2 | 4.3 ± 1.2 | 4.3 ± 1.2 | 17.3 | 4 |
| Note: 1 refers to extremely dislike, 2 refers to dislike, 3 refers to neither like nor dislike, 4 refers to like and 5 refers to extremely like; sample numbers 2 and 10 were not evaluated due to their poor quality. | ||||||
| Mean | Std. Deviationa | Analysis Na | Missing N | |
| Moisture | 14.8416667 | 3.07419415 | 12 | 0 |
| pH | 4.3025000 | 0.33871750 | 12 | 0 |
| Protein | 19.8841667 | 1.75104363 | 12 | 0 |
| Ash | 5.4116667 | 1.37156071 | 12 | 0 |
| Carbohydrate | 22.2375 | 5.89233574 | 12 | 0 |
| Note: a. For each variable, missing values are replaced with the variable mean. | ||||
| Kaiser-Meyer-Olkin measure of sampling adequacy. | 0.505 | |
| Bartlett's test of sphericity | Approx. Chi-Square | 4.371 |
| DoF | 10 | |
| Sig. | 0.929 | |
| Moisture | pH | Protein | Ash | Carbohydrate | ||
| Anti-image covariance | Moisture | 0.720 | -0.229 | -0.038 | 0.060 | -0.328 |
| pH | -0.229 | 0.808 | 0.163 | 0.211 | 0.089 | |
| Protein | -0.038 | 0.163 | 0.910 | 0.028 | 0.186 | |
| Ash | 0.060 | 0.211 | 0.028 | 0.906 | -0.102 | |
| Carbohydrate | -0.328 | 0.089 | 0.186 | -0.102 | 0.747 | |
| Anti-image correlation | Moisture | 0.508a | -0.300 | -0.047 | 0.074 | -0.447 |
| pH | -0.300 | 0.510a | 0.190 | 0.247 | 0.115 | |
| Protein | -0.047 | 0.190 | 0.534a | 0.031 | 0.225 | |
| Ash | 0.074 | 0.247 | 0.031 | 0.537a | -0.125 | |
| Carbohydrate | -0.447 | 0.115 | 0.225 | -0.125 | 0.477a | |
| Note: a. Measures of sampling adequacy (MSA). | ||||||
| Component | Initial eigenvalues | Extraction sums of squared loadings | Rotation sums of squared loadings | ||||||
| Total | % of Variance | Cumulative % | Total | % of Variance | Cumulative % | Total | % of Variance | Cumulative % | |
| 1 | 1.706 | 34.111 | 34.111 | 1.706 | 34.111 | 34.111 | 1.617 | 32.341 | 32.341 |
| 2 | 1.248 | 24.968 | 59.079 | 1.248 | 24.968 | 59.079 | 1.337 | 26.739 | 59.079 |
| 3 | 0.912 | 18.234 | 77.313 | ||||||
| 4 | 0.684 | 13.679 | 90.992 | ||||||
| 5 | 0.450 | 9.008 | 100.000 | ||||||
| Note: Extraction method: principal component analysis. | |||||||||
| Component | ||
| 1 | 2 | |
| Moisture | 0.738 | -0.265 |
| pH | 0.313 | -0.744 |
| Protein | -0.532 | 0.049 |
| Ash | 0.113 | 0.813 |
| Carbohydrate | 0.824 | 0.221 |
| Note: Extraction method: principal component analysis; Rotation method: quartimax with Kaiser normalization; a. Rotation converged in three iterations. | ||
