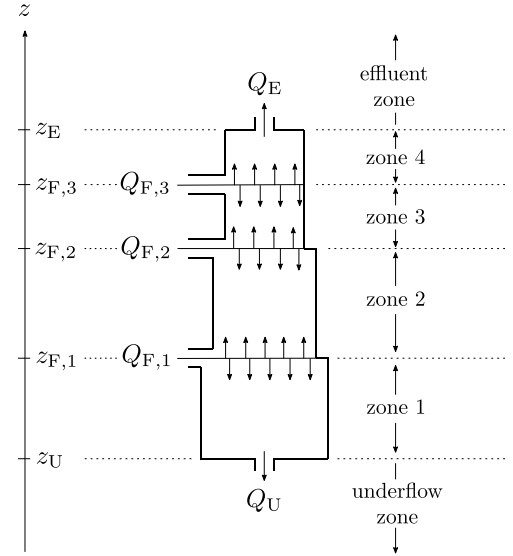
A triangular system of conservation laws with discontinuous flux that models the one-dimensional flow of two disperse phases through a continuous one is formulated. The triangularity arises from the distinction between a primary and a secondary disperse phase, where the movement of the primary disperse phase does not depend on the local volume fraction of the secondary one. A particular application is the movement of aggregate bubbles and solid particles in flotation columns under feed and discharge operations. This model is formulated under the assumption of a variable cross-sectional area. A monotone numerical scheme to approximate solutions to this model is presented. The scheme is supported by three partial theoretical arguments. Firstly, it is proved that it satisfies an invariant-region property, i.e., the approximate volume fractions of the three phases, and their sum, stay between zero and one. Secondly, under the assumption of flow in a column with constant cross-sectional area it is shown that the scheme for the primary disperse phase converges to a suitably defined entropy solution. Thirdly, under the additional assumption of absence of flux discontinuities it is further demonstrated, by invoking arguments of compensated compactness, that the scheme for the secondary disperse phase converges to a weak solution of the corresponding conservation law. Numerical examples along with estimations of numerical error and convergence rates are presented for counter-current and co-current flows of the two disperse phases.
Citation: Raimund Bürger, Stefan Diehl, M. Carmen Martí, Yolanda Vásquez. A difference scheme for a triangular system of conservation laws with discontinuous flux modeling three-phase flows[J]. Networks and Heterogeneous Media, 2023, 18(1): 140-190. doi: 10.3934/nhm.2023006
A triangular system of conservation laws with discontinuous flux that models the one-dimensional flow of two disperse phases through a continuous one is formulated. The triangularity arises from the distinction between a primary and a secondary disperse phase, where the movement of the primary disperse phase does not depend on the local volume fraction of the secondary one. A particular application is the movement of aggregate bubbles and solid particles in flotation columns under feed and discharge operations. This model is formulated under the assumption of a variable cross-sectional area. A monotone numerical scheme to approximate solutions to this model is presented. The scheme is supported by three partial theoretical arguments. Firstly, it is proved that it satisfies an invariant-region property, i.e., the approximate volume fractions of the three phases, and their sum, stay between zero and one. Secondly, under the assumption of flow in a column with constant cross-sectional area it is shown that the scheme for the primary disperse phase converges to a suitably defined entropy solution. Thirdly, under the additional assumption of absence of flux discontinuities it is further demonstrated, by invoking arguments of compensated compactness, that the scheme for the secondary disperse phase converges to a weak solution of the corresponding conservation law. Numerical examples along with estimations of numerical error and convergence rates are presented for counter-current and co-current flows of the two disperse phases.

| [1] |
Adimurthi, G. D. Veerappa Gowda, S. Mishra, Optimal entropy solutions for conservation laws with discontinuous flux, J. Hyperbolic Differ. Equ., 2 (2005), 1–56. https://doi.org/10.1142/S0219891605000361 doi: 10.1142/S0219891605000361

|
| [2] |
B. Andreianov, K. H. Karlsen, N. H. Risebro, A theory of ${L}^1$-dissipative solvers for scalar conservation laws with discontinuous flux, Arch. Ration. Mech. Anal., 201, (2011), 1–60. https://doi.org/10.1007/s00205-010-0389-4 doi: 10.1007/s00205-010-0389-4
|
| [3] |
B. Andreianov, C. Donadello, S. S. Ghoshal, U. Razafison, On the attainable set for a class of triangular systems of conservation laws, J. Evol. Equ., 15 (2015), 503–532. https://doi.org/10.1007/s00028-014-0267-x doi: 10.1007/s00028-014-0267-x
|
| [4] |
B. Andreianov, D. Mitrović, Entropy conditions for scalar conservation laws with discontinuous flux revisited, Ann. Inst. H. Poincaré C Anal. Non Linéaire, 32 (2015), 1307–1335. https://doi.org/10.1016/j.anihpc.2014.08.002 doi: 10.1016/j.anihpc.2014.08.002
|
| [5] |
A. Bressan, G. Guerra, W. Shen, Vanishing viscosity solutions for conservation laws with regulated flux, J. Differ. Equ., 266 (2018), 312–351. https://doi.org/10.1016/j.jde.2018.07.044 doi: 10.1016/j.jde.2018.07.044
|
| [6] |
R. Bürger, A. García, K. H. Karlsen, J.D. Towers, A family of numerical schemes for kinematic flows with discontinuous flux, J. Eng. Math., 60 (2008), 387–425. https://doi.org/10.1007/s10665-007-9148-4 doi: 10.1007/s10665-007-9148-4
|
| [7] |
S. Boscarino, R. Bürger, P. Mulet, G. Russo, L. M. Villada, Linearly implicit IMEX Runge-Kutta methods for a class of degenerate convection-diffusion problems, SIAM J. Sci. Comput., 37 (2015), B305–B331. https://doi.org/10.1137/140967544 doi: 10.1137/140967544
|
| [8] |
R. Bürger, S. Diehl, M. C. Martí, A conservation law with multiply discontinuous flux modelling a flotation column, Netw. Heterog. Media, 13 (2018), 339–371. https://doi.org/10.3934/nhm.2018015 doi: 10.3934/nhm.2018015
|
| [9] |
R. Bürger, S. Diehl, M. C. Martí, A system of conservation laws with discontinuous flux modelling flotation with sedimentation, IMA J. Appl. Math., 84 (2019), 930–973. https://doi.org/10.1093/imamat/hxz021 doi: 10.1093/imamat/hxz021
|
| [10] |
R. Bürger, S. Diehl, M. C. Martí, Y. Vásquez, Flotation with sedimentation: Steady states and numerical simulation of transient operation, Minerals Eng., 157 (2020), 106419. https://doi.org/10.1016/j.mineng.2020.106419 doi: 10.1016/j.mineng.2020.106419
|
| [11] |
R. Bürger, S. Diehl, M.C. Martí, Y. Vásquez, Simulation and control of dissolved air flotation and column froth flotation with simultaneous sedimentation, Water Sci. Tech., 81 (2020), 1723–1732. https://doi.org/10.2166/wst.2020.258 doi: 10.2166/wst.2020.258
|
| [12] | R. Bürger, S. Diehl, M. C. Martí, Y. Vásquez, A degenerating convection-diffusion system modelling froth flotation with drainage, arXiv: 2202.04679, [Preprint], (2022), [cited 2022 Nov 22 ]. Available from: https://doi.org/10.48550/arXiv.2202.04679 |
| [13] |
R. Bürger, K. H. Karlsen, N. H. Risebro, J. D. Towers, Well-posedness in $BV_t$ and convergence of a difference scheme for continuous sedimentation in ideal clarifier-thickener units, Numer. Math., 97 (2004), 25–65. https://doi.org/10.1007/s00211-003-0503-8 doi: 10.1007/s00211-003-0503-8
|
| [14] |
R. Bürger, K. H. Karlsen, H. Torres, J. D. Towers, Second-order schemes for conservation laws with discontinuous flux modelling clarifier-thickener units, Numer. Math., 116 (2010), 579–617. https://doi.org/10.1007/s00211-010-0325-4 doi: 10.1007/s00211-010-0325-4
|
| [15] |
R. Bürger, K. H. Karlsen, J. D. Towers, An Engquist-Osher-type scheme for conservation laws with discontinuous flux adapted to flux connections, SIAM J. Numer. Anal., 47 (2009), 1684–1712. https://doi.org/10.1007/s00211-010-0325-4 doi: 10.1007/s00211-010-0325-4
|
| [16] |
R. Bürger, K. H. Karlsen, J. D. Towers, On some difference schemes and entropy conditions for a class of multi-species kinematic flow models with discontinuous flux, Netw. Heterog. Media, 5 (2010), 461–485. https://doi.org/10.3934/nhm.2010.5.461 doi: 10.3934/nhm.2010.5.461
|
| [17] | G. M. Coclite, K. H. Karlsen, S. Mishra, N. H. Risebro, Convergence of vanishing viscosity approximations of $2\times 2$ triangular systems of multi-dimensional conservation laws, Boll. Unione Mat. Ital., 2 (2009), 275–284. |
| [18] |
G. M. Coclite, S. Mishra, N. H. Risebro, Convergence of an Engquist-Osher scheme for a multi-dimensional triangular system of conservation laws, Math. Comp., 79 (2010), 71–94. https://doi.org/10.1090/S0025-5718-09-02251-0 doi: 10.1090/S0025-5718-09-02251-0
|
| [19] |
M. G. Crandall, L. Tartar, Some relations between nonexpansive and order preserving mappings, Proc. Amer. Math. Soc., 78 (1980), 385–390. https://doi.org/10.1090/S0002-9939-1980-0553381-X doi: 10.1090/S0002-9939-1980-0553381-X
|
| [20] |
V. G. Danilov, D. Mitrovic, Delta shock wave formation in the case of triangular hyperbolic system of conservation laws. J. Differ. Equ., 245 (2008), 3704–3734. https://doi.org/10.1090/S0025-5718-09-02251-0 doi: 10.1090/S0025-5718-09-02251-0
|
| [21] |
J. E. Dickinson, K. P. Galvin, Fluidized bed desliming in fine particle flotation, Part Ⅰ, Chem. Eng. Sci., 108 (2014), 283–298. https://doi.org/10.1016/j.ces.2013.11.006 doi: 10.1016/j.ces.2013.11.006
|
| [22] |
S. Diehl, On scalar conservation laws with point source and discontinuous flux function, SIAM J. Math. Anal., 26 (1995), 1425–1451. https://doi.org/10.1137/S0036141093242533 doi: 10.1137/S0036141093242533
|
| [23] |
S. Diehl, A conservation law with point source and discontinuous flux function modelling continuous sedimentation, SIAM J. Appl. Math., 56 (1996), 388–419. https://doi.org/10.1137/S0036139994242425 doi: 10.1137/S0036139994242425
|
| [24] |
S. Diehl, Operating charts for continuous sedimentation Ⅰ: control of steady states, J. Eng. Math., 41 (2001), 117–144. https://doi.org/10.1023/A:1011959425670 doi: 10.1023/A:1011959425670
|
| [25] |
S. Diehl, The solids-flux theory—confirmation and extension by using partial differential equations, Water Res. 42 (2008), 4976–4988. https://doi.org/10.1016/j.watres.2008.09.005 doi: 10.1016/j.watres.2008.09.005
|
| [26] |
B. Engquist, S. Osher, One-sided difference approximations for nonlinear conservation laws, Math. Comp., 36 (1981), 321–351. https://doi.org/10.1090/S0025-5718-1981-0606500-X doi: 10.1090/S0025-5718-1981-0606500-X
|
| [27] | J. A. Finch, G. S. Dobby, Column Flotation, London: Pergamon Press, 1990. |
| [28] |
K. P. Galvin, J. E. Dickinson, Fluidized bed desliming in fine particle flotation Part Ⅱ: Flotation of a model feed, Chem. Eng. Sci., 108 (2014), 299–309. https://doi.org/10.1016/j.ces.2013.11.027 doi: 10.1016/j.ces.2013.11.027
|
| [29] | T. Gimse, N. H. Risebro, Riemann problems with a discontinuous flux function. Third International Conference on Hyperbolic Problems, Theory, Numerical Methods and Applications, 1 (1991), 488–502. |
| [30] | H. Holden, N. H. Risebro, Front Tracking for Hyperbolic Conservation Laws, 2nd edition, Berlin: Springer Verlag, 2015. |
| [31] | E. L. Isaacson, J. B. Temple, Analysis of a singular hyperbolic system of conservation laws, J. Differ. Equ., 65 (1986), 250–268. |
| [32] |
K. H. Karlsen, S. Mishra, N. H. Risebro, Semi-Godunov schemes for general triangular systems of conservation laws, J. Eng. Math., 60 (2008), 337–349. https://doi.org/10.1007/s10665-007-9163-5 doi: 10.1007/s10665-007-9163-5
|
| [33] |
K. H. Karlsen, S. Mishra, N. H. Risebro, Convergence of finite volume schemes for triangular systems of conservation laws, Numer. Math., 111 (2009), 559–589. https://doi.org/10.1007/s00211-008-0199-x doi: 10.1007/s00211-008-0199-x
|
| [34] |
K. H. Karlsen, N. H. Risebro, Convergence of finite difference schemes for viscous and inviscid conservation laws with rough coefficients, ESAIM: Math. Model. Numer. Anal., 35 (2001), 239–269. https://doi.org/10.1051/m2an:2001114 doi: 10.1051/m2an:2001114
|
| [35] | K. H. Karlsen, N. H. Risebro, J. D. Towers, $L^1$ stability for entropy solutions of nonlinear degenerate parabolic convection-diffusion equations with discontinuous coefficients, Skr. K. Nor. Vidensk. Selsk., 3 (2003), 1–49. |
| [36] |
K. H. Karlsen, J. D. Towers, Convergence of a Godunov scheme for conservation laws with a discontinuous flux lacking the crossing condition, J. Hyperbolic Differ. Equ., 14 (2017), 671–701. https://doi.org/10.1142/S0219891617500229 doi: 10.1142/S0219891617500229
|
| [37] | S. N. Kružkov, First order quasi-linear equations in several independent variables, Math. USSR Sb., 10 (1970), 217–243. |
| [38] |
G. J. Kynch, A theory of sedimentation, Trans. Faraday Soc., 48 (1952), 166–176. https://doi.org/10.1039/tf9524800166 doi: 10.1039/tf9524800166
|
| [39] |
D. Mitrovic, New entropy conditions for scalar conservation laws with discontinuous flux, Discrete Contin. Dyn. Syst., 30 (2011), 1191–1210. https://doi.org/10.3934/dcds.2011.30.1191 doi: 10.3934/dcds.2011.30.1191
|
| [40] |
D. Mitrovic, V. Bojkovic, V. G. Danilov, Linearization of the Riemann problem for a triangular system of conservation laws and delta shock wave formation process, Math. Meth. Appl. Sci., 33 (2010), 904–921. https://doi.org/10.1002/mma.1226 doi: 10.1002/mma.1226
|
| [41] |
R. Pal, J. H. Masliyah, Flow characterization of a flotation column, Canad. J. Chem. Eng., 67 (1989), 916–923. https://doi.org/10.1002/cjce.5450670608 doi: 10.1002/cjce.5450670608
|
| [42] |
R. Pal, J. H. Masliyah, Oil recovery from oil in water emulsions using a flotation column, Canad. J. Chem. Eng., 68 (1990), 959–967. https://doi.org/10.1002/cjce.5450680611 doi: 10.1002/cjce.5450680611
|
| [43] |
E. Yu. Panov, Existence and strong pre-compactness properties for entropy solutions of a first-order quasilinear equation with discontinuous flux, Arch. Rational Mech. Anal., 195 (2010), 643–673. https://doi.org/10.1007/s00205-009-0217-x doi: 10.1007/s00205-009-0217-x
|
| [44] |
E. Yu. Panov, Erratum to: Existence and strong pre-compactness properties for entropy solutions of a first-order quasilinear equation with discontinuous flux, Arch. Rational Mech. Anal., 196 (2010), 1077–1078. https://doi.org/10.1007/s00205-009-0217-x doi: 10.1007/s00205-009-0217-x
|
| [45] |
P. Quintanilla, S. J. Neethling, P. R. Brito-Parada, Modelling for froth flotation control: A review, Min. Eng., 162 (2021), 106718. https://doi.org/10.1016/j.mineng.2020.106718 doi: 10.1016/j.mineng.2020.106718
|
| [46] | J. F. Richardson, W. N. Zaki, Sedimentation and fluidisation: Part Ⅰ, Trans. Instn. Chem. Engrs. (London), 32 (1954), 35–53. |
| [47] | M. D. Rosini, Systems of conservation laws with discontinuous fluxes and applications to traffic, Ann. Univ. Mariae Curie-Skłodowska Sect. A, 73 (2019), 135–173. |
| [48] | C. O. R. Sarrico, A distributional product approach to $\delta$-shock wave solutions for a generalized pressureless gas dynamic system, Int. J. Math., 25, (2014), 145007. |
| [49] |
W. Shen, On the Cauchy problems for polymer flooding with gravitation, J. Differ. Equ., 261 (2016), 627–653. https://doi.org/10.1016/j.jde.2016.03.020 doi: 10.1016/j.jde.2016.03.020
|
| [50] |
P. Stevenson, P. S. Fennell, K. P. Galvin, On the drift-flux analysis of flotation and foam fractionation processes, Canad. J. Chem. Eng., 86 (2008), 635–642. https://doi.org/10.1002/cjce.20076 doi: 10.1002/cjce.20076
|
| [51] | J. Vandenberghe, J. Chung, Z. Xu, J. Masliyah, Drift flux modelling for a two-phase system in a flotation column, Canad. J. Chem. Eng., 83 (2005), 169–176. |
| [52] | Y. Vásquez, Conservation Laws with Discontinuous Flux Modeling Flotation Columns, (Spanish), Doctoral Thesis of Universidad de Concepción, Concepción, 2022. |
Figures(8) / Tables(2)
Raimund Bürger, Stefan Diehl, M. Carmen Martí, Yolanda Vásquez. A difference scheme for a triangular system of conservation laws with discontinuous flux modeling three-phase flows[J]. Networks and Heterogeneous Media, 2023, 18(1): 140-190. doi: 10.3934/nhm.2023006


 DownLoad: