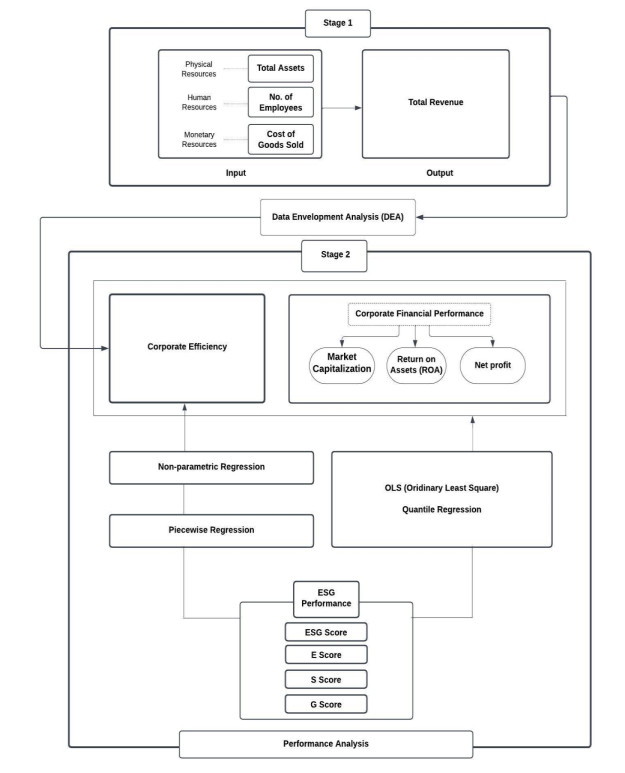
Figure 1.
Analytical Framework of the Study.


Citation: Yuri Pevzner, Daniel N. Santiago, Jacqueline L. von Salm, Rainer S. Metcalf, Kenyon G. Daniel, Laurent Calcul, H. Lee Woodcock, Bill J. Baker, Wayne C. Guida, Wesley H. Brooks. Virtual target screening to rapidly identify potential protein targets of natural products in drug discovery[J]. AIMS Molecular Science, 2014, 1(2): 81-98. doi: 10.3934/molsci.2014.2.81
| [1] | Zhang Jing, Gazi Md. Shakhawat Hossain, Badiuzzaman, Md. Shahinur Rahman, Najmul Hasan . Does corporate reputation play a mediating role in the association between manufacturing companies' corporate social responsibility (CSR) and financial performance?. Green Finance, 2023, 5(2): 240-264. doi: 10.3934/GF.2023010 |
| [2] | Amr ElAlfy, Adel Elgharbawy, Tia Rebecca Driver, Abdul-Jalil Ibrahim . Sustainability disclosure in the Gulf Cooperation Council (GCC) countries: Opportunities and Challenges. Green Finance, 2025, 7(1): 40-82. doi: 10.3934/GF.2025003 |
| [3] | Mengze Wu, Dejun Xie . The impact of ESG performance on the credit risk of listed companies in Shanghai and Shenzhen stock exchanges. Green Finance, 2024, 6(2): 199-218. doi: 10.3934/GF.2024008 |
| [4] | Óscar Suárez-Fernández, José Manuel Maside-Sanfiz, Mª Celia López-Penabad, Mohammad Omar Alzghoul . Do diversity & inclusion of human capital affect ecoefficiency? Evidence for the energy sector. Green Finance, 2024, 6(3): 430-456. doi: 10.3934/GF.2024017 |
| [5] | Zach Williams, Heather Apollonio . The causation dilemma in ESG research. Green Finance, 2024, 6(2): 265-286. doi: 10.3934/GF.2024011 |
| [6] | Rongwu Zhang, Huaqian Chen, Wenjia Zhang, Tong Lu . Does ESG performance inhibit or promote herding behavior of institutional investors?. Green Finance, 2025, 7(2): 363-380. doi: 10.3934/GF.2025013 |
| [7] | Sabuj Saha, Ahmed Rizvan Hasan, Kazi Rezwanul Islam, Md Asraful Islam Priom . Sustainable Development Goals (SDGs) practices and firms' financial performance: Moderating role of country governance. Green Finance, 2024, 6(1): 162-198. doi: 10.3934/GF.2024007 |
| [8] | Siming Liu, Xiaoyan Shen, Tianpei Jiang, Pierre Failler . Impacts of the financialization of manufacturing enterprises on total factor productivity: empirical examination from China's listed companies. Green Finance, 2021, 3(1): 59-89. doi: 10.3934/GF.2021005 |
| [9] | Rizwan Ullah Khan, Hina Arif, Noor E Sahar, Arif Ali, Munir A. Abbasi . The role of financial resources in SMEs' financial and environmental performance; the mediating role of green innovation. Green Finance, 2022, 4(1): 36-53. doi: 10.3934/GF.2022002 |
| [10] | Manrui Xu, Khaldoon Albitar, Zhenghui Li . Does corporate financialization affect EVA? Early evidence from China. Green Finance, 2020, 2(4): 392-408. doi: 10.3934/GF.2020021 |
Abbreviations: ESG: Environmental, social, and governance; CSR: Corporate social responsibility; CE: Corporate efficiency; CFP: Corporate financial performance; DEA: Data Envelopment Analysis; OLS: Ordinary least squares; QR: Quantile regression; RBV: Resource based view; PAT: Profit after tax; ROA: Return on assets; ROE: Return on equity; VRS: Variable Returns to Scale; COGS: Cost of goods sold; R & D: Research and development; DMU: Decision making unit
In recent times, when it comes to sustainability, discussions primarily revolve around pressing environmental issues like climate change, global warming, resource depletion, etc (Mohieldin et al., 2023). Unsustainable corporate practices, emissions, and overuse of resources have contributed to the current state of environmental degradation. As there is a significant rise in environmental issues like pollution, climate change, global warming, and resource depletion, companies are encouraged to adopt sustainable and environmentally friendly practices. An increase in social issues like human rights, equity, diversity, labor practices, and social inclusion pressured companies to be more transparent and responsible. Contemporary governance issues around board diversity, management compensation, corporate social responsibility (CSR) practices, and firm ethics have now become standard for assessing overall responsibility and accountability. Also, there is ample evidence of CSR in the sphere of international business, which justifies recognizing CSR as an essential component of international corporate governance (Paul, 2024). Thus, the adoption of these sustainable business practices is needed to mitigate sustainability concerns and is currently a top priority in today's competitive business environment (Sarkar, 2022). In this context, the concept of Environmental, Social, and Governance (ESG) integration has gained significant attention in the field of corporate sustainability.
This ESG integration not only helps reduce the risks related to climate change and other sustainability concerns, but also enhances long-term value creation, aligns with investor expectations, strengthens business reputation, and encourages innovation and economic prospects (Smith & Sharicz, 2011). Thus, ESG integration has significantly changed the business model and transformed the business landscape, priorities, and strategies. This transformation persuades organizations to change their mission and vision to make them in line with sustainability objectives (Arvidsson & Dumay, 2022). As investors increasingly consider non-financial parameters like ESG factors, businesses are driven to improve their ESG performance and ESG-related issues to satisfy the stakeholders including investors (Hanson et al., 2013).
Recently, considerable literature has grown up around the theme of ESG performance across different industries for several aspects (Wu & Xie, 2024; Shi et al., 2023; Kartal et al., 2024; Kurt & Peng, 2021). In this regard, studies claim that adopting these responsible business practices can significantly impact a firm's financial and efficiency measures including market performance, stock liquidity, innovation, excess stock returns, and reducing carbon emissions (Cao et al. 2024; Chen et al., 2023; Habib, 2023a; Kuo et al., 2023; Lu et al., 2023; Ma et al., 2024; Hong et al., 2020). These investigations have furnished valuable understandings, revealing both positive and negative associations between ESG performance and various aspects of firm performance (Saha et al., 2024; Zhou et al., 2023; Khan & Liu, 2023; Wang et al., 2023).
When it comes to firm performance, the literature suggests two measures viz., internal and external. Internal measures focus on the inner workings of the organizations and corporate efficiency (CE). These internal measures are meant to satisfy the internal stakeholders like management, the board of directors, and the shareholders. Whereas, external measures focus on relationship building and primarily revolve around corporate financial performance (CFP). These external measures are meant to satisfy external stakeholders like creditors, customers, and governments. Thus, CE and CFP are the major significant indicators for assessing the firm performance. CE is the optimal use of input resources, such as time, labor, and capital, to minimize waste and lower operational costs (Hanousek et al., 2015). This efficiency gives a company a competitive advantage by allowing it to produce goods or services at a lower cost or of higher quality than its competitors. It also increases revenue, and customer satisfaction through faster delivery times, improved product quality, and superior customer service. Efficiency is frequently associated with sustainability efforts, as optimizing resource use and reducing waste lead to more environmentally friendly practices (Moskovics et al., 2024). On the other hand, CFP is a metric that measures a company's profitability and overall financial value (Cho & Lee, 2019). Strong financial performance demonstrates a company's ability to generate profits, which is critical to its survival and growth (Chen et al., 2023). It attracts investors, who provide the capital required for growth and strategic initiatives. Financially strong businesses are better able to manage and service their debt, lowering financial risk. Furthermore, strong financial performance raises market valuation, impacting shareholder wealth and market perception (Xie et al., 2019). It also has a positive impact on employee morale and retention (Joseph & Shrivastava, 2024).
Several studies have been undertaken to analyze the interconnectedness among ESG, CE, and CFP (Xie et al., 2019; Moskovics et al., 2024; Veltri et al., 2023; Hanousek et al., 2015). These investigations showed mixed results. For instance, Habib & Mourad (2023a) found that companies with heightened ESG practices have better financial performance. In the case of an M & A deal, Feng (2021) showed that the high ESG score of the target firm positively impacts the performance of the acquirer. Moreover, Habib and Mourad (2023b) developed an intellectual capital efficiency (ICE) model which suggests that investors can generate better returns if companies prioritize ICE. Several authors have attributed this positive relationship to the mediator-moderator connection. For example, Habib (2023b) discovered that ESG performance and firm performance play a mediating role in the relationship between real exchange management and enterprise value. Corporate governance, which is a dimension of ESG, was found to significantly moderate the relationship between financial flexibility and firm performance (Wu et al., 2023). Habib (2023a) revealed that ESG has a negative influence on financial distress. Regarding CE, a significant positive relationship was established by Xie et al. (2019) and Moskovics et al. (2024); however, an insignificant relationship was found by Veltri et al. (2023). Results from the earlier studies largely highlight a positive relationship between ESG and CFP but failed to identify the mechanism behind this relationship. To address these ESG issues multiple theories like stakeholder theory, legitimacy theory, resourced-based view (RBV), etc., have been put forward to provide explanations.
So far, most researchers have focused on only examining the impact of overall ESG score and individual ESG pillars but has largely ignored the specific environmental, social, and governance activities that are primarily responsible for driving the firm performance (Achim & Nicolae Borlea, 2014; Chouaibi et al., 2022; Edwards, 2014; Erol, 2023). Investigating only the overall ESG and its components (E, S, and G) may not provide a thorough understanding of ESG practices (Habib & Mourad 2023a). Despite researchers that have investigated whether a strong ESG performance translates into noticeable advantages for external financial performance, there has been hardly any empirical investigation between ESG disclosure and internal performance i.e., corporate efficiency. Further, researchers have failed to identify the mechanism through which ESG practices channel into external financial performance. Moreover, researchers have focused on recognizing linear relationships and predominantly evaluated the average effect of ESG performance on various aspects of firm performance (Li et al., 2020; Alam et al., 2022; Kalia & Aggarwal, 2023; Khoury et al., 2021; Liu et al., 2022; Makridou et al., 2023). However, most researchers have ignored the variations across different quantiles or the distributional aspect of firm performance including the possibility of nonlinear behavior. When scrutinizing the data distribution of the study, it becomes evident that efficiency scores, financial performance metrics, and market value indicators are distributed heterogeneously across quantiles, suggesting that a deeper examination is justified.
These limitations in prior research highlight the need for a more comprehensive examination of the ESG-CFP relationship across various dimensions and distributional perspectives. The explanations for these limitations and uncertainties can be found in the stakeholder theory and RBV. Thus, these theories become the motivation and guiding principle of ESG as they advocate a holistic and responsible approach to business practices. It recognizes that corporate success goes beyond financial metrics and should cover a wide array of stakeholders including internal and external. The growing body of research reflects the increasing recognition that a company's actions in areas like environmental preservation, social responsibility, and corporate governance practices can have far-reaching implications beyond ethical considerations. Therefore, ESG has become a central focus for businesses worldwide as they strive to balance profitability with responsibility towards society.
Therefore, our purpose of this study was to explore and identify the specific ESG activities that drive the internal and external performance of a firm while determining the nature of the relationship between ESG performance and corporate efficiency, whether linear or non-linear. This paper places a stronger emphasis on the analysis of internal performance, particularly corporate efficiency, and how the ESG performance channelizes into improved external financial performance through internal performance (Lin et al., 2009; Zheka, 2005). Thus, some of the research questions include: (1) Does commitment to address ESG issues lead to improved corporate efficiency, financial performance, and market value? (2) If such a commitment does improve the firm performance, then to what degree and direction do overall ESG and individual E, S, and G pillars exert an impact on corporate efficiency and corporate financial performance? (3) Which micro dimensions of ESG activities are the driving force and responsible for this relationship? (4) What kind of relationship exists between ESG performance and corporate efficiency: whether linear or non-linear? And (5) How internal performance, i.e., corporate efficiency, channelizes and mediates the relationship between ESG performance and external financial performance.
Studying the relationship among ESG performance, CE, and CFP is crucial for having a complete understanding of modern corporate behavior. It can widen the knowledge of how ESG initiatives affect operational efficiency and financial outcomes, thereby aiding strategic decision-making. It also demonstrates how ESG performance can help attract investors, increase customer loyalty, and improve employee satisfaction. Furthermore, the findings can help policymakers design regulations that promote sustainable practices and contribute to the creation of benchmarks for measuring and reporting ESG performance. Ultimately, this research contributes to the achievement of the Sustainable Development Goals (SDGs) and assists businesses against emerging global challenges, ensuring long-term sustainability and resilience.
This paper makes several unique contributions to the existing body of literature through the relationship of ESG-CFP analysis. First, to the best of our knowledge, this study is one of the first to assess the effects of micro-level specific ESG activities that drive internal and external performance. To address this, we conduct a comprehensive analysis of ESG performance by considering three distinct dimensions of environmental activities, four dimensions of social activities, and three dimensions of governance activities. Second, we are the first to apply the mediation analysis to investigate the channel and path through which ESG performance results in better financial performance. The study of this internal qualitative latent measure, i.e., corporate efficiency as a mediator between ESG performance and external financial performance, is also shown for the first time in the ESG literature. Third, very few researchers have measured the non-linear relationship between ESG performance and corporate efficiency. Consequently, this research makes a valuable addition to the existing literature by examining the influence of ESG performance on corporate efficiency across varying levels of ESG disclosure. Also, the quantile approach is applied to demonstrate the distributional effects and to gain insights into two-tail information associated with the ESG-CFP relationship. Finally, these findings are aligned with various theories of ESG like shareholder theory, legitimacy theory, stakeholder theory, and RBV.
The remainder of the paper is structured as follows. In Section 2, we provide the theoretical background for the study. In Section 3, we provide an overview of relevant literature and identify research gaps. In Section 4, we provide details for the data sources and methods used in the study, followed by empirical findings and discussions in Section 5 and Section 6, respectively. Finally, we outline the conclusion in Section 7.
While traditional forms for evaluating business performances heavily rely on various financial parameters like revenue growth, profitability, earnings per share, price-earnings ratio, cash flows, etc., the current evaluation process prioritizes corporate sustainability. Corporate sustainability integrates ESG considerations into the process of making financial decisions and practices.
The appearance of Shareholder Theory marked the beginning of contemporary ESG investment (Friedman, 1970). Friedman, in this theory, argued that maximizing profit and shareholder value are the only responsibilities of a business. Apart from that business has no separate responsibility towards society. This theory faced huge criticism from socially responsible investors. The limitation of this theory is replaced by the Legitimacy Theory. In Legitimacy Theory, Dowling and Pfeffer (1975) state that a company should engage in those activities, which are considered legitimate. Moreover, it should not go beyond the constraints and norms set by society. This theory tried to explain the moral obligations of a business towards society and the environment. The Legitimacy Theory is complemented by the Stakeholder Theory. Freeman (1984)'s Stakeholder Theory looks into the relationship of an organization with various groups of stakeholders that comprise the firm's business environment. The management is accountable to all its stakeholders like shareholders, employees, creditors, customers, governments, etc. Moreover, the resource allocation theory emphasizes the optimum allocation of organizational resources to minimize the costs involved and maximize the output. In addition, the resource-based view (RBV) hypothesis complements this theory by asserting that organizations should develop core competencies and capabilities to achieve sustainable competitive advantage (Lin & Wu, 2014). To summarize, all these theories are based on the concept of "Doing well by doing good", which refers to the idea that companies that prioritize society, sustainability, and responsible business practices can also deliver strong financial performance and generate value for their stakeholders. In other words, it implies that there doesn't have to be a trade-off between financial performance and ethical or sustainable practices; a company can excel in both areas.
This study is based on theories like legitimacy theory, stakeholder theory, and RBV. Legitimacy, as defined by Suchman (1995), refers to the societal perception and evaluation of a firm based on its actions. He emphasized that the legitimacy of a society is contingent upon the values it possesses and the duties it deems acceptable. Since ESG activities are undertaken by the firms to have a positive impact on the environment and society, they can be considered legitimate. Further, a corporation is a part of society and it uses the resources of the society. Thus, any action by a corporation has some externalities on the stakeholders and it can be positive or negative. Therefore, it becomes the responsibility of a corporation to act for the benefit of the stakeholders. Through this, the stakeholder theory comes into the picture. Stakeholder theory states that an organization's market performance can benefit from ESG activities (Lee & Isa, 2020). The RBV stresses developing core competencies to achieve sustainable competitive advantage. These competencies can also be in the form of efficiency. Therefore, the RBV can be regarded as valid since implementing ESG principles increases a company's operational efficiency by minimizing input resources and maximizing output.
Accordingly, this study methodology consists of two stages. The first stage involves estimating corporate efficiency using DEA analysis. The second stage involves Regression analysis to establish the relationship between the variables of interest. Finally, additional analysis is conducted to establish the mediating effect. The study's analytical framework is presented in Figure 1.
Both corporate financial performance and corporate efficiency may appear similar, but they serve different purposes when evaluating the overall performance of a business. Corporate efficiency examines the inner workings of an organization, focusing on the utilization of resources and processes to produce goods or services. Corporate efficiency measures productivity, process effectiveness, and resource utilization by focusing on ways to eliminate unproductive procedures and waste. Thus, corporate efficiency is the concept of how effectively a firm uses its input resources like people, time, money, and efforts to achieve desired goals and outputs while minimizing resource wastage (Hanousek et al., 2015). In this regard, Wu et al. (2023) showed how efficiency in investment decisions of a corporation, along with financial flexibility, cope with uncertainty to enhance financial performance. This corporate investment efficiency is influenced by financial flexibility by reducing overinvestment and thus contributing to accounting and market performance (Wu et al., 2024). In this context, two aspects are considered viz., input-oriented and output-oriented efficiency. Input-oriented efficiency or cost-minimization efficiency focuses on input resource minimization for a given level of output while output-oriented efficiency or profit maximization efficiency aims to maximize output from a specific level of input resources.
In contrast, corporate financial performance prioritizes the financial results of a corporation and impacts the external stakeholders. Profitability, liquidity, solvency, and shareholder value creation are all considered important under this view. Financial performance measures like revenue, income, return on assets (ROA), and return on equity (ROE) provide an overview of a company's financial situation and well-being. External users like, investors and lenders use various financial parameters to evaluate stability and profitability. Currently, the major concerns in business performance involve reassessing companies' business models and key performance matrices to achieve sustained performance maximization (Alkaraan, 2023a). Also, for a corporation to achieve objectives and long-term success, it must balance between operational efficiency and financial performance.
In the area of academics and business, substantial attention has been paid to finding the relationship between ESG performance and financial performance. Several researchers have demonstrated an association between strong ESG practices and improved financial results. For instance, Kalia and Aggarwal (2023), Buallay (2019), and Chouaibi et al. (2022) discovered a positive relation between ESG performance and key financial metrics, including net profit, ROA, ROE, market capitalization, Tobin's Q, and stock market performance. Alkaraan et al. (2024) discovered how green strategic investment decision-making practices (GSIDMP) are shaped by the boardroom capabilities and corporate governance mechanisms and how GSIDMP channels towards sustainability through mediation analysis. Moreover, ESG practices interact more with the corporate transformation towards industry 4.0 (CTTI4.0) to improve the financial performance of firms in the UK (Alkaraan et al., 2022). These findings suggest that companies prioritizing ESG factors may enjoy improved financial performance. In contrast, several other studies have identified a negative relationship suggesting that highly stringent ESG practices might lead to diminishing financial returns and market value (Khoury et al. 2021; Liu et al. 2022). For instance, an excessive focus on ESG initiatives diverts attention away from the core business operations and can result in lower financial performance. This suggests that an overly focused approach to sustainability, without considering the specific needs of an organization, can have adverse consequences on financial outcomes.
Adding to the existing linear relationship, recent research has established an interesting U-shaped association between ESG disclosure and financial performance (El Khoury et al. 2021; Wu and Chang 2022). This approach challenges the traditional linear relationships and suggests the impact of ESG practices on financial outcomes to be curvilinear. For example, at lower levels of ESG performance, financial benefits may appear to decline. However, as ESG performance improves and reaches a particular level, the magnitude of these financial benefits increases. ESG performance reaches its apex at higher levels.
However, significant attention has been towards linear and non-linear relationships, the distribution of dependent variables across quantiles is, however, a significant limitation of the existing research. Although numerous studies have examined this complex relationship, only a few have investigated how ESG practices influence different segments or quantiles of financial performance indicators. Since ESG and its pillars are meant to improve financial performance according to a large no of studies, we formulate our Hypotheses as:
Hypothesis 1. There is a positive influence of overall ESG performance on corporate efficiency.
Hypothesis 2. There is a positive influence of the environmental pillar on corporate efficiency.
Hypothesis 3. There is a positive influence of the social pillar on corporate efficiency.
Hypothesis 4. There is a positive influence of the governance pillar on corporate efficiency.
ESG activities consist of various components that comprise the pillars of Environmental, Social, and Governance principles. Each pillar represents an essential element of sustainable and responsible business practices. The environmental pillar includes activities like climate change mitigations, resource conservation, waste reduction, and circular economy. Coming to the social pillar, factors including diversity, inclusion, human rights, labor practices, and community engagement are considered important. Further, the governance pillar generally consists of factors like board independence, committee roles, risk management, CSR policy, etc., These activities are undertaken by a company to run smoothly.
Environmental activities bring innovation to organizations and the development of new eco-friendly products, which brings efficiency in the production process, reduces wastage, and helps in cost savings. Thus, efficiency helps in channelizing and acts as a moderator in improving the financial performance of the company. Some studies found positive associations between environmental activities and corporate performance (Khan et al., 2022; King and Lenox 2001; Liu 2020; Molina-Azorín et al. 2009). For example, Edwards (2014) shows that financial performance is positively impacted by environmental practices and there is no penalty for taking proactive environmental measures. Achim and Nicolae Borlea (2014) revealed an investment in environmental initiatives is seen as "good news" as that will contribute to the company's long-term viability. Thus, our next hypothesis is:
Hypothesis 5. There is a positive influence of environmental activities on corporate efficiency.
Promotion of socio-economic initiatives may help in building better relationships and encourage welfare for society (Tetrault & Lamertz, 2007). A firm's profits can be enhanced through promoting such social activities, which may end up in sustainable financial development as evaluated in studies (Wasiuzzaman et al. 2023; Orlitzky & Benjamin, 2001). Nair and Wahh (2017) applied an approach of "strategic CSR responsibility" in their study. As mentioned in that approach, firms can improve their capacity along with competitive strength with an efficient financial performance by applying the strategic mechanism of social responsibilities with their main course of operations. An example shows that the expenses incurred on employee development and initiatives, i.e., employee's social well-being help in increasing their productivity by removing the attrition factor (Joseph & Shrivastava, 2024).
This process automatically improves financial performance by optimizing the technical efficiency of the employees (Chang et al. 2021a; Hasan et al. 2016). In addition to this marketing strategies i.e., brand equity, market value, goodwill, and customer satisfaction may help to raise initiatives like social well-being for improving the firm's reputation (Subramaniam et al., 2020; Jing et al., 2023). In social welfare principles, the risk attached to some negative social elements can be averted with the encouragement of practices like social participation. (Lu et al. 2022).
Hypothesis 6. Corporate efficiency is influenced positively by social activity initiatives.
Just like social activities, governance activities consist of a spectrum of procedures and guidelines that help firms in their decision-making process, improved accountability, ethical behavior, and transactional transparency. Alkaraan et al. (2023) establish that governance measures like ESG, board composition, internal audit, and risk management support the association between sustainable investment decision-making practices and company performance. In some studies, it has been shown that practices of good governance are important in sustaining and achieving positive financial performance (Bhagat and Bolton 2008, 2019). The impact of boardrooms' homogeneity and heterogeneity have been scrutinized under various circumstances (Alkaraan, 2023). A key component of good governance is the independence of the composition of the board of directors (Arora & Sharma, 2016). The ownership concentration among the listed insurance firms positively impacts financial performance as few large shareholders have the discretionary power to monitor the firm closely (Junaid et al., 2020). Financial efficiency can be improved by boards that are more ethically governed and are interested in smooth functioning strategies and operations-related decisions (Liu et al., 2015; Shan, 2019).
Financial or accounting irregularities and detrimental corporate reputations can all be avoided with the help of a well-governed board (Hamdan & Al Mubarak, 2017). Further, transparent, responsible, and accountable business practices can increase investor confidence, and market value (Bai et al., 2004). Governance initiatives can support a culture of honesty and ethical behavior within an organization. It has a significant influence on financial performance by influencing strategic decision-making, risk management, transparency, and ethical behavior. These practices contribute to an organization's overall stability and sustainability, which can lead to improved financial outcomes. Thus, our next Hypothesis is:
Hypothesis 7. There is a positive influence of governance activities on corporate efficiency.
Significant research has been conducted on the ESG-CFP relationship but not on ESG performance and corporate efficiency, and also there is no consensus regarding the nature of this relationship. For example, Chang et al. (2021) emphasized the role of ESG and digital finance in enhancing efficiency, indicating a possible positive correlation. Moskovics et al. (2024) found that lower ESG and corporate governance practices were related to higher efficiency in Brazil. In contrast to these findings, Uribe-Bohorquez et al. (2019) found that women directors reduce a company's technical efficiency. Using the MPI-DEA model, Habib and Mourad (2023b) developed an intellectual capital efficiency (ICE) model and proposed that companies that emphasize ICE can yield higher returns for investors. Further, Veltri et al. (2023) found that ESG factors did not improve the efficiency of utilities or reduce credit risk in banks. In light of this variety of viewpoints, we can say that the views are mixed. The relationship between ESG performance and corporate efficiency is neither simple nor linear; rather, it appears to be non-linear or curvilinear, characterized by complexities and variations that need further investigation. Thus, our Hypothesis 8 is:
Hypothesis 8. There is a non-linear or curvilinear relationship between overall ESG and individual ESG pillars with corporate efficiency
Summing up, Table 1 presents the summary of some important literature. Previously, academicians have explored the ESG-CFP relationship, but studies are limited when corporate efficiency is concerned. Additionally, when it comes to mediation analysis, past studies ignored a significant qualitative latent internal variable known as corporate efficiency, which has the potential to function as a mediator. Further, there is scanty literature on the distributional and non-linear aspects. Finally, no previous literature has identified the micro-level ESG activities that are primarily responsible and drivers of better CFP. Thus, this study is designed to address these limitations and bridge the gaps.
| Author(s) | Year | Country/Region | Dimensions | Findings |
| Agarwala et al. (2024) | 2014 – 2022 | 305 companies listed in the NSE 500 | ESG and Firm Performance | The results indicate a U-shaped non-linear relationship between ESG disclosures and market performance of business enterprises |
| Wu et al. (2024) | 2018 – 2022 | 494 non-financial listed Chinese firms | ESG and firm financial performance | A significant and positive impact of ESG and its sub-dimensions (i.e., environment, social, and governance) on firm performance. |
| Narula et al. (2024) | 2018 – 2020 | India, 220 companies | ESG and Firm Performance | The performance of a firm is not substantially correlated with any of the ESG components. |
| Habib (2023) | 2016 – 2020 | 406 US firms | ESG and Firm Performance | Higher ESG performances have a better relation with firm performance. |
| Rahman et al. (2023) | 2016 – 2020 | 255 non-financial firms listed on the Pakistani stock exchange | ESG and Firm Performance | ESG and all of its dimensions positively affect ROA and Tobin's Q with a moderating effect of top management commitment and sustainability strategy. |
| Bissoondoyal-Bheenick et al. (2023) | 2007 – 2020 | G20 countries | ESG and Firm Performance | Larger firms tend to invest in ESG activities due to economies of scale, firms with better media coverage can reduce information asymmetry. These reduce costs and enhance the positive nexus between ESG-firm performance. |
| Wasiuzzaman et al. (2023) | 2009 – 2016 | 668 firms from the energy sector worldwide | ESG and Firm Performance | The results show that ESGD has a significant negative impact on energy profitability, while the cultural dimension moderates the relationship. |
| Veeravel et al. (2023) | 2010–2020 | NSE 500 Index of India | ESG and Firm Performance | Findings show that ESG disclosures positively influence firm performance, with a better influence on Tobin's Q at a higher quantile. |
| Shobhwani and Lodha (2023) | 2021 – 2022 | NIFTY 100 of India | ESG risk score and firm performance. | ESG risk score and its components do not show any significant impact on market performance. |
| Chen et al. (2023) | 2011 – 2020 | 3332 listed companies on major stock markets worldwide | ESG and Corporate Financial Performance | The impact of ESG ratings on business performance is strong for large-scale companies but negligible for small-scale companies. |
| Boulhaga et al. (2022) | 2012 – 2018 | French listed firms | Internal control Weakness (ICW), ESG and Firm Performance | The results found that both ICW and ESG ratings have a positive and significant influence on a firm's performance. |
| Wu and Chang (2022) | 2005 – 2020 | Taiwan | ESG and Firm Value | Non-linear relationship between ESG and firm value, E and S pillars have a Concave-Convex relationship |
 DownLoad:
CSV
DownLoad:
CSV
We set to explore and pinpoint the particular ESG activities that drive a company's external and internal performance while ascertaining the type of relationship—whether linear or non-linear—between corporate efficiency and ESG performance. An additional purpose of this work is to examine how ESG performance channels into external financial performance through internal performance or corporate efficiency.
Figure 1 illustrates the analytical research framework used in this study to achieve these research objectives. The first stage involves estimating corporate efficiency through an output-oriented DEA model with Variable Returns to Scale (VRS). This model incorporates inputs such as total assets, the number of employees, and COGS, representing various organizational resources, while the output is represented by total revenue. In the second stage, we examine the linear and non-linear relationship between ESG performance and various indicators of firm performance by applying a range of regression models. Further, we explore which kinds of ESG activities have a positive impact on corporate efficiency, financial performance (PAT and ROA), and market value (market capitalization). Finally, the mediating role of internal corporate efficiency in the relationship between firm-level ESG integration and external financial performance is performed using the path analysis of Baron and Kenny (1986).
We use firm performance as the dependent variable. To represent the internal firm performance, we have used corporate efficiency scores produced by the DEA model by following Xie et al. (2019). To represent external firm performance, we have used traditional measures like ROA, net profit, and market capitalization following the studies of Aydoğmuş et al. (2022) and Șerban et al. (2022). Market performance is represented by the market capitalization. This study uses the overall ESG score, individual ESG pillar scores, and their various respective ESG activities as the major independent variables for various regressions. The framework and list of components that constitute ESG scores, used by Refinitiv for the computation of ESG scores, are depicted in Figure 2 below. These scores are retrieved from Refinitiv which calculates these ESG scores by covering 10 main themes including emissions, environmental product innovation, human rights, shareholders, CSR, management, and so on. This study has taken the natural log of total debts to control for the leverage for financial risk. Further, the natural log of research and development (R & D) expenditure and the log of free cash flows are used to control their effects. A detailed description of the data and variables used is presented in Table 2.

| Variables | Codes | Nature | Description | Sources |
| Variables for DEA | ||||
| Total Assets | TA | Input Variable | Total assets of the sample companies | Refinitiv |
| Employees | EMP | Input Variable | Total no of full-time employees of the sample companies | Refinitiv |
| Cost of Goods Sold | COGS | Input Variable | Total cost of goods sold by the sample companies | Refinitiv |
| Revenue | REV | Output Variable | Total revenue earned by the companies during the year | Refinitiv |
| Variables for Regression Analysis | ||||
| Corporate Efficiency | CE | Mediating and Dependent Variable | Efficiency scores of companies generated by the DEA model | Authors' calculation |
| Profit After Tax | PAT | Dependent Variable | Profit of firms after deducting taxes | Refinitiv |
| Return on Assets | ROA | Dependent Variable | Net income divided by total assets of the firm | Refinitiv |
| Market Capitalisation | Marketcap | Dependent Variable | The market value of the firm (market price*no of shares) | Refinitiv |
| Overall ESG Score | ESG | Independent Variable | Overall ESG scores of sample companies | Refinitiv |
| Environmental Score | E Score | Independent Variable | Environmental pillar scores of sample companies | Refinitiv |
| Social Score | S Score | Independent Variable | Social pillar scores of sample companies | Refinitiv |
| Governance Score | G Score | Independent Variable | Governance pillar scores of sample companies | Refinitiv |
| Free Cashflows | Cash | Control Variable | Net free cash held by the firm | Refinitiv |
| Debt | Debt | Control variable | Total long-term debt use in the capital structure | Refinitiv |
| Research and Development Expenditure | R & D | Control variable | R & D expenditure by the corporation | Refinitiv |
DownLoad:
CSV
We use the Refinitiv ESG scores as the basis for analysis, sourcing both ESG and corporate financial data from the Thomson Reuters database for the financial year 2022. To maintain the integrity of the study, specific measures are taken during data collection. First, banking firms within the financial sector are excluded due to their distinct capital structures. Further, given the nature and assumptions of the DEA model, which necessitates non-negative inputs and outputs, we also removed negative values from both input and output variables to ensure robust analysis. To further enhance data quality and to make the data balanced, we excluded observations with missing values, resulting in a final dataset comprising 909 companies from 29 different countries. These countries predominantly represented developed and top-developing regions, with a primary focus on Asia, Europe, and North America.
In the first stage, an output-oriented VRS DEA model is used to evaluate the relative corporate efficiency. DEA, a popular non-parametric technique, is extensively used by academicians for efficiency analysis of Decision-Making Units (DMUs) (Habib & Mourad, 2023b; Chung et al., 2023; Lu et al. 2022; Xie et al. 2019). The DEA method offers several advantages, such as the ability to take into account multiple inputs and outputs at a time and the assumption of no functional relationship between the input and output variables (Habib, 2024; Habib et al., 2024). For this study, the inputs used in the DEA analysis are total assets as a proxy for physical resources, the number of employees as a proxy for human resources, and the cost of goods sold (COGS) as a proxy for monetary resources. The output is defined as total revenue. In this output-oriented DEA model, we try to maximize the level of revenue (output) by fixing and maintaining the level of inputs. DEA analysis allows for the comparison of companies' efficiency levels by assessing how well DMUs utilize their input resources to generate revenue. The efficiency of DMU i is calculated as the ratio of the weighted sum of output to its weighted sum of inputs.
An output-oriented VRS DEA model with input variables ($ {X}_{1}, {X}_{2}, \dots \dots, {X}_{m} $) and output variable ($ {Y}_{1}, {Y}_{2}, \dots \dots, {Y}_{s} $) for n DMUs (j = 1, 2, … …, n) can be represented in equation 1 as follows:
| ${\rm{Maximise}}~~\theta $ | (1) |
Subject to
| $ \sum _{j = 1}^{n}{\mathrm{\lambda }}_{j}{X}_{ij}\le {X}_{ij} ; i = \mathrm{1, 2}, \dots, m $ |
| $ \sum _{j = 1}^{n}{\mathrm{\lambda }}_{j}{Y}_{rj}\ge {\theta Y}_{ij} ; r = \mathrm{1, 2}, \dots, s $ |
| $ \sum _{j = 1}^{n}{\mathrm{\lambda }}_{j} = 1 $ |
| $ {\mathrm{\lambda }}_{j}\ge 0 ; j = \mathrm{1, 2}, \dots, n $ |
These constraints ensure that the efficiency score for each DMU is less than or equal to 1, indicating that the DMU is operating efficiently or improving its efficiency by maximizing its outputs while maintaining the same level of inputs. The non-negativity constraints ensure that the weights assigned to inputs and outputs are non-negative. The optimization problem in the output-oriented VRS DEA model is to find the optimal values of $ {\mathrm{\lambda }}_{j} $ that maximize the efficiency score for each DMU while satisfying these constraints. The efficiency score will be between 0 and 1, where 1 indicates a fully efficient DMU, while efficiency scores less than 1 indicate inefficiency.
We use the corporate efficiency scores as the indicator for internal performance. Moreover, to assess external financial performance, three primary indicators are used: ROA, market capitalization, and net profit. ROA measures a company's profitability with its total assets, offering insights into its operational efficiency. Market capitalization shows the market performance in terms of market value and PAT shows the net profit of the firm. Since market capitalization and profits are expressed in absolute terms, we normalized them by applying a logarithmic transformation to these variables. Further, this study considers the scores assigned to different activities within the individual environmental, social, and governance pillars as independent variables to analyze how each pillar affects corporate efficiency and financial performance.
OLS focuses solely on the mean of the dependent variable, while efficiency scores, ROA, market capitalization, and PAT span across all quantiles. Moreover, OLS may not robustly capture the impact when the dependent variables have substantial variance. To address this limitation associated with OLS, this study opts for Quantile Regression (QR), which offers a more suitable approach for assessing the impact across the lower, median, and upper quantiles. Consequently, in addition to OLS, we have also employed QR to investigate the relationship between corporate efficiency and financial performance by controlling the impact of companies' free cash flows, leverage, and R & D expenditure (control variables).
Model-based on OLS is shown in Equation 2 below:
| $ E\left({y}_{i}\right) = {\beta }_{0}+{\beta }_{1}{x}_{1}+{\beta }_{2}{x}_{2}+\dots +{\beta }_{n}{x}_{n}+\varepsilon , i = \mathrm{1, 2}, \dots, m $ | (2) |
And the $ {\beta }_{j} $ s are estimated by minimizing the least squares problem
| $ \underset{{\beta }_{0}, \dots, {\beta }_{n}}{\mathrm{m}\mathrm{i}\mathrm{n}}\sum _{i = 1}^{n}{\left({y}_{i}-{\beta }_{0}-\sum _{j = 1}^{p}{x}_{i}{\beta }_{j}\right)}^{2} $ |
Model-based on QR is shown in Equation 3 below:
| $ {Q}_{\tau }\left({y}_{i}\right) = {\beta }_{0}\left(\tau \right)+{\beta }_{1}\left(\tau \right){x}_{1}+{\beta }_{2}\left(\tau \right){x}_{2}+\dots +{\beta }_{n}\left(\tau \right){x}_{n}+\varepsilon , i = \mathrm{1, 2}, \dots, m $ | (3) |
And the $ {\beta }_{j}\left(\tau \right) $ s are calculated using the following minimization problem
| $ \underset{{\beta }_{0}\left(\tau \right), \dots, {\beta }_{n}\left(\tau \right)}{\mathrm{m}\mathrm{i}\mathrm{n}}\sum _{i = 1}^{n}{\rho }_{\tau }({y}_{i}-{\beta }_{0}(\tau)-\sum _{j = 1}^{p}{x}_{i}{\beta }_{j}\left(\tau \right)) $ |
After calculating the efficiency score using the DEA model, we conducted various regressions to explore the association between corporate efficiency and ESG performance. To capture potential non-linear relationships and identify the turning points in the relationship, we employ the non-parametric regression method. Specifically, Kernel regression is utilized to estimate the conditional expectation of the response variable concerning the predictor variables. The Kernel function assigned weights to neighbouring data points based on their proximity to the point of interest, and the response variable's value was estimated as a weighted average of these nearby data points. To further enhance the smoothness of the results, the Epanechnikov kernel function estimator is added. The equation for non-parametric regression is shown in equation 4 below:
| $ E\left(y\right) = \frac{{\sum }_{i = 1}^{n}\left(\frac{x-{x}_{i}}{h}\right).{y}_{i}}{K\left(\frac{x-{x}_{i}}{h}\right)} $ | (4) |
where, $ K\left(\frac{x-{x}_{i}}{h}\right) $ is the kernel weight assigned to each data point, which depends on their distance from $ x $ and the bandwidth $ h $.
After identifying the potential breakpoints using Kernel's non-parametric regression it became easy for us to apply the piecewise regression in that breakpoint. The potential breakpoints are used to divide the scores into low, lower-middle, upper-middle, and high levels of disclosure. Then, piecewise regression is applied to get the result of slope coefficients. The Piecewise equation is shown in Equation 5 below:
| $ E\left(Y\right) = {\beta }_{0}+{\beta }_{1}X+{\sum }_{i = 1}^{k-1}{\beta }_{i+1}\left(X-{\Delta }_{i}\right)I(X-{\Delta }_{i})+\varepsilon $ | (5) |
where:
$ {\beta }_{0} = $ Y-intercept
$ {\beta }_{i} = $ Slope of segment i, i = 1, 2, 3, …, k
$ {\Delta }_{i} = $ Location of slope changes between segment i and segment i+1, i = 1, 2, …, k-1
$ I(X-{\Delta }_{i}) = $ 1, if $ X\ge {\Delta }_{i} $ and 0 otherwise
To test the mediating role of corporate efficiency between ESG performance and firms' financial performance, we use the path analysis provided by Baron and Kenny (1986). Baron and Kenny (1986) provided four conditions that are required to be satisfied to declare a variable as a mediator. These conditions require a significant relationship between (1) the independent and dependent variable in equation 6, (2) the independent and mediating variable in equation 7, (3) the mediating and dependent variable after controlling for the independent variable in equation 8, and (4) the direct effect of the independent variable on the independent variable should be smaller than the overall effect.
| $ Y = {\beta }_{10}+{\beta }_{11}X+{\varepsilon }_{1} $ | (6) |
| $ Me = {\beta }_{20}+{\beta }_{21}X+{\varepsilon }_{2} $ | (7) |
| $ Y = {\beta }_{30}+{\beta }_{31}X+{\beta }_{32}Me+{\varepsilon }_{3} $ | (8) |
Finally, for the robustness of the results, this study applies the KRLS estimator. The KRLS model, developed by Hainmueller and Hazlett (2014), is a machine learning method especially for regression and inference without making any assumptions about linearity or additivity. KRLS determines the most suitable function by minimizing the squared loss of a Tikhonov regularization problem, using Gaussian kernels as radial basis functions. KRLS offers the advantage of interpreting data in a manner consistent with classic GLM regression models. This approach is appropriate for models that have a mix of different types and non-linear relationships. Furthermore, the introduction of a penalty term KRLS aids in improving the fitted model and prevents over-fitting. The KRLS estimator exhibits desirable statistical properties, including unbiasedness, consistency, and asymptotic normality, given certain regularity conditions.
Table 3 below presents the descriptive statistics of all the variables employed in this study. The average ESG score reflects an average value of 58, with a standard deviation of 19.82. The mean individual scores of E, S, and G mean scores are 53.57, 58.23, and 60.79, respectively. These statistics show that corporate entities display relatively better performance in the domain of governance aspect, as observed from the highest mean score. Subsequently, the social score displays a slightly lower mean value, followed by the environmental score.
| Variables | Obs | Mean | Std. dev. | Min | Median | Max |
| ESG Score | 909 | 58.00 | 19.82 | 3.29 | 60.50 | 95.76 |
| E Score | 909 | 53.57 | 25.70 | 0.00 | 58.34 | 98.27 |
| S Score | 909 | 58.23 | 24.14 | 1.46 | 60.88 | 97.48 |
| G Score | 909 | 60.79 | 21.01 | 3.38 | 63.96 | 98.05 |
| Revenue (Million USD) | 909 | 14118.14 | 40120.05 | 61.43 | 3396.90 | 603240.10 |
| Assets (million USD) | 909 | 21791.80 | 53963.27 | 63.21 | 5180.25 | 663541.10 |
| No. of Employees | 909 | 30560.62 | 59224.64 | 58.00 | 11273 | 675805.00 |
| COGS (million USD) | 909 | 8865.78 | 26423.74 | 0.00 | 1848.00 | 395613.40 |
| PAT (million USD) | 909 | 1857.09 | 7769.53 | 1.29 | 343.00 | 160767.90 |
| Market Capitalization (million USD) | 909 | 38062.68 | 166583.90 | 138.16 | 7112.32 | 2749123.00 |
| Free Cash Flows (million USD) | 909 | 1788.09 | 7575.10 | 2.18 | 266.00 | 148531.00 |
| Debt (million USD) | 909 | 5358.93 | 14178.50 | 0.00 | 953.70 | 217928.10 |
| R & D Expense (million USD) | 909 | 7539.73 | 25118.09 | 0.00 | 1010.00 | 395000.00 |
DownLoad:
CSV
Then, the distribution of relative efficiency scores generated by the DEA model across different sectors is presented in Figure 3. The efficiency scores range from 0 to 1, where 0 indicates inefficient and 1 signifies fully efficient firm. The histogram in Figure 3 and Box and Whisker Plot in Figure 4 reveals that in all the sectors, a significant proportion of companies tend to cluster around the middle-efficiency scores, i.e., between 0.4–0.6. Among the sectors, such as consumer discretionary and materials, the distribution displays a long tail towards the left, indicating a noticeable skewness to the left. This means the majority of the companies in these sectors operate with a low level of efficiency and very few operate at a high level of efficiency. Sectors such as consumer staples, information technology, and industrials exhibit a distribution that approximates a normal distribution with minimal skewness. However, the communication services and healthcare display a right-skewed distribution, suggesting a fewer no of companies within this sector operate at a low-efficiency level and more companies operate at a high-efficiency level.


After obtaining the corporate efficiency scores, this research examines the initial correlation between corporate efficiency and ESG performance using a matrix plot, as shown in Figure 5. The diagonal elements of this graph illustrate the Box and Whisker plot of the efficiency score, the scores for overall ESG, and the scores for each ESG pillar. The preliminary investigation from Figure 5 revealed a nonlinear relationship between efficiency and overall ESG scores, as well as between efficiency and individual E, S, and G scores. However, there is a positive upward relationship between the overall ESG score and the individual E, S, and G scores.

To further examine the non-linear relationship in depth, we will employ a non-parametric regression technique known as Kernel Regression and piecewise regression, which will be discussed later in the next section. These approaches will help us to identify the potential turning points in the relationship of our analysis.
In addressing the first research question, which investigates whether a commitment to address ESG issues leads to improved corporate efficiency, financial performance, and market value, we employ both OLS and QR techniques. While OLS allows us to assess the impact of overall ESG performance on the average firm performance, QR enables us to examine this impact across various quantiles, including the lower (25th quantile), median (50th quantile), and upper (75th quantile).
Detailed results of both OLS and QR analyses are presented in Table 4. From Table 4, it can be seen that the coefficients of overall ESG are positive and statistically significant for corporate efficiency, net profit, and market capitalization of the firm. This positive impact may be driven by a variety of complex interactions of risk mitigation, cost savings, reputation enhancement, access to capital, innovation, regulatory compliance, long-term orientation, and increased customer loyalty (Mumtaz & Yoshino, 2023).
| Variables | Corporate Efficiency | ROA | LnProfit | LnMarketcap | ||||||||||||
| OLS | QR | OLS | QR | OLS | QR | OLS | QR | |||||||||
| Q25 | Q50 | Q75 | Q25 | Q50 | Q75 | Q25 | Q50 | Q75 | Q25 | Q50 | Q75 | |||||
| ESG | 0.00221*** | 0.00258*** | 0.00213*** | 0.00216*** | 0.00006 | 0.00030** | 0.00020 | 0.00003 | 0.00643*** | 0.00831*** | 0.00395** | 0.00482*** | 0.00587*** | 0.00614** | 0.00628** | 0.00773*** |
| (0.00031) | (0.00050) | (0.00036) | (0.00039) | (0.00016) | (0.00012) | (0.00012) | (0.00014) | (0.00179) | (0.00183) | (0.00217) | (0.00135) | (0.00167) | (0.00299) | (0.00248) | (0.00262) | |
| LnCash | 0.0240*** | 0.0150** | 0.0220*** | 0.0272*** | 0.0192*** | 0.0107*** | 0.0166*** | 0.0213*** | 0.604*** | 0.728*** | 0.669*** | 0.578*** | 0.514*** | 0.520*** | 0.512*** | 0.498*** |
| (0.00384) | (0.00561) | (0.00581) | (0.00463) | (0.00195) | (0.00121) | (0.00181) | (0.00201) | (0.0217) | (0.0484) | (0.0432) | (0.0371) | (0.0203) | (0.0419) | (0.0327) | (0.0487) | |
| LnDebt | −0.0094*** | −0.00833** | −0.0066*** | −0.0122*** | −0.0149*** | −0.0110*** | −0.0144*** | −0.0189*** | 0.113*** | 0.0517** | 0.0832*** | 0.118*** | 0.0336** | 0.00392 | 0.0225 | 0.0288 |
| (0.00265) | (0.00266) | (0.00317) | (0.00560) | (0.00135) | (0.00118) | (0.00190) | (0.00162) | (0.0149) | (0.0179) | (0.0142) | (0.0169) | (0.0140) | (0.0332) | (0.0152) | (0.0214) | |
| LnR & D | 0.00106 | 0.00446 | 0.00238 | −0.00083 | 0.00032 | 0.00106 | 0.00054 | 0.00129 | 0.0544*** | 0.0464** | 0.0545** | 0.0581*** | 0.129*** | 0.157*** | 0.144*** | 0.119*** |
| (0.00247) | (0.00400) | (0.00542) | (0.00421) | (0.00126) | (0.000608) | (0.00110) | (0.00166) | (0.0139) | (0.0297) | (0.0191) | (0.0149) | (0.0130) | (0.0245) | (0.0258) | (0.0213) | |
| Constant | 0.408*** | 0.292*** | 0.391*** | 0.532*** | 0.0851*** | 0.0450*** | 0.0735*** | 0.121*** | 1.030*** | 0.245* | 1.078*** | 1.710*** | 4.707*** | 4.098*** | 4.688*** | 5.361*** |
| (0.0204) | (0.0254) | (0.0272) | (0.0355) | (0.0104) | (0.00588) | (0.00890) | (0.0126) | (0.115) | (0.141) | (0.172) | (0.158) | (0.108) | (0.190) | (0.110) | (0.137) | |
| Note: Standard errors in parentheses, * p < 0.10, ** p < 0.05, *** p < 0.01 | ||||||||||||||||
DownLoad:
CSV
Initially, ESG practices assist businesses in identifying and managing risks (Aevoae et al., 2022; Cagli et al., 2022). Second, ESG initiatives frequently result in cost reductions, as energy-efficient processes and sustainable resource management reduce operational costs (Aroul et al., 2022). In addition, ESG-focused companies cultivate a positive reputation among stakeholders, thereby attracting more customers, investors, and partners, boosting revenues and market value (Lee et al., 2022).
Access to a broader investor base, including ethically motivated investors, can reduce financing costs and increase capital access, like green bonds (Cheng et al., 2023). ESG also encourages innovation and reveals new market opportunities, especially for sustainable technologies and products (Long et al., 2023). This way ESG has a significant positive impact on efficiency, profit, and market valuation. This supports our Hypothesis 1. These results are in line and consistent with the findings of previous studies (Xie et al., 2019; Malik & Kashiramka, 2024; Maji & Lohia, 2023). However, these results are not conclusive with the findings of Masongweni & Simo-Kengne (2024) and Abdulla & Jawad (2024).
Overall ESG score has a significant impact on corporate efficiency, RoA, profit, and market value of corporations.
Table 5 provides regression outcomes for the three distinct pillars: the environmental pillar, the social pillar, and the governance pillar. A careful examination of Table 5 reveals that the environmental pillar exhibits a significant positive impact on both firm efficiency and profitability. Interestingly, the degree of impact of environmental scores is high in lower quantiles and low in higher quantiles. This suggests that environmental scores may have diminishing returns or may not have an impact on firm performance, with higher scores than lower scores. In contrast, the social pillar demonstrates a positive influence on firm efficiency and market value. The governance pillar, on the other hand, positively affects firms' efficiency, profitability, and ROA, but it does not exhibit any noticeable impact on market value. These findings effectively address our second research question and lead us to accept hypotheses 2, hypothesis 3, and hypothesis 4. These results are in line and consistent with the findings of previous studies (Habib & Mourad, 2023; Shaikh, 2022). However, these results are not conclusive with the findings of Narula et al., (2024) and Handoyo & Anas (2024).
| Variables | Corporate Efficiency | ROA | LnMarketCap | LnProfit | ||||||||||||
| OLS | QR | OLS | QR | OLS | QR | OLS | QR | |||||||||
| Q25 | Q50 | Q75 | Q25 | Q50 | Q75 | Q25 | Q50 | Q75 | Q25 | Q50 | Q75 | |||||
| E Score | 0.00073** | 0.00153*** | 0.00106** | 0.00055 | −0.00039** | −0.00012* | −0.00003 | −0.00018 | 0.00303* | 0.00103 | 0.00168 | 0.00357 | 0.00830*** | 0.00909*** | 0.00755*** | 0.00683*** |
| (0.00031) | (0.00043) | (0.00048) | (0.00053) | (0.00015) | (0.00007) | (0.00013) | (0.00015) | (0.00162) | (0.00231) | (0.00241) | (0.00259) | (0.00172) | (0.00261) | (0.00166) | (0.00232) | |
| S Score | 0.00095*** | 0.00049 | 0.00067** | 0.00113** | 0.00026 | 0.00036** | 0.00016 | 0.00025 | 0.00345** | 0.00523** | 0.00506* | 0.00467** | −0.00392** | −0.00238 | −0.00430*** | −0.00326 |
| (0.00032) | (0.00044) | (0.00032) | (0.00054) | (0.00016) | (0.00015) | (0.00011) | (0.00019) | (0.00169) | (0.00231) | (0.00261) | (0.00231) | (0.00179) | (0.00375) | (0.00141) | (0.00256) | |
| G Score | 0.00055* | 0.00049 | 0.00054 | 0.00047 | 0.00025* | 0.00003 | 0.00009 | 0.00001 | −0.00127 | −0.00220 | −0.00031 | −0.00182 | 0.00335** | 0.00201* | 0.00209 | 0.00207 |
| (0.00028) | (0.00048) | (0.00033) | (0.00042) | (0.00014) | (0.00011) | (0.00011) | (0.00018) | (0.00151) | (0.00201) | (0.00221) | (0.00189) | (0.00160) | (0.00116) | (0.00127) | (0.00204) | |
| LnCash | 0.0238*** | 0.0155** | 0.0202*** | 0.0270*** | 0.0194*** | 0.0112*** | 0.0161*** | 0.0213*** | 0.513*** | 0.506*** | 0.512*** | 0.487*** | 0.600*** | 0.712*** | 0.667*** | 0.600*** |
| (0.00384) | (0.00634) | (0.00466) | (0.00456) | (0.00195) | (0.00141) | (0.00209) | (0.00249) | (0.0202) | (0.0428) | (0.0348) | (0.0360) | (0.0215) | (0.0403) | (0.0314) | (0.0267) | |
| LnDebt | −0.00982*** | −0.0100** | −0.00696* | −0.0134*** | −0.0143*** | −0.0107*** | −0.0139*** | −0.0188*** | 0.0302** | 0.0220 | 0.0156 | 0.0314* | 0.102*** | 0.0499** | 0.0747*** | 0.100*** |
| (0.00270) | (0.00401) | (0.00386) | (0.00498) | (0.00137) | (0.00119) | (0.00170) | (0.00220) | (0.0142) | (0.0329) | (0.0193) | (0.0167) | (0.0151) | (0.0247) | (0.0117) | (0.0156) | |
| LnR & D | 0.00107 | 0.00557 | 0.00215 | −0.00064 | 0.00003 | 0.00057 | 0.00026 | 0.00108 | 0.128*** | 0.159*** | 0.147*** | 0.121*** | 0.0601*** | 0.0572*** | 0.0473*** | 0.0571*** |
| (0.00248) | (0.00463) | (0.00365) | (0.00536) | (0.00126) | (0.00063) | (0.00105) | (0.0008) | (0.0131) | (0.0230) | (0.0226) | (0.0206) | (0.0139) | (0.0190) | (0.0140) | (0.0120) | |
| Constant | 0.413*** | 0.302*** | 0.399*** | 0.539*** | 0.0760*** | 0.0458*** | 0.0720*** | 0.116*** | 4.794*** | 4.192*** | 4.709*** | 5.486*** | 1.038*** | 0.299* | 1.128*** | 1.674*** |
| (0.0217) | (0.0273) | (0.0220) | (0.0476) | (0.0110) | (0.00933) | (0.0117) | (0.0149) | (0.114) | (0.201) | (0.186) | (0.194) | (0.121) | (0.174) | (0.137) | (0.124) | |
| Note: Standard errors in parentheses, * p < 0.10, ** p < 0.05, *** p < 0.01 | ||||||||||||||||
DownLoad:
CSV
Overall ESG score has a significant impact on corporate efficiency, RoA, profit, and market value of corporations.
Tables 6–8 below show the impact of different environmental activities on firm performance. In Table 6, OLS regression shows that environmental innovation, which comprises sub-activities like product innovation, R & D, and capital expenditure, does not have any significant impact on corporate efficiency. However, QR revealed a significant positive impact on corporate efficiency at the 25th quantile. Furthermore, the result of both OLS and QR shows a significant positive impact of environmental innovation on the profit of the company. However, the magnitude of the impact is decreasing in higher quantiles. This indicates that focusing on environmental innovation is creating better profits for companies with lower quantiles.
| Variables | Corporate Efficiency | ROA | LnMarketCap | LnProfit | ||||||||||||||||
| OLS | QR | OLS | QR | OLS | QR | OLS | QR | |||||||||||||
| Q25 | Q50 | Q75 | Q25 | Q50 | Q75 | Q25 | Q50 | Q75 | Q25 | Q50 | Q75 | |||||||||
| Environmental Innovation | 0.00016 | 0.00060** | 0.00028 | −0.00006 | −0.00005 | 0.00007 | 0.00001 | −0.00013 | 0.00065 | 0.00085 | 0.00084 | 0.00088 | 0.00391*** | 0.00428*** | 0.00317*** | 0.00215*** | ||||
| (0.00018) | (0.00028) | (0.00023) | (0.00033) | (0.00009) | (0.00006) | (0.00004) | (0.00014) | (0.00095) | (0.00133) | (0.00099) | (0.00119) | (0.00101) | (0.00158) | (0.00091) | (0.00072) | |||||
| Resource Use | 0.00078*** | 0.00096** | 0.00099*** | 0.00110* | −0.00011 | 0.0000472 | 0.0000231 | −0.00016 | 0.00122 | 0.00377* | 0.00229 | −0.0016 | −0.00195 | 0.000765 | −0.00179 | −0.0023** | ||||
| (0.00028) | (0.00042) | (0.00035) | (0.00058) | (0.00014) | (0.00013) | (0.00009) | (0.00014) | (0.00147) | (0.00216) | (0.00158) | (0.00146 | (0.00156) | (0.00167) | (0.00168) | (0.00105) | |||||
| Emissions | 0.000539* | 0.00062 | 0.000475 | −0.00001 | 0.000003 | 0.00004 | 0.00005 | 0.00021 | 0.00420*** | 0.000994 | 0.00258 | 0.00737*** | 0.00599*** | 0.0025 | 0.00525*** | 0.00666*** | ||||
| (0.00028) | (0.00039) | (0.0003) | (0.00046) | (0.00014) | (0.00012) | (0.00008) | (0.00015) | (0.00151) | (0.00296) | (0.00207) | (0.00208) | (0.0016) | (0.00264) | (0.002) | (0.0018) | |||||
| LnCash | 0.0245*** | 0.0161** | 0.0209** | 0.0267*** | 0.0197*** | 0.0103*** | 0.0160*** | 0.0210*** | 0.509*** | 0.516*** | 0.498*** | 0.483*** | 0.605*** | 0.730*** | 0.662*** | 0.603*** | ||||
| (0.00388) | (0.00649) | (0.00648) | (0.005) | (0.00196) | (0.0017) | (0.0019) | (0.00199) | (0.0202) | (0.024) | (0.028) | (0.041) | (0.0215) | (0.039) | (0.0369) | (0.0248) | |||||
| LnDebt | −0.00940*** | −0.0093*** | −0.00723 | −0.0108** | −0.0142*** | −0.0107*** | −0.0137*** | −0.0186*** | 0.0265* | 0.00278 | 0.0135 | 0.0314* | 0.0978*** | 0.0456* | 0.0775*** | 0.0953*** | ||||
| (0.00273) | (0.0028) | (0.00485) | (0.00471) | (0.00138) | (0.0011) | (0.00131) | (0.00215) | (0.0142) | (0.0174) | (0.0127) | (0.0169) | (0.0151) | (0.0235) | (0.0148) | (0.0147) | |||||
| LnR & D | 0.0023 | 0.00678 | 0.00162 | 0.00267 | 0.000635 | 0.00139*** | 0.00088 | 0.00184 | 0.131*** | 0.160*** | 0.157*** | 0.144*** | 0.0549*** | 0.0499** | 0.0436** | 0.0560*** | ||||
| (0.00248) | (0.00496) | (0.00544) | (0.00571) | (0.00125) | (0.00054) | (0.00135) | (0.00153) | (0.0129) | (0.0286) | (0.0211) | (0.0236) | (0.0137) | (0.0202) | (0.0184) | (0.0164) | |||||
| Constant | 0.439*** | 0.308*** | 0.431*** | 0.560*** | 0.0875*** | 0.0531*** | 0.0761*** | 0.119*** | 4.754*** | 4.157*** | 4.775*** | 5.319*** | 1.111*** | 0.416*** | 1.116*** | 1.655*** | ||||
| (0.0196) | (0.0335) | (0.0258) | (0.0454) | (0.00994) | (0.00742) | (0.00725) | (0.00991) | (0.103) | (0.164) | (0.163) | (0.11) | (0.109) | (0.138) | (0.133) | (0.126) | |||||
| Note: Standard errors in parentheses, * p < 0.10, ** p < 0.05, *** p < 0.01. | ||||||||||||||||||||
DownLoad:
CSV
| Variables | Corporate Efficiency | ROA | LnMarketCap | LnProfit | |||||||||||||
| OLS | QR | OLS | QR | OLS | QR | OLS | QR | ||||||||||
| Q25 | Q50 | Q75 | Q25 | Q50 | Q75 | Q25 | Q50 | Q75 | Q25 | Q50 | Q75 | ||||||
| Community | 0.00006 | -0.00025 | -0.00020 | 0.00033 | 0.00006 | 0.00023*** | 0.00009 | 0.00034** | 0.00412*** | 0.00396 | 0.00381 | 0.00432** | -0.00066 | -0.00067 | -0.00085 | 0.00026 | |
| (0.00026) | (0.00048) | (0.00029) | (0.00036) | (0.00013) | (0.000074) | (0.00009) | (0.00011) | (0.00137) | (0.0016) | (0.0018) | (0.0021) | (0.00148) | (0.00232) | (0.00114) | (0.0021) | ||
| Product Responsibility | 0.00054** | 0.00047* | 0.00064*** | 0.00079** | 0.00001 | −0.00008 | −0.00004 | −0.00005 | −0.00148 | −0.00019 | −0.00129 | −0.00039 | 0.00048 | 0.00233 | −0.00076 | −0.00019 | |
| (0.00022) | (0.00047) | (0.00035) | (0.00043) | (0.00011) | (0.00008) | (0.00008) | (0.00015) | (0.00118) | (0.00191) | (0.00132) | (0.00204) | (0.00127) | (0.00165) | (0.00164) | (0.0012) | ||
| Human Rights | 0.00051** | 0.00095*** | 0.00074*** | 0.00003 | 0.00014 | 0.00011 | 0.00014 | 0.00004 | −0.00025 | −0.00053 | 0.00086 | −0.00093 | −0.00013 | 0.00017 | 0.00065 | −0.00005 | |
| (0.00022) | (0.00034) | (0.00021) | (0.00035) | (0.00011) | (0.00009) | (0.00009) | (0.00014) | (0.00118) | (0.00154) | (0.00115) | (0.00107) | (0.00128) | (0.00134) | (0.00121) | (0.0017) | ||
| Workforce | 0.00064** | 0.00055 | 0.00045 | 0.00075** | −0.00013 | −0.00001 | −0.00004 | −0.00012 | 0.00311** | 0.00130 | 0.00211 | 0.00379 | 0.00386** | 0.00420* | 0.00253** | 0.00323 | |
| (0.00028) | (0.00035) | (0.00031) | (0.00034) | (0.00014) | (0.00007) | (0.00011) | (0.00014) | (0.00146) | (0.00238) | (0.00126) | (0.00166) | (0.00158) | (0.00285) | (0.00149) | (0.0016) | ||
| LnCash | 0.0253*** | 0.0207*** | 0.0223*** | 0.0295*** | 0.0194*** | 0.0109*** | 0.0156*** | 0.0204*** | 0.505*** | 0.519*** | 0.496*** | 0.495*** | 0.606*** | 0.715*** | 0.678*** | 0.587*** | |
| (0.00390) | (0.00528) | (0.00468) | (0.00521) | (0.00198) | (0.00165) | (0.00185) | (0.00243) | (0.0204) | (0.0435) | (0.0368) | (0.0350) | (0.0220) | (0.0419) | (0.0318) | (0.0319) | ||
| LnDebt | −0.00878*** | −0.00752** | −0.00539 | −0.0123*** | −0.0151*** | −0.0109*** | −0.0145*** | −0.0194*** | 0.0394*** | 0.0153 | 0.0214 | 0.0392** | 0.120*** | 0.0550* | 0.0881*** | 0.121*** | |
| (0.00265) | (0.00521) | (0.00500) | (0.00553) | (0.00135) | (0.000942) | (0.00166) | (0.00158) | (0.0139) | (0.0269) | (0.0199) | (0.0168) | (0.0150) | (0.0194) | (0.0175) | (0.0166) | ||
| LnR & D | 0.00122 | 0.00443 | 0.00286 | −0.00192 | 0.00001 | 0.00087 | 0.00057 | 0.00141 | 0.126*** | 0.152*** | 0.143*** | 0.117*** | 0.0607*** | 0.0610** | 0.0585** | 0.0570*** | |
| (0.00250) | (0.00448) | (0.00536) | (0.00441) | (0.00127) | (0.00110) | (0.00101) | (0.00110) | (0.0131) | (0.0266) | (0.0184) | (0.0213) | (0.0141) | (0.0257) | (0.0187) | (0.0177) | ||
| Constant | 0.421*** | 0.314*** | 0.408*** | 0.535*** | 0.0891*** | 0.0507*** | 0.0828*** | 0.117*** | 4.729*** | 4.143*** | 4.824*** | 5.316*** | 1.052*** | 0.295 | 1.081*** | 1.702*** | |
| (0.0211) | (0.0269) | (0.0352) | (0.0444) | (0.0107) | (0.00809) | (0.0110) | (0.0123) | (0.110) | (0.166) | (0.148) | (0.131) | (0.119) | (0.204) | (0.167) | (0.147) | ||
| Note: Standard errors in parentheses, * p < 0.10, ** p < 0.05, *** p < 0.01 | |||||||||||||||||
DownLoad:
CSV
| Variables | Corporate Efficiency | ROA | LnMarketCap | LnProfit | |||||||||||||||||
| OLS | QR | OLS | QR | OLS | QR | OLS | QR | ||||||||||||||
| Q25 | Q50 | Q75 | Q25 | Q50 | Q75 | Q25 | Q50 | Q75 | Q25 | Q50 | Q75 | ||||||||||
| Management | 0.00047** | 0.00065* | 0.00031 | 0.00050* | 0.00013 | 0.00005 | −0.00001 | −0.00003 | −0.00100 | −0.00029 | −0.00046 | −0.00098 | 0.00209* | 0.00115 | 0.00085 | 0.00124 | |||||
| (0.00021) | (0.00039) | (0.00027) | (0.00028) | (0.00010) | (0.00008) | (0.00007) | (0.00014) | (0.00112) | (0.00134) | (0.00184) | (0.00139) | (0.00120) | (0.00204) | (0.00101) | (0.00151) | ||||||
| CSR | 0.00092*** | 0.00089*** | 0.00098*** | 0.00102*** | −0.00008 | 0.00010 | 0.00016** | −0.000013 | 0.00553*** | 0.00587*** | −0.00472*** | 0.00568*** | 0.00504*** | 0.00536*** | 0.00453*** | 0.00474*** | |||||
| (0.00021) | (0.00044) | (0.00026) | (0.00027) | (0.00010) | (0.00009) | (0.00007) | (0.00008) | (0.00110) | (0.00141) | (0.0016888) | (0.00167) | (0.00118) | (0.00160) | (0.00135) | (0.00150) | ||||||
| Shareholder | 0.00022 | 0.00032 | 0.00029 | 0.00007 | 0.00014 | 0.00005 | 0.00008 | 0.00026*** | −0.00031 | −0.00075 | −0.00117 | −0.00024 | −0.00007 | −0.00077 | −0.00057 | −0.00166 | |||||
| (0.00021) | (0.00033) | (0.00026) | (0.00027) | (0.00011) | (0.00007) | (0.00006) | (0.00010) | (0.00111) | (0.00160) | (0.00077) | (0.00188) | (0.00119) | (0.00139) | (0.00102) | (0.000965 | ||||||
| LnCash | 0.0245*** | 0.0216*** | 0.0213*** | 0.0259*** | 0.0196*** | 0.0105*** | 0.0165*** | 0.0216*** | 0.507*** | 0.511*** | 0.49749*** | 0.509*** | 0.594*** | 0.744*** | 0.656*** | 0.579*** | |||||
| (0.00394) | (0.00705) | (0.00446) | (0.00403) | (0.00198) | (0.00197) | (0.00220) | (0.00269) | (0.0204) | (0.0548) | (0.03397) | (0.0365) | (0.0219) | (0.0513) | (0.0328) | (0.0217) | ||||||
| LnDebt | −0.00833*** | −0.00651 | −0.00539* | −0.0142*** | −0.0148*** | −0.0109*** | −0.0150*** | −0.0183*** | 0.0287** | 0.000712 | 0.01545 | 0.0338 | 0.107*** | 0.0386 | 0.0777*** | 0.106*** | |||||
| (0.00268) | (0.00388) | (0.00297) | (0.00445) | (0.00135) | (0.00158) | (0.00218) | (0.00217) | (0.0139) | (0.0295) | (0.02257) | (0.0227) | (0.0149) | (0.0318) | (0.0157) | (0.0147) | ||||||
| LnR & D | 0.00267 | 0.00421 | 0.00380 | 0.00349 | 0.000213 | 0.00157* | 0.00077 | 0.00118 | 0.133*** | 0.149*** | 0.16215*** | 0.129*** | 0.0574*** | 0.0519** | 0.0489*** | 0.0589*** | |||||
| (0.00247) | (0.00352) | (0.00430) | (0.00592) | (0.00124) | (0.00104) | (0.00120) | (0.00107) | (0.0128) | (0.0190) | (0.01772) | (0.0211) | (0.0137) | (0.0211) | (0.0101) | (0.0110) | ||||||
| Constant | 0.419*** | 0.283*** | 0.410*** | 0.549*** | 0.0747*** | 0.0479*** | 0.0738*** | 0.104*** | 4.843*** | 4.282*** | 4.86925*** | 5.383*** | 1.047*** | 0.328** | 1.149*** | 1.777*** | |||||
| Note: Standard errors in parentheses, * p < 0.10, ** p < 0.05, *** p < 0.01 | |||||||||||||||||||||
DownLoad:
CSV
Investing resources in environmental innovation, R & D, and capital assets has proven to benefit the company's sustainability efforts and significantly enhance corporate efficiency and financial performance. For example, Fernández et al. (2018) identified that combining R & D with sustainable practices leads to the invention of more efficient technologies and processes. This integration results in reduced costs and restructuring of supply chains. Further, Prioritizing efficiency by optimizing energy usage and minimizing wastage reduces operational expenses and improves profitability (Ata et al., 2012).
Likewise, resource use—which includes sub-activities like energy, water consumption, environmentally friendly packaging, and environmental supply chain—shows a notable improvement in corporate efficiency when it comes to OLS and QR. This resource use also has a positive relation with market capitalization at the lower or 25th quantile. However, it has a significant negative impact on PAT at the higher or 75th quantile.
The implementation of environmental resource use, water conservation, and sustainable packaging strategies collectively contribute to enhanced corporate efficiency. According to Gupta (1995), the careful management of environmental resources has been shown to result in improved operational efficiency and waste reduction, ultimately leading to cost reductions. The importance of efficient water utilization extends beyond addressing the risks associated with limited water resources. It also encompasses the reduction of costs associated with water acquisition and treatment (El-Wahed & Ali, 2013).
Likewise, the emission activities, which include emission management, waste management, and environmental management systems, have a positive impact on the efficiency, market capitalization, and profit of the company as per the OLS. Also, it has positive impacts on market capitalization and profit at upper quantiles as per QR except for efficiency. The adoption of a strategic approach towards controlling emissions and managing waste has been found to have two-fold advantages. First, it promotes environmental stewardship by reducing the negative impact on the environment. Second, it enhances financial sustainability and vice versa, as evidenced by a study conducted by Hua (2023). Together all these activities have positive impacts on firm performance and thus we accept our Hypothesis 5.
Overall ESG score has a significant impact on corporate efficiency, RoA, profit, and market value of corporations.
Table 7 below shows the results of various social activities, i.e., community, human rights, product responsibility, and workforce, on corporate efficiency and financial performance of the company. The community score, which evaluates the business's dedication to upholding corporate ethics, safeguarding the public's health, and being a responsible citizen, has a major positive impact on ROA at the 25th and 75th quantiles. Moreover, it also has a positive impact on the market capitalization of the firm.
This is confirmed by the coefficients of the community score which are positive and significant as per the result of OLS and QR. Community involvement influences financial performance positively by fostering a cycle of mutual aid and enhanced reputation. When businesses actively contribute to the well-being of the communities in which they operate, they foster positive relationships, thereby establishing a loyal customer base and stakeholder network (Javed et al., 2020). This can result in increased sales and brand loyalty, as consumers are more likely to support companies that share their values.
In addition, community engagement can facilitate access to local talent and markets, allowing for cost-effective sourcing and distribution. In addition, a positive reputation in the community attracts responsible investors who consider ESG factors. In turn, these investors provide access to capital, reduce financing costs, and improve the company's financial stability (Cheng et al., 2023). This positioning of community engagement with ESG expectations augments this effect, causing companies to be more resilient to risks and market fluctuations.
Corporate efficiency is positively associated with the human rights dimension, which assesses how well a business adheres to basic human rights. However, it does not affect the company's profit, market value, and ROA. Respect for human rights positively affects human efficiency in business by boosting the morale of employees, a sense of belongingness, and talent retention. Businesses that prioritize human rights first in their policies and practices foster a supportive and inclusive atmosphere (Tang et al., 2012). Those businesses are also perceived as more desirable employers, and this ultimately leads to increased talent acquisition and retention (Gatzert, 2015). It is found that employees who feel their rights are respected are expected to remain more loyal to their employers (Darmawan et al., 2020). Respecting human rights also reduces the possibility of conflicts, union strikes, and other legal issues and thus helps in creating an environment that is more stable work environment. In this way, human efficiency is reflected in corporate efficiency.
The product responsibility score is positively related to corporate efficiency only. This product responsibility measures a company's ability to provide good quality products and services, focussing on customer health and safety, integrity, and data privacy. Businesses that prioritize ethical sourcing, ethical production, and safe product practices promote a reputation for dependability and integrity. This increases brand loyalty and customer retention, resulting in increased sales and decreased marketing expenses (Barnet & Ferris, 2016). By emphasizing responsible practices, businesses encourage innovation in product design and manufacturing processes, which can result in cost savings and enhanced production techniques. Ultimately, a commitment to social product responsibility aligns business practices with consumer values, improves market positioning, and drives internal operational efficiencies, thereby contributing to the overall efficiency of the corporation. Together, all these social activities have a positive impact on firm performance, and thus, we accept our Hypothesis 6.
Overall ESG score has a significant impact on corporate efficiency, RoA, profit, and market value of corporations.
On the governance front, the management aspect, which focuses on the structure of the board, independence, diversity, and committees, is positively associated with only corporate efficiency, as shown in Table 8. A diverse board with diverse skills and perspectives contributes to comprehensive problem-solving and sound decision-making. Specialized committees, such as audit and sustainability committees, ensure that specific areas receive focused attention, resulting in improved risk management and adherence to best practices. These management practices foster a culture of accountability and transparency, leading to efficient resource allocation and optimized operations.
In addition, they increase stakeholder confidence, thereby attracting responsible investors who recognize the value of strong governance practices and their potential to create long-term value. Overall, adept management practices establish efficient channels for communication, collaboration, and oversight, which contributes directly to the efficacy of the organization and its long-term prosperity. Coming to the CSR strategy, which mostly focuses on CSR policy and ESG reporting, is positively related to corporate efficiency, market value, and profit of the firm as per OLS. This is also supported by the QR. First, CSR policies guide the ethical behavior and decision-making of a company, thereby reducing risks associated with legal issues or reputational damage that could divert resources from core business activities (Karwowski & Raulinajtys-Grzybek, 2021).
Second, ESG reporting promotes transparency, which increases stakeholder trust and attracts ethically minded investors. These investors provide access to capital on favorable terms, thereby lowering financing expenses and the overall cost of capital (Cheng et al., 2023). Also, a comprehensive CSR strategy can increase operational efficiency by identifying cost-saving opportunities via sustainable practices and resource optimization. In addition, CSR initiatives that align with consumer values can increase brand loyalty, leading to increased sales and accounting profit (Mangalagiri & Bhasa, 2022). However, the shareholder activities do not have any influence on any of the financial performance.
Overall ESG score has a significant impact on corporate efficiency, RoA, profit, and market value of corporations.
Overall, taking all the governance activities together, the G score has a small positive impact on the profit of the firm. Together, all these activities have a positive impact on firm efficiency except shareholder activities, and thus, we accept our Hypothesis 7. Finally, the summary of all the statistically significant relationships discussed above is presented in Table 9. The '+' and '-' signs represent positive and negative relationships, respectively, either in OLS or QR or both.
| Variables | ESG Score | E Score | S Score | G Score | Environmental Activities | Social Activities | Governance Activities | |||||||
| Environmental Innovation | Resource Use | Emission Related | Community | Product Responsibility | Human Rights | Workforce | Management | CSR | Shareholder | |||||
| Corporate Efficiency | + | + | + | + | + | + | + | + | + | + | + | + | ||
| ROA | + | - | + | + | + | + | + | |||||||
| Market Cap | + | + | + | + | + | + | + | + | ||||||
| Profit After Tax | + | + | - | + | + | - | + | + | + | + | ||||
| Note: '+' and '-' symbols represent significant positive and significant negative relationships between ESG and various firm performance parameters. Blank cells represent no significant relationship. | ||||||||||||||
DownLoad:
CSV
As expected, free cashflows and R & D expenditures are positively contributing to firm performance, while the presence of debt in the capital structure is negatively associated. Free cash flows are crucial as they provide the flexibility to invest in growth opportunities, pay debts, provide financial stability, strengthen firm resilience, etc. Through R & D, firms improve productivity, gain competitive advantages, and ensure long-term sustainability. When it comes to debt, excessive leverage can strain cash flow, increase financial risk, and limit investment flexibility, ultimately undermining firm performance.
In the above discussion, there is no doubt that there is a significant positive association between ESG and firm performance. While an extensive body of literature scrutinizes external financial performance, a noticeable gap exists when it comes to the examination of internal performance measures i.e., corporate efficiency. Preliminary investigation in Figure 6 shows that there is a non-linear relation between ESG and efficiency.

Thus, to find out the exact relation between ESG performance and corporate efficiency, we use the non-parametric kernel regression. Figure 6 shows that corporate efficiency tends to decrease when the overall ESG score is below 20. However, corporate efficiency starts to increase after 20 but remains relatively constant within the range of ESG scores from 40 to 80. Again, it starts to increase beyond an ESG score of 80 and then reaches its peak.
This means corporate efficiency is negatively related at low disclosure levels, constantly related at moderate disclosure levels, and positively related at higher disclosure levels. A similar type of trend can be seen between environmental scores and social scores with corporate efficiency. However, the relationship between governance score and corporate efficiency is almost static and constant. It first increases till a governance score of 20, then remains almost flat between 20 to 80, and then increases beyond 80.
It can be inferred that companies that demonstrate strong performance in ESG practices and attain high ESG scores also observe a consistent improvement in efficiency. Therefore, it can be said that by focusing on environmental, social, and governance aspects, companies can better utilize their inputs to generate output or revenue. These findings also suggest the presence of a non-linear and, specifically, U-shaped relationship between corporate efficiency and ESG scores. These observations are contradictory to the findings of Xie et al. (2019), where overall ESG score and environmental score have an inverse U-shaped relationship with corporate efficiency. While in line with Xie et al. (2019), we found a U-shaped relationship between governance score and corporate efficiency.
To further support this non-linear relationship, this study employs a piecewise regression model. Based on observations from the non-parametric kernel regression, different breakpoints for each different pair of relations are identified. Consequently, the ESG scores are divided into four levels: Low disclosure, lower-middle disclosure, upper-middle disclosure, and high disclosure level. With this method, we can investigate the complex relationship between corporate efficiency and ESG scores at various disclosure levels.
The findings of the piecewise regression are presented in Table 10. The results show that the coefficient of low disclosure is -0.0024 and statistically significant. This indicates that when the ESG score lies between 0 and 15, there is a negative relation between corporate efficiency and overall ESG score. Though it is not statistically significant, the coefficient shows a positive trend for lower-middle-level scores. On the other hand, the coefficient of ESG score is statistically significant and positive for upper-middle and high-level disclosure. This suggests a non-linear, U-shaped relationship between the ESG score and corporate efficiency. The negative relationship at the lower disclosure level could be attributed to information asymmetry. Low disclosure means the corporations are unable to meet the ESG requirements and fail to effectively utilize the available resources, ultimately leading to reduced corporate efficiency.
| Disclosure Level | ESG Score | E Score | S Score | G Score | ||||
| Intervals | Coefficients | Intervals | Coefficients | Intervals | Coefficients | Intervals | Coefficients | |
| Intercept | Intercept | 0.4970*** (0.0935) |
Intercept | 0.5416*** (0.0265) |
Intercept | 0.4886*** (0.0655) |
Intercept | 0.3852*** (0.0887) |
| Low level | [0-15] | −0.0024* (0.0068) |
[0-10] | −0.0006** (0.0003) |
[0-10] | 0.0014 (0.0073) |
[0-20] | 0.0090* (0.0046) |
| Lower-middle level | [15-40] | 0.0076 (0.0074) |
[10-90] | 0.0035* (0.0020) |
[10-50] | 0.0015 (0.0076) |
[20-85] | −0.0078* (0.0047) |
| Upper-middle level | [40-90] | 0.0033** (0.0015) |
[50-80] | 0.0024** (0.0011) |
||||
| High level | [90-100] | 0.0235* (0.0139) |
[90-100] | 0.0047 (0.0072) |
[80-100] | 0.0040* (0.0022) |
[85-100] | 0.0053* (0.0031) |
| Note: Standard errors in parentheses, * p < 0.10, ** p < 0.05, *** p < 0.01. | ||||||||
DownLoad:
CSV
Conversely, higher ESG scores indicate a commitment to environmental, social, and governance aspects, signifying better resource utilization and improved corporate efficiency. As a consequence, a low level of ESG disclosure has a detrimental impact on corporate efficiency. Whereas, upper-middle and high levels of ESG disclosure improve efficiency. Therefore, corporations should focus on improving their overall ESG score to upper-middle and high-level disclosure to get an edge over others in terms of corporate efficiency.
Further, investigating the individual components of the ESG scores reveals similar trends across the E, S, and G scores at different levels of disclosure. The intercepts for E, S, and G are all positive and statistically significant, indicating that even when the individual scores are zero, the E score exhibits a mean corporate efficiency of 0.5416, the S score has a mean of 0.4886, and the G score has a mean of 0.3852. Analyzing the E score shows a decline at low disclosure levels, and this negative association is statistically significant. However, no significant relationship exists at the middle level of disclosure.
Further, positive and statistically significant coefficients are observed at the upper-middle levels. The S score begins with an intercept of 0.4886. Thereafter, insignificant positive associations are found at low and lower-middle levels of disclosure. However, a positive and significant relationship is observed at the upper-middle and high levels of disclosure. Similarly, in the case of the G score, a weak negative association is initially present at low levels of disclosure, followed by a significant weak negative relation at the middle level of disclosure. However, the relationship becomes positive and stronger at a high level of disclosure. Based on the statistical significance of the coefficients, we can conclude that there exists a non-linear relationship between ESG and corporate efficiency. Figure 7 demonstrates the graphical representation of the same. Also, our findings are consistence with the study of Wu and Chang (2022) and Xie et al. (2019).

Finally, addressing our last research question, which investigates whether internal performance helps in bringing external performance, we use the mediation analysis proposed by Baron and Kenny (1986). The results of the mediation analysis are presented in Table 11 below. From the previous discussions in Table 4, we found a significant positive impact of ESG on the profit and market value of the firm with an insignificant impact on ROA. Therefore, we proceed with mediation analysis with only two external performance variables viz., profit and market capitalization. These results are also shown in Table 11. Thus, the first condition of Baron and Kenny is satisfied. Further, from Table 11 model 1, it can be observed that ESG is positively and significantly impacting corporate efficiency, which is the proxy for internal performance. Thus, the second condition is also satisfied. Regarding the third condition, which requires a significant relation between the mediating variable and dependent variable after controlling for the independent variable, we found a significant impact of corporate efficiency on the profit of the firm and an insignificant impact on market capitalization after controlling for ESG. Consequently, the third condition is fulfilled only for the external performance variable i.e., profit. Finally, when the criteria are profit, the coefficient of ESG in model 3 is less than in model 2. This results in satisfying the fourth condition. Since all the conditions of Baron and Kenny (1986) are satisfied for the variable profit, we can say that the relationship between ESG and profit is partially mediated by corporate efficiency. In other words, we can say that firm-level ESG integration brings internal efficiency and this internal efficiency is channeled into external performance. The Sobel test also confirms a significant mediation effect. This mediation analysis is similar and consistent with the findings of Jamali et al., (2017).
| Variables | (1) Corporate Efficiency | (2) LnProfit | (3) LnProfit | (4) LnMarketcap | (5) LnMarketcap |
| ESG | 0.00221*** (0.000317) |
0.00643*** (0.00179) |
0.00480** (0.00182) |
0.00587*** (0.00167) |
0.00612*** (0.00172) |
| Corporate Efficiency | - | - | 0.735*** (0.186) |
- | −0.114 (0.176) |
| LnCash | 0.0240*** (0.00384) |
0.604*** (0.0217) |
0.586*** (0.0219) |
0.514*** (0.0203) |
0.517*** (0.0207) |
| LnDebt | −0.00943*** (0.00265) |
0.113*** (0.0149) |
0.120*** (0.0149) |
0.0336** (0.0140) |
0.0325** (0.0141) |
| LnR & D | 0.00106 (0.00247) |
0.0544*** (0.0139) |
0.0536*** (0.0138) |
0.129*** (0.0130) |
0.129*** (0.0130) |
| Constant | 0.408*** (0.0204) |
1.030*** (0.115) |
0.730*** (0.137) |
4.707*** (0.108) |
4.754*** (0.129) |
| N | 909 | 909 | 909 | 909 | 909 |
| R2 | 0.139 | 0.719 | 0.724 | 0.688 | 0.688 |
| Indirect Effect | Not Applicable | 0.00163 | Not Applicable | ||
| Direct Effect | 0.00480 | ||||
| Total Effect | 0.00643 | ||||
| Mediated Total Effect | 25.35% | ||||
| Sobel Test z-statistics (p-value) | 3.8931*** (0.0000) | ||||
| Note: Standard errors in parentheses, * p < 0.10, ** p < 0.05, *** p < 0.01 | |||||
DownLoad:
CSV
ESG standards prioritize the equitable, prudent, just, and judicious allocation of organizational resources. These procedures and standards assist businesses in identifying inefficiencies related to the use of energy, raw materials, waste treatment, emissions, etc., to increase operational efficiency. Additionally, businesses that adhere to regulations on environment, governance, and social welfare face fewer risks to their organization, including fines and penalties. In addition to helping to create a more just and sustainable society, these ESG activities can place businesses for better profitability, financial success, resilience, and sustainable future growth. They can also stimulate innovation, promote long-term growth, foster goodwill, and create value for all stakeholders.
We apply the KRLS model proposed by Hainmuller and Hazlett (2014) to assess the robustness of the previous methods and results. The KRLS is a machine learning algorithm that uses pointwise derivatives to examine the relationship between variables without relying on linearity or additivity assumption. The results are presented in Table 12 below. The results obtained using the KRLS model are very similar to prior findings using OLS and demonstrate consistency. However, in the majority of cases, the magnitude of the KRLS coefficients decreased compared to the coefficients of OLS, yet the direction of the coefficients and the fundamental essence of the stated findings in this study remain unaltered.
| (1) | (2) | (3) | (4) | |
| Variables | Efficiency | ROA | LnProfit | LnMarketcap |
| Panel A: Overall ESG Scores on Firm Performance | ||||
| ESG | 0.00173*** | 0.00015 | 0.00535*** | 0.00326* |
| LnCash | 0.0284*** | 0.0272*** | 0.589*** | 0.451*** |
| LnDebt | −0.0227*** | -0.0215*** | 0.146*** | 0.0383** |
| LnR & D | 0.0152*** | −0.00215 | 0.0411* | 0.177*** |
| Panel B: Individual E, S, and G Scores on Firm Performance | ||||
| E Score | 0.00084*** | −0.00021* | 0.00619*** | 0.00235* |
| S Score | 0.00053* | 0.00027** | −0.00279* | 0.00082 |
| G Score | 0.00056** | 0.00019 | 0.00140 | −0.00228* |
| LnCash | 0.0267*** | 0.0230*** | 0.564*** | 0.426*** |
| LnDebt | −0.0217*** | −0.0179*** | 0.126*** | 0.0405** |
| LnR & D | 0.0131*** | −0.00206 | 0.0563*** | 0.173*** |
| Panel C: Environmental Activities on Firm Performance | ||||
| Environmental Innovation | 0.00023 | 0.00006 | 0.00462*** | 0.00059 |
| Resource Use | 0.00062** | −0.00003 | −0.00308** | 0.00138 |
| Emissions | 0.000371 | 0.0000510 | 0.00407*** | 0.00194 |
| LnCash | 0.0252*** | 0.0218*** | 0.579*** | 0.440*** |
| LnDebt | −0.0180*** | −0.0166*** | 0.125*** | 0.0303* |
| LnR & D | 0.0117*** | −0.00127 | 0.0564*** | 0.182*** |
| Panel D: Social Activities on Firm Performance | ||||
| Community | −0.00021 | 0.00014 | −0.00137 | 0.0008 |
| Product Responsibility | 0.00035* | 0.000002 | −0.00035 | −0.00054 |
| Human Rights | 0.00064*** | 0.00014 | −0.00285** | −0.00164 |
| Workforce | 0.00026 | −0.00014 | 0.00397** | 0.00247* |
| LnCash | 0.0249*** | 0.0242*** | 0.556*** | 0.416*** |
| LnDebt | −0.0167*** | −0.0192*** | 0.143*** | 0.0530*** |
| LnR & D | 0.0118*** | −0.00171 | 0.0613*** | 0.174*** |
| Panel E: Governance Activities on Firm Performance | ||||
| Management | 0.00037* | 0.00010 | 0.00066 | −0.00144 |
| CSR | 0.00084*** | −0.00004 | 0.00382*** | 0.00449*** |
| Shareholder | 0.00008 | 0.00014 | −0.00083 | −0.00117 |
| LnCash | 0.0260*** | 0.0237*** | 0.544*** | 0.419*** |
| LnDebt | −0.0200*** | −0.0190*** | 0.131*** | 0.0220 |
| LnR & D | 0.0137*** | −0.00121 | 0.0534*** | 0.183*** |
| Note: Standard errors in parentheses, * p < 0.10, ** p < 0.05, *** p < 0.01. | ||||
DownLoad:
CSV
The findings of this study on corporate-level ESG integration bridge the gaps that exist in the current literature and are also consistent with the previous literature. This study found a positive significant relationship between ESG practices and corporate efficiency. This aligns with recent studies that suggest high ESG scores improve operational efficiency by optimizing resource consumption, risk management, and minimizing waste (Chung et al., 2023; Aroul et al., 2022). Companies with strong ESG policies have lower operational expenses and higher productivity due to sustainable resource management and efficient supply chains. These findings validate Litvinova et al. (2023), who found that organizations prioritizing ESG bring improvement in energy efficiency and waste reduction, leading to improvement in corporate efficiency.
This study further reveals a significant positive association between ESG performance and corporate financial performance which is consistent with the previous literature (Habib & Mourad, 2023a). Firms with high ESG ratings not only demonstrate enhanced financial performance but also display an increased ability to adjust to market volatility and mitigate financial distress (Liu et al., 2023; Habib, 2023a). The outcomes of our study align with the findings of Ramirez et al. (2022), Fandella et al. (2023), and Aydoğmuş et al. (2022), which indicate that companies with higher ESG scores generally show improved stock performance, increased profitability, and reduced cost of capital. These companies have a stronger reputation, resulting in more customer loyalty, stakeholder influence, and improved market positioning, ultimately leading to greater financial performance (Yeh et al., 2023). However, these results are inconsistent with the studies of Masongweni & Simo-Kengne (2024) and Abdulla & Jawad (2024). The negative relation can be explained by the increased expenses and operational disruptions that occur during the implementation period. Adhering to ESG requirements might result in extra administrative responsibilities, which can cause temporary financial pressure. In addition, prioritizing long-term sustainability could potentially redirect resources away from more lucrative projects, thereby impacting short-term performance indicators. Nevertheless, studies have shown these negative consequences are temporary and short-term, implying a positive relation in the long run (Narula et al., 2024; Handoyo & Anas, 2024).
In addition, this study demonstrates that individual pillars have a favorable influence on business financial performance. Showing concern for the environment and implementing sustainable environmental practices can lead to cost savings, gaining public trust, and ultimately to improved efficiency and financial performance (Fosu et al., 2024). Social efforts promote a favorable corporate reputation, enhance employee morale and well-being, and result in improved financial performance (Jing et al., 2023). Effective governance procedure promotes transparency, accountability, and responsibility. These attract investors with lower cost of capital and higher profitability (Ramirez et al., 2022).
Regarding the mediation process, this research demonstrates that robust ESG standards result in improved corporate and operational efficiency, ultimately leading to better financial performance (Jamali et al., 2017). ESG practices improve operational efficiency by enhancing sustainable operations, effective risk management, and active stakeholder involvement. This increased efficiency leads to improved financial performance, as companies can decrease expenses, boost productivity, and take advantage of market opportunities.
This study adds to the literature on ESG performance, corporate efficiency, and business financial performance through the perspective of many theories. Integrating ESG into the company's operations has led to improved financial performance and market value, benefiting shareholders. Emphasizing ESG involves engaging in actions that are regarded as legitimate, lawful, and compliant with societal norms, thus satisfying the legitimacy theory. The findings also support and extend the stakeholder perspective. According to stakeholder theory, organizations must consider the interests of all stakeholders, including internal and external, to ensure long-term sustainability. For example, society gains from businesses that behave in a socially responsible manner; customers gain from better and safer products; the environment gains from businesses that practice eco-friendliness; the company gains from good governance practices; and so on. In the end, every stakeholder benefits.
These are also supported by the RBV of the firm which argues that a company's distinct resources and competencies can provide a competitive advantage. As per this study, the elements of ESG performance are uncommon, valuable, and unique, which allows companies to achieve better efficiency and firm performance. Corporate efficiency is the key element that gives a company a competitive advantage over another company. Thus, satisfying the resource-based view perspective.
This mechanism is also consistent with the shareholder theory, legitimacy theory, resource-based approach, and stakeholder theory, which propose that sustainable and ethical business practices confer competitive advantages to organizations (Lin & Wu, 2014; Freeman, 1984; Dowling & Pfeffer 1975; Friedman; 1970).
This study has a significant managerial implication for businesses. The findings highlight the necessity of taking a comprehensive strategy for ESG integration, as both overall ESG performance and the individual environmental, social, and governance pillars contribute to improved corporate efficiency and superior financial outcomes. Managers should seek to address ESG factors at the aggregate level rather than focusing solely on a particular dimension. This complete approach can help businesses optimize their operations, increase their brand image, and attract environmentally and socially concerned investors. Further, the positive association between ESG performance, corporate efficiency, and firm financial performance lends credibility to stakeholder theory. Managers should prioritize engaging with a diverse variety of stakeholders, such as employees, customers, suppliers, and local communities, to better understand their expectations and incorporate their interests into strategic decision-making. Effective stakeholder management can help businesses improve efficiency and financial performance. Moreover, the findings suggest that ESG performance is a valuable, rare, and unique resource that can provide organizations with competitive benefits like efficiency. Managers should see ESG integration as a strategic necessity to optimize capital allocation, increase operational efficiency, and provide superior financial performance.
In addition, the study emphasizes the significance of honest ESG disclosure in demonstrating a company's commitment to sustainability and responsible business practices. Managers should actively communicate their ESG performance to investors and other stakeholders to improve the firm's reputation, decrease risks, and attract environmentally and socially conscious capital. This transparency can also help businesses establish confidence with their stakeholders and demonstrate their commitment to sustainability. This alignment can help businesses develop a more sustainable and responsible business model. Consequently, businesses can differentiate themselves in the market and attract investors who appreciate sustainability.
Policymakers and regulators should continue to encourage the incorporation of ESG elements into business decision-making and reporting, as this can lead to increases in operational efficiency and financial performance. Investors should also urge corporations to take a holistic approach to ESG, as this analysis shows that such practices and policies have the potential to create value. Policymakers and investors who support ESG integration can help enterprises achieve long-term sustainability and contribute to a more responsible business environment. Firms can use these management implications to improve their ESG performance, increase corporate efficiency, create value for shareholders, and contribute to a more sustainable and responsible business environment.
There are some limitations to this study. We chose the internal performance measure i.e., corporate efficiency, to be the mediating variable. However, other internal qualitative factors can mediate the ESG and firm performance relationship like internally generated goodwill, managerial decision-making capacity, intellectual rights, work culture, etc. Thus, researchers could explore these underlying areas of the ESG-CFP relationship. Another limitation of this study is the presence of a heterogeneous group of firms from various sectors in the sample. Further, this study has not considered the banking and finance sector. Therefore, researchers could explore sector-specific relationships, particularly within the banking and energy sectors to provide a more comprehensive understanding. Another emerging area in the field of corporate sustainability is the probability of default or default risk, which is not addressed in this study. Thus, researchers could address this underexplored area by investigating the impact of ESG integration on corporate default risk.
This research paper is motivated by keeping four objectives in the background. First, to examine whether corporations' commitment to ESG issues leads to positive and improved firm performance or not. Second, to assess the impact of overall ESG and individual E, S, and G pillars on firm performance. Third, to find out which activities are responsible for this relationship. Fourth, to identify the type of non-linear relationship that exists between ESG performance and corporate efficiency. Finally, to verify whether the internal performance measure mediates the ESG performance and external performance.
The analysis reveals that overall ESG performance significantly and positively influences firm performance across various quantiles, including the mean, lower, median, and upper quantiles. When examining individual ESG pillars, the environmental pillar demonstrates a positive impact on firm efficiency and profit. Conversely, the social pillar positively affects efficiency and market value but exerts a negative influence on profit. Moreover, the governance pillar has a relatively limited impact on efficiency and profit. Digging deeper into ESG activities, environmental initiatives such as innovation and reducing emissions exhibit a positive relationship with profit. However, these factors do not significantly affect ROA and market value. In terms of social activities, community engagement plays a significant role in enhancing ROA, and market value, while the workforce factor primarily influences profit and efficiency. In the corporate governance dimension, CSR strategy is positively associated with ROA, profit, market value, and efficiency, whereas effective management contributes to enhanced efficiency. However, shareholder-related activities have a limited positive impact on firm performance. In summary, our findings highlight the positive influence of overall ESG scores, individual pillars, and respective ESG activities on firm financial performance. Moreover, a U-shaped relationship exists between overall ESG score, environmental score, social score, and efficiency, with efficiency initially declining at lower disclosure levels and gradually increasing from lower-middle to upper-middle and achieving the highest efficiency at high disclosure levels. Regarding mediation analysis, it is found that internal efficiency or corporate efficiency successfully mediates the relationship between ESG integration and profitability. In other words, it can be concluded that improvement in firm-level ESG integration brings efficiency to a corporation, and this efficiency generates profitability for the organization. The favorable outcome between ESG & financial performance and ESG & corporate efficiency supports the idea of addressing the concerns of various stakeholders to create value for the firm. This way, the integration of ESG in business practices is consistent with the shareholder theory, legitimacy theory, and stakeholder theory.
The findings of the study add to the extant literature in many ways. First, along with overall ESG, and individual ESG pillars, we identified the specific ESG activities like environmental innovation, resource use, emission, community, workforce, management, CSR, etc. related activities which are primarily responsible for driving the internal and external firm performance. Second, we also identified one of the channels through which ESG performance translates into external performance. Regarding this, we found corporate efficiency to be the mediator between ESG performance and the profitability of the firm. Third, we demonstrated the distributional aspect to gain insights into two-tail information associated with the ESG-CFP relationship. Finally, these results are consistent with a variety of ESG theories, including shareholder theory, legitimacy theory, stakeholder theory, and RBV. The identification of the specific ESG activities for better CFP and the channel of the flow of ESG performance to CFP through CE is done for the first time in the ESG literature bridging the research gaps.
In conclusion, a company's actions in areas like environmental preservation, social responsibility, and corporate governance practices can have far-reaching implications beyond ethical considerations. Businesses should recognize that adopting a balanced and comprehensive ESG strategy is not only a moral necessity but also brings a strategic advantage. Thus, companies should be encouraged to disclose ESG information on a higher and wider scale to increase corporate efficiency. The ESG integration in business supports the notion of the "doing well by doing good" and "flight-to-safety" concepts, which refers to the idea that companies that prioritize society, sustainability, and responsible business practices can also deliver strong financial performance and generate value for their stakeholders. Therefore, ESG has become a central focus for businesses worldwide as they strive to balance profitability with responsibility towards society. In other words, this means that a corporation can achieve success in both financial performance and ethical or sustainable practices without having to sacrifice one for the other.
The authors declare they have not used Artificial Intelligence (AI) tools in the creation of this article.
The authors declare no conflict of interest.
| [1] | The Florida Center of Excellence in Drug Discovery and Innovation (CDDI) is described at: http://www.research.usf.edu/cddi/drugdiscovery/resources.asp. |
| [2] |
Huang YM, Amsler AO, McClintock JB, et al. (2007) Patterns of gammarid amphipod abundance and species composition associated with dominant subtidal macroalgae along the western Antarctic Peninsula. Polar Biol 30: 1417-1430. doi: 10.1007/s00300-007-0303-1

|
| [3] |
Santiago DN, Pevzner Y, Durand AA, et al. (2012) Virtual Target Screening: Validation Using Kinase Inhibitors. J Chem Inf Model 52: 2192-2203. doi: 10.1021/ci300073m
|
| [4] |
Irwin JJ, Sterling T, Mysinger MM, et al. (2012) ZINC: A Free Tool to Discover Chemistry for Biology. J Chem Info Model 52:1757-1768. doi: 10.1021/ci3001277
|
| [5] |
Gerwick WH, Moore BS (2012) Lessons from the past and charting the future of marine natural products drug discovery and chemical biology. Chem Biol 19:85-98. doi: 10.1016/j.chembiol.2011.12.014
|
| [6] |
Swinney DC, Anthony J (2011) How were new medicines discovered? Nat Rev Drug Discov 10: 507-519. doi: 10.1038/nrd3480
|
| [7] |
Newman DJ, Cragg GM (2012) Natural Products as Sources of New Drugs over the 30 Years from 1981 to 2010. J Nat Prod 75: 311-335. doi: 10.1021/np200906s
|
| [8] |
Mishra BB, Tiwari VK (2011) Natural products: An evolving role in future drug discovery. Eur J Med Chem 46: 4769-4807. doi: 10.1016/j.ejmech.2011.07.057
|
| [9] |
Bachmann BO, Van Lanen SG, Baltz RH (2014) Microbial genome mining for accelerated natural products discovery: is a renaissance in the making? J Indust Microbiol Biotech 41: 175-184. doi: 10.1007/s10295-013-1389-9
|
| [10] |
Williams P, Sorribasa A, Howes MR (2011) Natural products as a source of Alzheimer's drug leads. Nat Prod Rep 28: 48-77. doi: 10.1039/C0NP00027B
|
| [11] |
Kuete V, Alibert-Franco S, Eyong KO, et al. (2011) Antibacterial activity of some natural products against bacteria expressing a multidrug-resistant phenotype. Int J Antimicrob Agents 37: 156-161. doi: 10.1016/j.ijantimicag.2010.10.020
|
| [12] |
Cragg GM, Newman DJ (2013) Natural products: A continuing source of novel drug leads. Biochim Biophys Acta 1830: 3670-3695. doi: 10.1016/j.bbagen.2013.02.008
|
| [13] |
Dayan FE, Owens DK, Duke SO (2012) Rationale for a natural products approach to herbicide discovery. Pest Mgmt Sci 68: 519-528. doi: 10.1002/ps.2332
|
| [14] |
Bugni TS, Harper MK, McCulloch MWB, et al. (2008) Fractionated marine invertebrate extract libraries for drug discovery. Molecules 13: 1372-1383. doi: 10.3390/molecules13061372
|
| [15] |
Molinski TF (2010) NMR of natural products at the “nanomole-scale”. Nat Prod Rep 27: 321-329. doi: 10.1039/b920545b
|
| [16] |
Nicolaou KC, Snyder SA (2005) Chasing molecules that were never there: misassigned natural products and the role of chemical synthesis in modern structure elucidation. Angew. Chem Int Ed Engl 44: 1012-1044. doi: 10.1002/anie.200460864
|
| [17] |
Penn K, Jenkins C, Nett M, et al. (2009) Genomic islands link secondary metabolism to functional adaptation in marine Actinobacteria. ISME J 3: 1193-1203. doi: 10.1038/ismej.2009.58
|
| [18] |
Lipinski CA, Lombardo F, Dominy BW, et al. (2001) Experimental and computational approaches to estimate solubility and permeability in drug discovery and development settings. Adv Drug Deliv Rev 46: 3-26. doi: 10.1016/S0169-409X(00)00129-0
|
| [19] |
Ursu O, Rayan A, Goldblum A, et al. (2011) Understanding drug-likeness. WIREs: Comp Mol Sci 1:760-781. doi: 10.1002/wcms.52
|
| [20] |
Bickerton GR, Paoliuni GV, Besnard J, et al. (2012) Quantifying the chemical beauty of drugs. Nat Chem 4: 90-98. doi: 10.1038/nchem.1243
|
| [21] | Matter H, Sotriffer C (2011) Applications and success stories in virtual screening. In: Virtual screening: principles, challenges, and practical guidelines. Wiley-VCH Verlag GmbH & Co. Ch. 12: 319-358. |
| [22] |
Vangrevelinghe E, Zimmermann K, Schoepfer J, et al. (2003) Discovery of a Potent and Selective Protein Kinase CK2 Inhibitor by High-Throughput Docking. J Med Chem 46: 2656-2662. doi: 10.1021/jm030827e
|
| [23] | Ewing TA, Makino S, Skillman AG, et al. (2001) DOCK 4.0: search strategies for automated molecular docking of flexible molecule databases. J Comp Mol Des 15: 411-428. |
| [24] | Friesner RA, Banks JL, Murphy RB, et al. (2004) Glide: New approach for rapid, accurate docking and scoring. 1. Method and Assessment of Docking Accuracy. J Med Chem 47: 1739-1749. |
| [25] |
26. Brooks WH, McCloskey DE, Daniel KE, et al. (2007) In Silico Chemical Library Screening and Experimental Validation of a Novel 9-Aminoacridine Based Lead-Inhibitor of Human S-Adenosylmethionine Decarboxylase. J Chem Info Model 47: 1897-1905. doi: 10.1021/ci700005t
|
| [26] |
27. Tolbert WD, Ekstrom JL, Mathews II, et al. (2001) The structural basis for substrate specificity and inhibition of human S-adenosylmethionine decarboxylase. Biochemistry 40: 9484-9494. doi: 10.1021/bi010735w
|
| [27] |
28. Berman HM, Westbrook J, Feng Z, et al. (2000) The Protein Data Bank. Nucl Acids Res 28: 235-242. doi: 10.1093/nar/28.1.235
|
| [28] |
29. Hui-Fang L, Qing S, Jian Z, et al. (2010) Evaluation of various inverse docking schemes in multiple targets identification. J Mol Graph Model 29: 326-330. doi: 10.1016/j.jmgm.2010.09.004
|
| [29] |
30. Grinter SZ, Liang Y, Huang SY, et al. (2011) An inverse docking approach for identifying new potential anti-cancer targets. J Mol Graph Model 795-799. doi: 10.1016/j.jmgm.2011.01.002
|
| [30] |
31. Do QT, Lamy C, Renimel I, et al. (2007) Reverse Pharmacognosy: Identifying Biological Properties for Plants by Means of their Molecule Constituents: Application to Meranzin. Planta Med 73: 1235-1240. doi: 10.1055/s-2007-990216
|
| [31] | 32. Li YY, An J, Jones SJM (2006) A Large-Scale Computational Approach to Drug Repositioning. Genome Info 17: 239-247. |
| [32] |
37. Miller BT, Singh RP, Klauda JB, et al. (2008) CHARMMing: a new, flexible web portal for CHARMM. J Chem Info Model 48: 1920-1929. doi: 10.1021/ci800133b
|
| [33] |
38. Wang Y, Xiao J, Suzek TO, et al. (2012) PubChem's BioAssay Database. Nucl Acids Res 40: D400-12. doi: 10.1093/nar/gkr1132
|
| [34] | 39. Bolton E, Wang Y, Thiessen PA, et al. (2008) PubChem: Integrated Platform of Small Molecules and Biological Activities. Chapter 12 in Annual Reports in Computational Chemistry, Volume 4, ACS, Washington, DC. |
| [35] |
42. Imhoff JF, Labes A, Wiese J (2011) Bio-mining the microbial treasures of the ocean: New natural products. Biotech Adv 29: 468-482. doi: 10.1016/j.biotechadv.2011.03.001
|
| [36] |
43. Liu X, Ashforth E, Ren B, et al. (2010) Bioprospecting microbial natural product libraries from the marine environment for drug discovery. J Antibiotics 63: 415-422. doi: 10.1038/ja.2010.56
|
| [37] |
44. Bauer RA, Wurst JM, Tan DS (2010) Expanding the range of “druggable” targets with natural product-based libraries: an academic perspective. Curr Op Chem Biol 14: 308-314. doi: 10.1016/j.cbpa.2010.02.001
|
| [38] |
45. Mayer AMS, Glaser KB, Cuevas C, et al. (2010) The odyssey of marine pharmaceuticals: a current pipeline perspective. Trends in Pharm Sci 31: 255-265. doi: 10.1016/j.tips.2010.02.005
|
| [39] | 46. Bennani YL (2011) Drug discovery in the next decade: innovation needed ASAP. Drug Disc Today 16: |
| [40] |
47. Keiser MJ, Setola V, Irwin JJ, et al. (2009) Predicting new molecular targets for known drugs. Nature 462: 175-182. doi: 10.1038/nature08506
|
| [41] |
48. Reker D, Rodrigues T, Schneider P, et al. (2014) Identifying the macromolecular targets of de novo-designed chemical entities through self-organizing map consensus. Proc Natl Acad Sci USA 111: 4067-4072. doi: 10.1073/pnas.1320001111
|
| [42] |
49. Liu X, Vogt I, Hague T, et al. (2013) HitPick: A web server for hit identification and target prediction of chemical screenings. Bioinformatics 29: 1910-1912. doi: 10.1093/bioinformatics/btt303
|
| [43] |
50. Gong J, Cai C, Liu X, et al. (2013) ChemMapper: A versatile web server for exploring pharmacology and chemical structure association based on molecular 3D similarity method. Bioinformatics 29: 1827-1829. doi: 10.1093/bioinformatics/btt270
|
| [44] |
51. Iorio F, Bosotti R, Scachen E, et al. (2010) Discovery of drug mode of action and drug repositioning from transcriptional responses. Proc Nat Acad Sic USA 107: 14621-14626. doi: 10.1073/pnas.1000138107
|
| [45] |
52. Zhu X, Kim JL, Newcomb JR, et al. (1999) Structural analysis of the lymphocyte-specific kinase Lck in complex with non-selective and Src family selective kinase inhibitors. Struct Fold Des 7: 651-661. doi: 10.1016/S0969-2126(99)80086-0
|
| [46] |
53. Goto M, Miyahara I, Hirotsu K, et al. (2005) Structural determinants for branched-chain aminotransferase isozyme-specific inhibition by the anticonvulsant drug gabapentin. J Biol Chem 280: 37237256. doi: 10.1074/jbc.M506486200
|
| [47] |
55. Halgren T (2009) Identifying and characterizing binding sites and assessing druggability. J Chem Inf Model 49:377-389. doi: 10.1021/ci800324m
|
| 1. | Rajashree Samal, Madhusmita Dash, Women's participation and gender equality in sustainable ecotourism: A bibliometric analysis, 2024, 107, 02775395, 102993, 10.1016/j.wsif.2024.102993 | |
| 2. | Biswajit Sarkar, Rekha Guchhait, Jin-Hee Ma, Mitali Sarkar, Qaiser Farooq Dar, Young-Hyo Ahn, Evaluating the multi-period operating efficiency of logistics firms in East Asia, 2025, 1360-2381, 1, 10.1080/13602381.2025.2454951 |
Yuri Pevzner, Daniel N. Santiago, Jacqueline L. von Salm, Rainer S. Metcalf, Kenyon G. Daniel, Laurent Calcul, H. Lee Woodcock, Bill J. Baker, Wayne C. Guida, Wesley H. Brooks. Virtual target screening to rapidly identify potential protein targets of natural products in drug discovery[J]. AIMS Molecular Science, 2014, 1(2): 81-98. doi: 10.3934/molsci.2014.2.81

| Author(s) | Year | Country/Region | Dimensions | Findings |
| Agarwala et al. (2024) | 2014 – 2022 | 305 companies listed in the NSE 500 | ESG and Firm Performance | The results indicate a U-shaped non-linear relationship between ESG disclosures and market performance of business enterprises |
| Wu et al. (2024) | 2018 – 2022 | 494 non-financial listed Chinese firms | ESG and firm financial performance | A significant and positive impact of ESG and its sub-dimensions (i.e., environment, social, and governance) on firm performance. |
| Narula et al. (2024) | 2018 – 2020 | India, 220 companies | ESG and Firm Performance | The performance of a firm is not substantially correlated with any of the ESG components. |
| Habib (2023) | 2016 – 2020 | 406 US firms | ESG and Firm Performance | Higher ESG performances have a better relation with firm performance. |
| Rahman et al. (2023) | 2016 – 2020 | 255 non-financial firms listed on the Pakistani stock exchange | ESG and Firm Performance | ESG and all of its dimensions positively affect ROA and Tobin's Q with a moderating effect of top management commitment and sustainability strategy. |
| Bissoondoyal-Bheenick et al. (2023) | 2007 – 2020 | G20 countries | ESG and Firm Performance | Larger firms tend to invest in ESG activities due to economies of scale, firms with better media coverage can reduce information asymmetry. These reduce costs and enhance the positive nexus between ESG-firm performance. |
| Wasiuzzaman et al. (2023) | 2009 – 2016 | 668 firms from the energy sector worldwide | ESG and Firm Performance | The results show that ESGD has a significant negative impact on energy profitability, while the cultural dimension moderates the relationship. |
| Veeravel et al. (2023) | 2010–2020 | NSE 500 Index of India | ESG and Firm Performance | Findings show that ESG disclosures positively influence firm performance, with a better influence on Tobin's Q at a higher quantile. |
| Shobhwani and Lodha (2023) | 2021 – 2022 | NIFTY 100 of India | ESG risk score and firm performance. | ESG risk score and its components do not show any significant impact on market performance. |
| Chen et al. (2023) | 2011 – 2020 | 3332 listed companies on major stock markets worldwide | ESG and Corporate Financial Performance | The impact of ESG ratings on business performance is strong for large-scale companies but negligible for small-scale companies. |
| Boulhaga et al. (2022) | 2012 – 2018 | French listed firms | Internal control Weakness (ICW), ESG and Firm Performance | The results found that both ICW and ESG ratings have a positive and significant influence on a firm's performance. |
| Wu and Chang (2022) | 2005 – 2020 | Taiwan | ESG and Firm Value | Non-linear relationship between ESG and firm value, E and S pillars have a Concave-Convex relationship |
DownLoad:
CSV
| Variables | Codes | Nature | Description | Sources |
| Variables for DEA | ||||
| Total Assets | TA | Input Variable | Total assets of the sample companies | Refinitiv |
| Employees | EMP | Input Variable | Total no of full-time employees of the sample companies | Refinitiv |
| Cost of Goods Sold | COGS | Input Variable | Total cost of goods sold by the sample companies | Refinitiv |
| Revenue | REV | Output Variable | Total revenue earned by the companies during the year | Refinitiv |
| Variables for Regression Analysis | ||||
| Corporate Efficiency | CE | Mediating and Dependent Variable | Efficiency scores of companies generated by the DEA model | Authors' calculation |
| Profit After Tax | PAT | Dependent Variable | Profit of firms after deducting taxes | Refinitiv |
| Return on Assets | ROA | Dependent Variable | Net income divided by total assets of the firm | Refinitiv |
| Market Capitalisation | Marketcap | Dependent Variable | The market value of the firm (market price*no of shares) | Refinitiv |
| Overall ESG Score | ESG | Independent Variable | Overall ESG scores of sample companies | Refinitiv |
| Environmental Score | E Score | Independent Variable | Environmental pillar scores of sample companies | Refinitiv |
| Social Score | S Score | Independent Variable | Social pillar scores of sample companies | Refinitiv |
| Governance Score | G Score | Independent Variable | Governance pillar scores of sample companies | Refinitiv |
| Free Cashflows | Cash | Control Variable | Net free cash held by the firm | Refinitiv |
| Debt | Debt | Control variable | Total long-term debt use in the capital structure | Refinitiv |
| Research and Development Expenditure | R & D | Control variable | R & D expenditure by the corporation | Refinitiv |
DownLoad:
CSV
| Variables | Obs | Mean | Std. dev. | Min | Median | Max |
| ESG Score | 909 | 58.00 | 19.82 | 3.29 | 60.50 | 95.76 |
| E Score | 909 | 53.57 | 25.70 | 0.00 | 58.34 | 98.27 |
| S Score | 909 | 58.23 | 24.14 | 1.46 | 60.88 | 97.48 |
| G Score | 909 | 60.79 | 21.01 | 3.38 | 63.96 | 98.05 |
| Revenue (Million USD) | 909 | 14118.14 | 40120.05 | 61.43 | 3396.90 | 603240.10 |
| Assets (million USD) | 909 | 21791.80 | 53963.27 | 63.21 | 5180.25 | 663541.10 |
| No. of Employees | 909 | 30560.62 | 59224.64 | 58.00 | 11273 | 675805.00 |
| COGS (million USD) | 909 | 8865.78 | 26423.74 | 0.00 | 1848.00 | 395613.40 |
| PAT (million USD) | 909 | 1857.09 | 7769.53 | 1.29 | 343.00 | 160767.90 |
| Market Capitalization (million USD) | 909 | 38062.68 | 166583.90 | 138.16 | 7112.32 | 2749123.00 |
| Free Cash Flows (million USD) | 909 | 1788.09 | 7575.10 | 2.18 | 266.00 | 148531.00 |
| Debt (million USD) | 909 | 5358.93 | 14178.50 | 0.00 | 953.70 | 217928.10 |
| R & D Expense (million USD) | 909 | 7539.73 | 25118.09 | 0.00 | 1010.00 | 395000.00 |
DownLoad:
CSV
| Variables | Corporate Efficiency | ROA | LnProfit | LnMarketcap | ||||||||||||
| OLS | QR | OLS | QR | OLS | QR | OLS | QR | |||||||||
| Q25 | Q50 | Q75 | Q25 | Q50 | Q75 | Q25 | Q50 | Q75 | Q25 | Q50 | Q75 | |||||
| ESG | 0.00221*** | 0.00258*** | 0.00213*** | 0.00216*** | 0.00006 | 0.00030** | 0.00020 | 0.00003 | 0.00643*** | 0.00831*** | 0.00395** | 0.00482*** | 0.00587*** | 0.00614** | 0.00628** | 0.00773*** |
| (0.00031) | (0.00050) | (0.00036) | (0.00039) | (0.00016) | (0.00012) | (0.00012) | (0.00014) | (0.00179) | (0.00183) | (0.00217) | (0.00135) | (0.00167) | (0.00299) | (0.00248) | (0.00262) | |
| LnCash | 0.0240*** | 0.0150** | 0.0220*** | 0.0272*** | 0.0192*** | 0.0107*** | 0.0166*** | 0.0213*** | 0.604*** | 0.728*** | 0.669*** | 0.578*** | 0.514*** | 0.520*** | 0.512*** | 0.498*** |
| (0.00384) | (0.00561) | (0.00581) | (0.00463) | (0.00195) | (0.00121) | (0.00181) | (0.00201) | (0.0217) | (0.0484) | (0.0432) | (0.0371) | (0.0203) | (0.0419) | (0.0327) | (0.0487) | |
| LnDebt | −0.0094*** | −0.00833** | −0.0066*** | −0.0122*** | −0.0149*** | −0.0110*** | −0.0144*** | −0.0189*** | 0.113*** | 0.0517** | 0.0832*** | 0.118*** | 0.0336** | 0.00392 | 0.0225 | 0.0288 |
| (0.00265) | (0.00266) | (0.00317) | (0.00560) | (0.00135) | (0.00118) | (0.00190) | (0.00162) | (0.0149) | (0.0179) | (0.0142) | (0.0169) | (0.0140) | (0.0332) | (0.0152) | (0.0214) | |
| LnR & D | 0.00106 | 0.00446 | 0.00238 | −0.00083 | 0.00032 | 0.00106 | 0.00054 | 0.00129 | 0.0544*** | 0.0464** | 0.0545** | 0.0581*** | 0.129*** | 0.157*** | 0.144*** | 0.119*** |
| (0.00247) | (0.00400) | (0.00542) | (0.00421) | (0.00126) | (0.000608) | (0.00110) | (0.00166) | (0.0139) | (0.0297) | (0.0191) | (0.0149) | (0.0130) | (0.0245) | (0.0258) | (0.0213) | |
| Constant | 0.408*** | 0.292*** | 0.391*** | 0.532*** | 0.0851*** | 0.0450*** | 0.0735*** | 0.121*** | 1.030*** | 0.245* | 1.078*** | 1.710*** | 4.707*** | 4.098*** | 4.688*** | 5.361*** |
| (0.0204) | (0.0254) | (0.0272) | (0.0355) | (0.0104) | (0.00588) | (0.00890) | (0.0126) | (0.115) | (0.141) | (0.172) | (0.158) | (0.108) | (0.190) | (0.110) | (0.137) | |
| Note: Standard errors in parentheses, * p < 0.10, ** p < 0.05, *** p < 0.01 | ||||||||||||||||
DownLoad:
CSV
| Variables | Corporate Efficiency | ROA | LnMarketCap | LnProfit | ||||||||||||
| OLS | QR | OLS | QR | OLS | QR | OLS | QR | |||||||||
| Q25 | Q50 | Q75 | Q25 | Q50 | Q75 | Q25 | Q50 | Q75 | Q25 | Q50 | Q75 | |||||
| E Score | 0.00073** | 0.00153*** | 0.00106** | 0.00055 | −0.00039** | −0.00012* | −0.00003 | −0.00018 | 0.00303* | 0.00103 | 0.00168 | 0.00357 | 0.00830*** | 0.00909*** | 0.00755*** | 0.00683*** |
| (0.00031) | (0.00043) | (0.00048) | (0.00053) | (0.00015) | (0.00007) | (0.00013) | (0.00015) | (0.00162) | (0.00231) | (0.00241) | (0.00259) | (0.00172) | (0.00261) | (0.00166) | (0.00232) | |
| S Score | 0.00095*** | 0.00049 | 0.00067** | 0.00113** | 0.00026 | 0.00036** | 0.00016 | 0.00025 | 0.00345** | 0.00523** | 0.00506* | 0.00467** | −0.00392** | −0.00238 | −0.00430*** | −0.00326 |
| (0.00032) | (0.00044) | (0.00032) | (0.00054) | (0.00016) | (0.00015) | (0.00011) | (0.00019) | (0.00169) | (0.00231) | (0.00261) | (0.00231) | (0.00179) | (0.00375) | (0.00141) | (0.00256) | |
| G Score | 0.00055* | 0.00049 | 0.00054 | 0.00047 | 0.00025* | 0.00003 | 0.00009 | 0.00001 | −0.00127 | −0.00220 | −0.00031 | −0.00182 | 0.00335** | 0.00201* | 0.00209 | 0.00207 |
| (0.00028) | (0.00048) | (0.00033) | (0.00042) | (0.00014) | (0.00011) | (0.00011) | (0.00018) | (0.00151) | (0.00201) | (0.00221) | (0.00189) | (0.00160) | (0.00116) | (0.00127) | (0.00204) | |
| LnCash | 0.0238*** | 0.0155** | 0.0202*** | 0.0270*** | 0.0194*** | 0.0112*** | 0.0161*** | 0.0213*** | 0.513*** | 0.506*** | 0.512*** | 0.487*** | 0.600*** | 0.712*** | 0.667*** | 0.600*** |
| (0.00384) | (0.00634) | (0.00466) | (0.00456) | (0.00195) | (0.00141) | (0.00209) | (0.00249) | (0.0202) | (0.0428) | (0.0348) | (0.0360) | (0.0215) | (0.0403) | (0.0314) | (0.0267) | |
| LnDebt | −0.00982*** | −0.0100** | −0.00696* | −0.0134*** | −0.0143*** | −0.0107*** | −0.0139*** | −0.0188*** | 0.0302** | 0.0220 | 0.0156 | 0.0314* | 0.102*** | 0.0499** | 0.0747*** | 0.100*** |
| (0.00270) | (0.00401) | (0.00386) | (0.00498) | (0.00137) | (0.00119) | (0.00170) | (0.00220) | (0.0142) | (0.0329) | (0.0193) | (0.0167) | (0.0151) | (0.0247) | (0.0117) | (0.0156) | |
| LnR & D | 0.00107 | 0.00557 | 0.00215 | −0.00064 | 0.00003 | 0.00057 | 0.00026 | 0.00108 | 0.128*** | 0.159*** | 0.147*** | 0.121*** | 0.0601*** | 0.0572*** | 0.0473*** | 0.0571*** |
| (0.00248) | (0.00463) | (0.00365) | (0.00536) | (0.00126) | (0.00063) | (0.00105) | (0.0008) | (0.0131) | (0.0230) | (0.0226) | (0.0206) | (0.0139) | (0.0190) | (0.0140) | (0.0120) | |
| Constant | 0.413*** | 0.302*** | 0.399*** | 0.539*** | 0.0760*** | 0.0458*** | 0.0720*** | 0.116*** | 4.794*** | 4.192*** | 4.709*** | 5.486*** | 1.038*** | 0.299* | 1.128*** | 1.674*** |
| (0.0217) | (0.0273) | (0.0220) | (0.0476) | (0.0110) | (0.00933) | (0.0117) | (0.0149) | (0.114) | (0.201) | (0.186) | (0.194) | (0.121) | (0.174) | (0.137) | (0.124) | |
| Note: Standard errors in parentheses, * p < 0.10, ** p < 0.05, *** p < 0.01 | ||||||||||||||||
DownLoad:
CSV
| Variables | Corporate Efficiency | ROA | LnMarketCap | LnProfit | ||||||||||||||||
| OLS | QR | OLS | QR | OLS | QR | OLS | QR | |||||||||||||
| Q25 | Q50 | Q75 | Q25 | Q50 | Q75 | Q25 | Q50 | Q75 | Q25 | Q50 | Q75 | |||||||||
| Environmental Innovation | 0.00016 | 0.00060** | 0.00028 | −0.00006 | −0.00005 | 0.00007 | 0.00001 | −0.00013 | 0.00065 | 0.00085 | 0.00084 | 0.00088 | 0.00391*** | 0.00428*** | 0.00317*** | 0.00215*** | ||||
| (0.00018) | (0.00028) | (0.00023) | (0.00033) | (0.00009) | (0.00006) | (0.00004) | (0.00014) | (0.00095) | (0.00133) | (0.00099) | (0.00119) | (0.00101) | (0.00158) | (0.00091) | (0.00072) | |||||
| Resource Use | 0.00078*** | 0.00096** | 0.00099*** | 0.00110* | −0.00011 | 0.0000472 | 0.0000231 | −0.00016 | 0.00122 | 0.00377* | 0.00229 | −0.0016 | −0.00195 | 0.000765 | −0.00179 | −0.0023** | ||||
| (0.00028) | (0.00042) | (0.00035) | (0.00058) | (0.00014) | (0.00013) | (0.00009) | (0.00014) | (0.00147) | (0.00216) | (0.00158) | (0.00146 | (0.00156) | (0.00167) | (0.00168) | (0.00105) | |||||
| Emissions | 0.000539* | 0.00062 | 0.000475 | −0.00001 | 0.000003 | 0.00004 | 0.00005 | 0.00021 | 0.00420*** | 0.000994 | 0.00258 | 0.00737*** | 0.00599*** | 0.0025 | 0.00525*** | 0.00666*** | ||||
| (0.00028) | (0.00039) | (0.0003) | (0.00046) | (0.00014) | (0.00012) | (0.00008) | (0.00015) | (0.00151) | (0.00296) | (0.00207) | (0.00208) | (0.0016) | (0.00264) | (0.002) | (0.0018) | |||||
| LnCash | 0.0245*** | 0.0161** | 0.0209** | 0.0267*** | 0.0197*** | 0.0103*** | 0.0160*** | 0.0210*** | 0.509*** | 0.516*** | 0.498*** | 0.483*** | 0.605*** | 0.730*** | 0.662*** | 0.603*** | ||||
| (0.00388) | (0.00649) | (0.00648) | (0.005) | (0.00196) | (0.0017) | (0.0019) | (0.00199) | (0.0202) | (0.024) | (0.028) | (0.041) | (0.0215) | (0.039) | (0.0369) | (0.0248) | |||||
| LnDebt | −0.00940*** | −0.0093*** | −0.00723 | −0.0108** | −0.0142*** | −0.0107*** | −0.0137*** | −0.0186*** | 0.0265* | 0.00278 | 0.0135 | 0.0314* | 0.0978*** | 0.0456* | 0.0775*** | 0.0953*** | ||||
| (0.00273) | (0.0028) | (0.00485) | (0.00471) | (0.00138) | (0.0011) | (0.00131) | (0.00215) | (0.0142) | (0.0174) | (0.0127) | (0.0169) | (0.0151) | (0.0235) | (0.0148) | (0.0147) | |||||
| LnR & D | 0.0023 | 0.00678 | 0.00162 | 0.00267 | 0.000635 | 0.00139*** | 0.00088 | 0.00184 | 0.131*** | 0.160*** | 0.157*** | 0.144*** | 0.0549*** | 0.0499** | 0.0436** | 0.0560*** | ||||
| (0.00248) | (0.00496) | (0.00544) | (0.00571) | (0.00125) | (0.00054) | (0.00135) | (0.00153) | (0.0129) | (0.0286) | (0.0211) | (0.0236) | (0.0137) | (0.0202) | (0.0184) | (0.0164) | |||||
| Constant | 0.439*** | 0.308*** | 0.431*** | 0.560*** | 0.0875*** | 0.0531*** | 0.0761*** | 0.119*** | 4.754*** | 4.157*** | 4.775*** | 5.319*** | 1.111*** | 0.416*** | 1.116*** | 1.655*** | ||||
| (0.0196) | (0.0335) | (0.0258) | (0.0454) | (0.00994) | (0.00742) | (0.00725) | (0.00991) | (0.103) | (0.164) | (0.163) | (0.11) | (0.109) | (0.138) | (0.133) | (0.126) | |||||
| Note: Standard errors in parentheses, * p < 0.10, ** p < 0.05, *** p < 0.01. | ||||||||||||||||||||
DownLoad:
CSV
| Variables | Corporate Efficiency | ROA | LnMarketCap | LnProfit | |||||||||||||
| OLS | QR | OLS | QR | OLS | QR | OLS | QR | ||||||||||
| Q25 | Q50 | Q75 | Q25 | Q50 | Q75 | Q25 | Q50 | Q75 | Q25 | Q50 | Q75 | ||||||
| Community | 0.00006 | -0.00025 | -0.00020 | 0.00033 | 0.00006 | 0.00023*** | 0.00009 | 0.00034** | 0.00412*** | 0.00396 | 0.00381 | 0.00432** | -0.00066 | -0.00067 | -0.00085 | 0.00026 | |
| (0.00026) | (0.00048) | (0.00029) | (0.00036) | (0.00013) | (0.000074) | (0.00009) | (0.00011) | (0.00137) | (0.0016) | (0.0018) | (0.0021) | (0.00148) | (0.00232) | (0.00114) | (0.0021) | ||
| Product Responsibility | 0.00054** | 0.00047* | 0.00064*** | 0.00079** | 0.00001 | −0.00008 | −0.00004 | −0.00005 | −0.00148 | −0.00019 | −0.00129 | −0.00039 | 0.00048 | 0.00233 | −0.00076 | −0.00019 | |
| (0.00022) | (0.00047) | (0.00035) | (0.00043) | (0.00011) | (0.00008) | (0.00008) | (0.00015) | (0.00118) | (0.00191) | (0.00132) | (0.00204) | (0.00127) | (0.00165) | (0.00164) | (0.0012) | ||
| Human Rights | 0.00051** | 0.00095*** | 0.00074*** | 0.00003 | 0.00014 | 0.00011 | 0.00014 | 0.00004 | −0.00025 | −0.00053 | 0.00086 | −0.00093 | −0.00013 | 0.00017 | 0.00065 | −0.00005 | |
| (0.00022) | (0.00034) | (0.00021) | (0.00035) | (0.00011) | (0.00009) | (0.00009) | (0.00014) | (0.00118) | (0.00154) | (0.00115) | (0.00107) | (0.00128) | (0.00134) | (0.00121) | (0.0017) | ||
| Workforce | 0.00064** | 0.00055 | 0.00045 | 0.00075** | −0.00013 | −0.00001 | −0.00004 | −0.00012 | 0.00311** | 0.00130 | 0.00211 | 0.00379 | 0.00386** | 0.00420* | 0.00253** | 0.00323 | |
| (0.00028) | (0.00035) | (0.00031) | (0.00034) | (0.00014) | (0.00007) | (0.00011) | (0.00014) | (0.00146) | (0.00238) | (0.00126) | (0.00166) | (0.00158) | (0.00285) | (0.00149) | (0.0016) | ||
| LnCash | 0.0253*** | 0.0207*** | 0.0223*** | 0.0295*** | 0.0194*** | 0.0109*** | 0.0156*** | 0.0204*** | 0.505*** | 0.519*** | 0.496*** | 0.495*** | 0.606*** | 0.715*** | 0.678*** | 0.587*** | |
| (0.00390) | (0.00528) | (0.00468) | (0.00521) | (0.00198) | (0.00165) | (0.00185) | (0.00243) | (0.0204) | (0.0435) | (0.0368) | (0.0350) | (0.0220) | (0.0419) | (0.0318) | (0.0319) | ||
| LnDebt | −0.00878*** | −0.00752** | −0.00539 | −0.0123*** | −0.0151*** | −0.0109*** | −0.0145*** | −0.0194*** | 0.0394*** | 0.0153 | 0.0214 | 0.0392** | 0.120*** | 0.0550* | 0.0881*** | 0.121*** | |
| (0.00265) | (0.00521) | (0.00500) | (0.00553) | (0.00135) | (0.000942) | (0.00166) | (0.00158) | (0.0139) | (0.0269) | (0.0199) | (0.0168) | (0.0150) | (0.0194) | (0.0175) | (0.0166) | ||
| LnR & D | 0.00122 | 0.00443 | 0.00286 | −0.00192 | 0.00001 | 0.00087 | 0.00057 | 0.00141 | 0.126*** | 0.152*** | 0.143*** | 0.117*** | 0.0607*** | 0.0610** | 0.0585** | 0.0570*** | |
| (0.00250) | (0.00448) | (0.00536) | (0.00441) | (0.00127) | (0.00110) | (0.00101) | (0.00110) | (0.0131) | (0.0266) | (0.0184) | (0.0213) | (0.0141) | (0.0257) | (0.0187) | (0.0177) | ||
| Constant | 0.421*** | 0.314*** | 0.408*** | 0.535*** | 0.0891*** | 0.0507*** | 0.0828*** | 0.117*** | 4.729*** | 4.143*** | 4.824*** | 5.316*** | 1.052*** | 0.295 | 1.081*** | 1.702*** | |
| (0.0211) | (0.0269) | (0.0352) | (0.0444) | (0.0107) | (0.00809) | (0.0110) | (0.0123) | (0.110) | (0.166) | (0.148) | (0.131) | (0.119) | (0.204) | (0.167) | (0.147) | ||
| Note: Standard errors in parentheses, * p < 0.10, ** p < 0.05, *** p < 0.01 | |||||||||||||||||
DownLoad:
CSV
| Variables | Corporate Efficiency | ROA | LnMarketCap | LnProfit | |||||||||||||||||
| OLS | QR | OLS | QR | OLS | QR | OLS | QR | ||||||||||||||
| Q25 | Q50 | Q75 | Q25 | Q50 | Q75 | Q25 | Q50 | Q75 | Q25 | Q50 | Q75 | ||||||||||
| Management | 0.00047** | 0.00065* | 0.00031 | 0.00050* | 0.00013 | 0.00005 | −0.00001 | −0.00003 | −0.00100 | −0.00029 | −0.00046 | −0.00098 | 0.00209* | 0.00115 | 0.00085 | 0.00124 | |||||
| (0.00021) | (0.00039) | (0.00027) | (0.00028) | (0.00010) | (0.00008) | (0.00007) | (0.00014) | (0.00112) | (0.00134) | (0.00184) | (0.00139) | (0.00120) | (0.00204) | (0.00101) | (0.00151) | ||||||
| CSR | 0.00092*** | 0.00089*** | 0.00098*** | 0.00102*** | −0.00008 | 0.00010 | 0.00016** | −0.000013 | 0.00553*** | 0.00587*** | −0.00472*** | 0.00568*** | 0.00504*** | 0.00536*** | 0.00453*** | 0.00474*** | |||||
| (0.00021) | (0.00044) | (0.00026) | (0.00027) | (0.00010) | (0.00009) | (0.00007) | (0.00008) | (0.00110) | (0.00141) | (0.0016888) | (0.00167) | (0.00118) | (0.00160) | (0.00135) | (0.00150) | ||||||
| Shareholder | 0.00022 | 0.00032 | 0.00029 | 0.00007 | 0.00014 | 0.00005 | 0.00008 | 0.00026*** | −0.00031 | −0.00075 | −0.00117 | −0.00024 | −0.00007 | −0.00077 | −0.00057 | −0.00166 | |||||
| (0.00021) | (0.00033) | (0.00026) | (0.00027) | (0.00011) | (0.00007) | (0.00006) | (0.00010) | (0.00111) | (0.00160) | (0.00077) | (0.00188) | (0.00119) | (0.00139) | (0.00102) | (0.000965 | ||||||
| LnCash | 0.0245*** | 0.0216*** | 0.0213*** | 0.0259*** | 0.0196*** | 0.0105*** | 0.0165*** | 0.0216*** | 0.507*** | 0.511*** | 0.49749*** | 0.509*** | 0.594*** | 0.744*** | 0.656*** | 0.579*** | |||||
| (0.00394) | (0.00705) | (0.00446) | (0.00403) | (0.00198) | (0.00197) | (0.00220) | (0.00269) | (0.0204) | (0.0548) | (0.03397) | (0.0365) | (0.0219) | (0.0513) | (0.0328) | (0.0217) | ||||||
| LnDebt | −0.00833*** | −0.00651 | −0.00539* | −0.0142*** | −0.0148*** | −0.0109*** | −0.0150*** | −0.0183*** | 0.0287** | 0.000712 | 0.01545 | 0.0338 | 0.107*** | 0.0386 | 0.0777*** | 0.106*** | |||||
| (0.00268) | (0.00388) | (0.00297) | (0.00445) | (0.00135) | (0.00158) | (0.00218) | (0.00217) | (0.0139) | (0.0295) | (0.02257) | (0.0227) | (0.0149) | (0.0318) | (0.0157) | (0.0147) | ||||||
| LnR & D | 0.00267 | 0.00421 | 0.00380 | 0.00349 | 0.000213 | 0.00157* | 0.00077 | 0.00118 | 0.133*** | 0.149*** | 0.16215*** | 0.129*** | 0.0574*** | 0.0519** | 0.0489*** | 0.0589*** | |||||
| (0.00247) | (0.00352) | (0.00430) | (0.00592) | (0.00124) | (0.00104) | (0.00120) | (0.00107) | (0.0128) | (0.0190) | (0.01772) | (0.0211) | (0.0137) | (0.0211) | (0.0101) | (0.0110) | ||||||
| Constant | 0.419*** | 0.283*** | 0.410*** | 0.549*** | 0.0747*** | 0.0479*** | 0.0738*** | 0.104*** | 4.843*** | 4.282*** | 4.86925*** | 5.383*** | 1.047*** | 0.328** | 1.149*** | 1.777*** | |||||
| Note: Standard errors in parentheses, * p < 0.10, ** p < 0.05, *** p < 0.01 | |||||||||||||||||||||
DownLoad:
CSV
| Variables | ESG Score | E Score | S Score | G Score | Environmental Activities | Social Activities | Governance Activities | |||||||
| Environmental Innovation | Resource Use | Emission Related | Community | Product Responsibility | Human Rights | Workforce | Management | CSR | Shareholder | |||||
| Corporate Efficiency | + | + | + | + | + | + | + | + | + | + | + | + | ||
| ROA | + | - | + | + | + | + | + | |||||||
| Market Cap | + | + | + | + | + | + | + | + | ||||||
| Profit After Tax | + | + | - | + | + | - | + | + | + | + | ||||
| Note: '+' and '-' symbols represent significant positive and significant negative relationships between ESG and various firm performance parameters. Blank cells represent no significant relationship. | ||||||||||||||
DownLoad:
CSV
| Disclosure Level | ESG Score | E Score | S Score | G Score | ||||
| Intervals | Coefficients | Intervals | Coefficients | Intervals | Coefficients | Intervals | Coefficients | |
| Intercept | Intercept | 0.4970*** (0.0935) |
Intercept | 0.5416*** (0.0265) |
Intercept | 0.4886*** (0.0655) |
Intercept | 0.3852*** (0.0887) |
| Low level | [0-15] | −0.0024* (0.0068) |
[0-10] | −0.0006** (0.0003) |
[0-10] | 0.0014 (0.0073) |
[0-20] | 0.0090* (0.0046) |
| Lower-middle level | [15-40] | 0.0076 (0.0074) |
[10-90] | 0.0035* (0.0020) |
[10-50] | 0.0015 (0.0076) |
[20-85] | −0.0078* (0.0047) |
| Upper-middle level | [40-90] | 0.0033** (0.0015) |
[50-80] | 0.0024** (0.0011) |
||||
| High level | [90-100] | 0.0235* (0.0139) |
[90-100] | 0.0047 (0.0072) |
[80-100] | 0.0040* (0.0022) |
[85-100] | 0.0053* (0.0031) |
| Note: Standard errors in parentheses, * p < 0.10, ** p < 0.05, *** p < 0.01. | ||||||||
DownLoad:
CSV
| Variables | (1) Corporate Efficiency | (2) LnProfit | (3) LnProfit | (4) LnMarketcap | (5) LnMarketcap |
| ESG | 0.00221*** (0.000317) |
0.00643*** (0.00179) |
0.00480** (0.00182) |
0.00587*** (0.00167) |
0.00612*** (0.00172) |
| Corporate Efficiency | - | - | 0.735*** (0.186) |
- | −0.114 (0.176) |
| LnCash | 0.0240*** (0.00384) |
0.604*** (0.0217) |
0.586*** (0.0219) |
0.514*** (0.0203) |
0.517*** (0.0207) |
| LnDebt | −0.00943*** (0.00265) |
0.113*** (0.0149) |
0.120*** (0.0149) |
0.0336** (0.0140) |
0.0325** (0.0141) |
| LnR & D | 0.00106 (0.00247) |
0.0544*** (0.0139) |
0.0536*** (0.0138) |
0.129*** (0.0130) |
0.129*** (0.0130) |
| Constant | 0.408*** (0.0204) |
1.030*** (0.115) |
0.730*** (0.137) |
4.707*** (0.108) |
4.754*** (0.129) |
| N | 909 | 909 | 909 | 909 | 909 |
| R2 | 0.139 | 0.719 | 0.724 | 0.688 | 0.688 |
| Indirect Effect | Not Applicable | 0.00163 | Not Applicable | ||
| Direct Effect | 0.00480 | ||||
| Total Effect | 0.00643 | ||||
| Mediated Total Effect | 25.35% | ||||
| Sobel Test z-statistics (p-value) | 3.8931*** (0.0000) | ||||
| Note: Standard errors in parentheses, * p < 0.10, ** p < 0.05, *** p < 0.01 | |||||
DownLoad:
CSV
| (1) | (2) | (3) | (4) | |
| Variables | Efficiency | ROA | LnProfit | LnMarketcap |
| Panel A: Overall ESG Scores on Firm Performance | ||||
| ESG | 0.00173*** | 0.00015 | 0.00535*** | 0.00326* |
| LnCash | 0.0284*** | 0.0272*** | 0.589*** | 0.451*** |
| LnDebt | −0.0227*** | -0.0215*** | 0.146*** | 0.0383** |
| LnR & D | 0.0152*** | −0.00215 | 0.0411* | 0.177*** |
| Panel B: Individual E, S, and G Scores on Firm Performance | ||||
| E Score | 0.00084*** | −0.00021* | 0.00619*** | 0.00235* |
| S Score | 0.00053* | 0.00027** | −0.00279* | 0.00082 |
| G Score | 0.00056** | 0.00019 | 0.00140 | −0.00228* |
| LnCash | 0.0267*** | 0.0230*** | 0.564*** | 0.426*** |
| LnDebt | −0.0217*** | −0.0179*** | 0.126*** | 0.0405** |
| LnR & D | 0.0131*** | −0.00206 | 0.0563*** | 0.173*** |
| Panel C: Environmental Activities on Firm Performance | ||||
| Environmental Innovation | 0.00023 | 0.00006 | 0.00462*** | 0.00059 |
| Resource Use | 0.00062** | −0.00003 | −0.00308** | 0.00138 |
| Emissions | 0.000371 | 0.0000510 | 0.00407*** | 0.00194 |
| LnCash | 0.0252*** | 0.0218*** | 0.579*** | 0.440*** |
| LnDebt | −0.0180*** | −0.0166*** | 0.125*** | 0.0303* |
| LnR & D | 0.0117*** | −0.00127 | 0.0564*** | 0.182*** |
| Panel D: Social Activities on Firm Performance | ||||
| Community | −0.00021 | 0.00014 | −0.00137 | 0.0008 |
| Product Responsibility | 0.00035* | 0.000002 | −0.00035 | −0.00054 |
| Human Rights | 0.00064*** | 0.00014 | −0.00285** | −0.00164 |
| Workforce | 0.00026 | −0.00014 | 0.00397** | 0.00247* |
| LnCash | 0.0249*** | 0.0242*** | 0.556*** | 0.416*** |
| LnDebt | −0.0167*** | −0.0192*** | 0.143*** | 0.0530*** |
| LnR & D | 0.0118*** | −0.00171 | 0.0613*** | 0.174*** |
| Panel E: Governance Activities on Firm Performance | ||||
| Management | 0.00037* | 0.00010 | 0.00066 | −0.00144 |
| CSR | 0.00084*** | −0.00004 | 0.00382*** | 0.00449*** |
| Shareholder | 0.00008 | 0.00014 | −0.00083 | −0.00117 |
| LnCash | 0.0260*** | 0.0237*** | 0.544*** | 0.419*** |
| LnDebt | −0.0200*** | −0.0190*** | 0.131*** | 0.0220 |
| LnR & D | 0.0137*** | −0.00121 | 0.0534*** | 0.183*** |
| Note: Standard errors in parentheses, * p < 0.10, ** p < 0.05, *** p < 0.01. | ||||
DownLoad:
CSV
| Author(s) | Year | Country/Region | Dimensions | Findings |
| Agarwala et al. (2024) | 2014 – 2022 | 305 companies listed in the NSE 500 | ESG and Firm Performance | The results indicate a U-shaped non-linear relationship between ESG disclosures and market performance of business enterprises |
| Wu et al. (2024) | 2018 – 2022 | 494 non-financial listed Chinese firms | ESG and firm financial performance | A significant and positive impact of ESG and its sub-dimensions (i.e., environment, social, and governance) on firm performance. |
| Narula et al. (2024) | 2018 – 2020 | India, 220 companies | ESG and Firm Performance | The performance of a firm is not substantially correlated with any of the ESG components. |
| Habib (2023) | 2016 – 2020 | 406 US firms | ESG and Firm Performance | Higher ESG performances have a better relation with firm performance. |
| Rahman et al. (2023) | 2016 – 2020 | 255 non-financial firms listed on the Pakistani stock exchange | ESG and Firm Performance | ESG and all of its dimensions positively affect ROA and Tobin's Q with a moderating effect of top management commitment and sustainability strategy. |
| Bissoondoyal-Bheenick et al. (2023) | 2007 – 2020 | G20 countries | ESG and Firm Performance | Larger firms tend to invest in ESG activities due to economies of scale, firms with better media coverage can reduce information asymmetry. These reduce costs and enhance the positive nexus between ESG-firm performance. |
| Wasiuzzaman et al. (2023) | 2009 – 2016 | 668 firms from the energy sector worldwide | ESG and Firm Performance | The results show that ESGD has a significant negative impact on energy profitability, while the cultural dimension moderates the relationship. |
| Veeravel et al. (2023) | 2010–2020 | NSE 500 Index of India | ESG and Firm Performance | Findings show that ESG disclosures positively influence firm performance, with a better influence on Tobin's Q at a higher quantile. |
| Shobhwani and Lodha (2023) | 2021 – 2022 | NIFTY 100 of India | ESG risk score and firm performance. | ESG risk score and its components do not show any significant impact on market performance. |
| Chen et al. (2023) | 2011 – 2020 | 3332 listed companies on major stock markets worldwide | ESG and Corporate Financial Performance | The impact of ESG ratings on business performance is strong for large-scale companies but negligible for small-scale companies. |
| Boulhaga et al. (2022) | 2012 – 2018 | French listed firms | Internal control Weakness (ICW), ESG and Firm Performance | The results found that both ICW and ESG ratings have a positive and significant influence on a firm's performance. |
| Wu and Chang (2022) | 2005 – 2020 | Taiwan | ESG and Firm Value | Non-linear relationship between ESG and firm value, E and S pillars have a Concave-Convex relationship |
| Variables | Codes | Nature | Description | Sources |
| Variables for DEA | ||||
| Total Assets | TA | Input Variable | Total assets of the sample companies | Refinitiv |
| Employees | EMP | Input Variable | Total no of full-time employees of the sample companies | Refinitiv |
| Cost of Goods Sold | COGS | Input Variable | Total cost of goods sold by the sample companies | Refinitiv |
| Revenue | REV | Output Variable | Total revenue earned by the companies during the year | Refinitiv |
| Variables for Regression Analysis | ||||
| Corporate Efficiency | CE | Mediating and Dependent Variable | Efficiency scores of companies generated by the DEA model | Authors' calculation |
| Profit After Tax | PAT | Dependent Variable | Profit of firms after deducting taxes | Refinitiv |
| Return on Assets | ROA | Dependent Variable | Net income divided by total assets of the firm | Refinitiv |
| Market Capitalisation | Marketcap | Dependent Variable | The market value of the firm (market price*no of shares) | Refinitiv |
| Overall ESG Score | ESG | Independent Variable | Overall ESG scores of sample companies | Refinitiv |
| Environmental Score | E Score | Independent Variable | Environmental pillar scores of sample companies | Refinitiv |
| Social Score | S Score | Independent Variable | Social pillar scores of sample companies | Refinitiv |
| Governance Score | G Score | Independent Variable | Governance pillar scores of sample companies | Refinitiv |
| Free Cashflows | Cash | Control Variable | Net free cash held by the firm | Refinitiv |
| Debt | Debt | Control variable | Total long-term debt use in the capital structure | Refinitiv |
| Research and Development Expenditure | R & D | Control variable | R & D expenditure by the corporation | Refinitiv |
| Variables | Obs | Mean | Std. dev. | Min | Median | Max |
| ESG Score | 909 | 58.00 | 19.82 | 3.29 | 60.50 | 95.76 |
| E Score | 909 | 53.57 | 25.70 | 0.00 | 58.34 | 98.27 |
| S Score | 909 | 58.23 | 24.14 | 1.46 | 60.88 | 97.48 |
| G Score | 909 | 60.79 | 21.01 | 3.38 | 63.96 | 98.05 |
| Revenue (Million USD) | 909 | 14118.14 | 40120.05 | 61.43 | 3396.90 | 603240.10 |
| Assets (million USD) | 909 | 21791.80 | 53963.27 | 63.21 | 5180.25 | 663541.10 |
| No. of Employees | 909 | 30560.62 | 59224.64 | 58.00 | 11273 | 675805.00 |
| COGS (million USD) | 909 | 8865.78 | 26423.74 | 0.00 | 1848.00 | 395613.40 |
| PAT (million USD) | 909 | 1857.09 | 7769.53 | 1.29 | 343.00 | 160767.90 |
| Market Capitalization (million USD) | 909 | 38062.68 | 166583.90 | 138.16 | 7112.32 | 2749123.00 |
| Free Cash Flows (million USD) | 909 | 1788.09 | 7575.10 | 2.18 | 266.00 | 148531.00 |
| Debt (million USD) | 909 | 5358.93 | 14178.50 | 0.00 | 953.70 | 217928.10 |
| R & D Expense (million USD) | 909 | 7539.73 | 25118.09 | 0.00 | 1010.00 | 395000.00 |
| Variables | Corporate Efficiency | ROA | LnProfit | LnMarketcap | ||||||||||||
| OLS | QR | OLS | QR | OLS | QR | OLS | QR | |||||||||
| Q25 | Q50 | Q75 | Q25 | Q50 | Q75 | Q25 | Q50 | Q75 | Q25 | Q50 | Q75 | |||||
| ESG | 0.00221*** | 0.00258*** | 0.00213*** | 0.00216*** | 0.00006 | 0.00030** | 0.00020 | 0.00003 | 0.00643*** | 0.00831*** | 0.00395** | 0.00482*** | 0.00587*** | 0.00614** | 0.00628** | 0.00773*** |
| (0.00031) | (0.00050) | (0.00036) | (0.00039) | (0.00016) | (0.00012) | (0.00012) | (0.00014) | (0.00179) | (0.00183) | (0.00217) | (0.00135) | (0.00167) | (0.00299) | (0.00248) | (0.00262) | |
| LnCash | 0.0240*** | 0.0150** | 0.0220*** | 0.0272*** | 0.0192*** | 0.0107*** | 0.0166*** | 0.0213*** | 0.604*** | 0.728*** | 0.669*** | 0.578*** | 0.514*** | 0.520*** | 0.512*** | 0.498*** |
| (0.00384) | (0.00561) | (0.00581) | (0.00463) | (0.00195) | (0.00121) | (0.00181) | (0.00201) | (0.0217) | (0.0484) | (0.0432) | (0.0371) | (0.0203) | (0.0419) | (0.0327) | (0.0487) | |
| LnDebt | −0.0094*** | −0.00833** | −0.0066*** | −0.0122*** | −0.0149*** | −0.0110*** | −0.0144*** | −0.0189*** | 0.113*** | 0.0517** | 0.0832*** | 0.118*** | 0.0336** | 0.00392 | 0.0225 | 0.0288 |
| (0.00265) | (0.00266) | (0.00317) | (0.00560) | (0.00135) | (0.00118) | (0.00190) | (0.00162) | (0.0149) | (0.0179) | (0.0142) | (0.0169) | (0.0140) | (0.0332) | (0.0152) | (0.0214) | |
| LnR & D | 0.00106 | 0.00446 | 0.00238 | −0.00083 | 0.00032 | 0.00106 | 0.00054 | 0.00129 | 0.0544*** | 0.0464** | 0.0545** | 0.0581*** | 0.129*** | 0.157*** | 0.144*** | 0.119*** |
| (0.00247) | (0.00400) | (0.00542) | (0.00421) | (0.00126) | (0.000608) | (0.00110) | (0.00166) | (0.0139) | (0.0297) | (0.0191) | (0.0149) | (0.0130) | (0.0245) | (0.0258) | (0.0213) | |
| Constant | 0.408*** | 0.292*** | 0.391*** | 0.532*** | 0.0851*** | 0.0450*** | 0.0735*** | 0.121*** | 1.030*** | 0.245* | 1.078*** | 1.710*** | 4.707*** | 4.098*** | 4.688*** | 5.361*** |
| (0.0204) | (0.0254) | (0.0272) | (0.0355) | (0.0104) | (0.00588) | (0.00890) | (0.0126) | (0.115) | (0.141) | (0.172) | (0.158) | (0.108) | (0.190) | (0.110) | (0.137) | |
| Note: Standard errors in parentheses, * p < 0.10, ** p < 0.05, *** p < 0.01 | ||||||||||||||||
| Variables | Corporate Efficiency | ROA | LnMarketCap | LnProfit | ||||||||||||
| OLS | QR | OLS | QR | OLS | QR | OLS | QR | |||||||||
| Q25 | Q50 | Q75 | Q25 | Q50 | Q75 | Q25 | Q50 | Q75 | Q25 | Q50 | Q75 | |||||
| E Score | 0.00073** | 0.00153*** | 0.00106** | 0.00055 | −0.00039** | −0.00012* | −0.00003 | −0.00018 | 0.00303* | 0.00103 | 0.00168 | 0.00357 | 0.00830*** | 0.00909*** | 0.00755*** | 0.00683*** |
| (0.00031) | (0.00043) | (0.00048) | (0.00053) | (0.00015) | (0.00007) | (0.00013) | (0.00015) | (0.00162) | (0.00231) | (0.00241) | (0.00259) | (0.00172) | (0.00261) | (0.00166) | (0.00232) | |
| S Score | 0.00095*** | 0.00049 | 0.00067** | 0.00113** | 0.00026 | 0.00036** | 0.00016 | 0.00025 | 0.00345** | 0.00523** | 0.00506* | 0.00467** | −0.00392** | −0.00238 | −0.00430*** | −0.00326 |
| (0.00032) | (0.00044) | (0.00032) | (0.00054) | (0.00016) | (0.00015) | (0.00011) | (0.00019) | (0.00169) | (0.00231) | (0.00261) | (0.00231) | (0.00179) | (0.00375) | (0.00141) | (0.00256) | |
| G Score | 0.00055* | 0.00049 | 0.00054 | 0.00047 | 0.00025* | 0.00003 | 0.00009 | 0.00001 | −0.00127 | −0.00220 | −0.00031 | −0.00182 | 0.00335** | 0.00201* | 0.00209 | 0.00207 |
| (0.00028) | (0.00048) | (0.00033) | (0.00042) | (0.00014) | (0.00011) | (0.00011) | (0.00018) | (0.00151) | (0.00201) | (0.00221) | (0.00189) | (0.00160) | (0.00116) | (0.00127) | (0.00204) | |
| LnCash | 0.0238*** | 0.0155** | 0.0202*** | 0.0270*** | 0.0194*** | 0.0112*** | 0.0161*** | 0.0213*** | 0.513*** | 0.506*** | 0.512*** | 0.487*** | 0.600*** | 0.712*** | 0.667*** | 0.600*** |
| (0.00384) | (0.00634) | (0.00466) | (0.00456) | (0.00195) | (0.00141) | (0.00209) | (0.00249) | (0.0202) | (0.0428) | (0.0348) | (0.0360) | (0.0215) | (0.0403) | (0.0314) | (0.0267) | |
| LnDebt | −0.00982*** | −0.0100** | −0.00696* | −0.0134*** | −0.0143*** | −0.0107*** | −0.0139*** | −0.0188*** | 0.0302** | 0.0220 | 0.0156 | 0.0314* | 0.102*** | 0.0499** | 0.0747*** | 0.100*** |
| (0.00270) | (0.00401) | (0.00386) | (0.00498) | (0.00137) | (0.00119) | (0.00170) | (0.00220) | (0.0142) | (0.0329) | (0.0193) | (0.0167) | (0.0151) | (0.0247) | (0.0117) | (0.0156) | |
| LnR & D | 0.00107 | 0.00557 | 0.00215 | −0.00064 | 0.00003 | 0.00057 | 0.00026 | 0.00108 | 0.128*** | 0.159*** | 0.147*** | 0.121*** | 0.0601*** | 0.0572*** | 0.0473*** | 0.0571*** |
| (0.00248) | (0.00463) | (0.00365) | (0.00536) | (0.00126) | (0.00063) | (0.00105) | (0.0008) | (0.0131) | (0.0230) | (0.0226) | (0.0206) | (0.0139) | (0.0190) | (0.0140) | (0.0120) | |
| Constant | 0.413*** | 0.302*** | 0.399*** | 0.539*** | 0.0760*** | 0.0458*** | 0.0720*** | 0.116*** | 4.794*** | 4.192*** | 4.709*** | 5.486*** | 1.038*** | 0.299* | 1.128*** | 1.674*** |
| (0.0217) | (0.0273) | (0.0220) | (0.0476) | (0.0110) | (0.00933) | (0.0117) | (0.0149) | (0.114) | (0.201) | (0.186) | (0.194) | (0.121) | (0.174) | (0.137) | (0.124) | |
| Note: Standard errors in parentheses, * p < 0.10, ** p < 0.05, *** p < 0.01 | ||||||||||||||||
| Variables | Corporate Efficiency | ROA | LnMarketCap | LnProfit | ||||||||||||||||
| OLS | QR | OLS | QR | OLS | QR | OLS | QR | |||||||||||||
| Q25 | Q50 | Q75 | Q25 | Q50 | Q75 | Q25 | Q50 | Q75 | Q25 | Q50 | Q75 | |||||||||
| Environmental Innovation | 0.00016 | 0.00060** | 0.00028 | −0.00006 | −0.00005 | 0.00007 | 0.00001 | −0.00013 | 0.00065 | 0.00085 | 0.00084 | 0.00088 | 0.00391*** | 0.00428*** | 0.00317*** | 0.00215*** | ||||
| (0.00018) | (0.00028) | (0.00023) | (0.00033) | (0.00009) | (0.00006) | (0.00004) | (0.00014) | (0.00095) | (0.00133) | (0.00099) | (0.00119) | (0.00101) | (0.00158) | (0.00091) | (0.00072) | |||||
| Resource Use | 0.00078*** | 0.00096** | 0.00099*** | 0.00110* | −0.00011 | 0.0000472 | 0.0000231 | −0.00016 | 0.00122 | 0.00377* | 0.00229 | −0.0016 | −0.00195 | 0.000765 | −0.00179 | −0.0023** | ||||
| (0.00028) | (0.00042) | (0.00035) | (0.00058) | (0.00014) | (0.00013) | (0.00009) | (0.00014) | (0.00147) | (0.00216) | (0.00158) | (0.00146 | (0.00156) | (0.00167) | (0.00168) | (0.00105) | |||||
| Emissions | 0.000539* | 0.00062 | 0.000475 | −0.00001 | 0.000003 | 0.00004 | 0.00005 | 0.00021 | 0.00420*** | 0.000994 | 0.00258 | 0.00737*** | 0.00599*** | 0.0025 | 0.00525*** | 0.00666*** | ||||
| (0.00028) | (0.00039) | (0.0003) | (0.00046) | (0.00014) | (0.00012) | (0.00008) | (0.00015) | (0.00151) | (0.00296) | (0.00207) | (0.00208) | (0.0016) | (0.00264) | (0.002) | (0.0018) | |||||
| LnCash | 0.0245*** | 0.0161** | 0.0209** | 0.0267*** | 0.0197*** | 0.0103*** | 0.0160*** | 0.0210*** | 0.509*** | 0.516*** | 0.498*** | 0.483*** | 0.605*** | 0.730*** | 0.662*** | 0.603*** | ||||
| (0.00388) | (0.00649) | (0.00648) | (0.005) | (0.00196) | (0.0017) | (0.0019) | (0.00199) | (0.0202) | (0.024) | (0.028) | (0.041) | (0.0215) | (0.039) | (0.0369) | (0.0248) | |||||
| LnDebt | −0.00940*** | −0.0093*** | −0.00723 | −0.0108** | −0.0142*** | −0.0107*** | −0.0137*** | −0.0186*** | 0.0265* | 0.00278 | 0.0135 | 0.0314* | 0.0978*** | 0.0456* | 0.0775*** | 0.0953*** | ||||
| (0.00273) | (0.0028) | (0.00485) | (0.00471) | (0.00138) | (0.0011) | (0.00131) | (0.00215) | (0.0142) | (0.0174) | (0.0127) | (0.0169) | (0.0151) | (0.0235) | (0.0148) | (0.0147) | |||||
| LnR & D | 0.0023 | 0.00678 | 0.00162 | 0.00267 | 0.000635 | 0.00139*** | 0.00088 | 0.00184 | 0.131*** | 0.160*** | 0.157*** | 0.144*** | 0.0549*** | 0.0499** | 0.0436** | 0.0560*** | ||||
| (0.00248) | (0.00496) | (0.00544) | (0.00571) | (0.00125) | (0.00054) | (0.00135) | (0.00153) | (0.0129) | (0.0286) | (0.0211) | (0.0236) | (0.0137) | (0.0202) | (0.0184) | (0.0164) | |||||
| Constant | 0.439*** | 0.308*** | 0.431*** | 0.560*** | 0.0875*** | 0.0531*** | 0.0761*** | 0.119*** | 4.754*** | 4.157*** | 4.775*** | 5.319*** | 1.111*** | 0.416*** | 1.116*** | 1.655*** | ||||
| (0.0196) | (0.0335) | (0.0258) | (0.0454) | (0.00994) | (0.00742) | (0.00725) | (0.00991) | (0.103) | (0.164) | (0.163) | (0.11) | (0.109) | (0.138) | (0.133) | (0.126) | |||||
| Note: Standard errors in parentheses, * p < 0.10, ** p < 0.05, *** p < 0.01. | ||||||||||||||||||||
| Variables | Corporate Efficiency | ROA | LnMarketCap | LnProfit | |||||||||||||
| OLS | QR | OLS | QR | OLS | QR | OLS | QR | ||||||||||
| Q25 | Q50 | Q75 | Q25 | Q50 | Q75 | Q25 | Q50 | Q75 | Q25 | Q50 | Q75 | ||||||
| Community | 0.00006 | -0.00025 | -0.00020 | 0.00033 | 0.00006 | 0.00023*** | 0.00009 | 0.00034** | 0.00412*** | 0.00396 | 0.00381 | 0.00432** | -0.00066 | -0.00067 | -0.00085 | 0.00026 | |
| (0.00026) | (0.00048) | (0.00029) | (0.00036) | (0.00013) | (0.000074) | (0.00009) | (0.00011) | (0.00137) | (0.0016) | (0.0018) | (0.0021) | (0.00148) | (0.00232) | (0.00114) | (0.0021) | ||
| Product Responsibility | 0.00054** | 0.00047* | 0.00064*** | 0.00079** | 0.00001 | −0.00008 | −0.00004 | −0.00005 | −0.00148 | −0.00019 | −0.00129 | −0.00039 | 0.00048 | 0.00233 | −0.00076 | −0.00019 | |
| (0.00022) | (0.00047) | (0.00035) | (0.00043) | (0.00011) | (0.00008) | (0.00008) | (0.00015) | (0.00118) | (0.00191) | (0.00132) | (0.00204) | (0.00127) | (0.00165) | (0.00164) | (0.0012) | ||
| Human Rights | 0.00051** | 0.00095*** | 0.00074*** | 0.00003 | 0.00014 | 0.00011 | 0.00014 | 0.00004 | −0.00025 | −0.00053 | 0.00086 | −0.00093 | −0.00013 | 0.00017 | 0.00065 | −0.00005 | |
| (0.00022) | (0.00034) | (0.00021) | (0.00035) | (0.00011) | (0.00009) | (0.00009) | (0.00014) | (0.00118) | (0.00154) | (0.00115) | (0.00107) | (0.00128) | (0.00134) | (0.00121) | (0.0017) | ||
| Workforce | 0.00064** | 0.00055 | 0.00045 | 0.00075** | −0.00013 | −0.00001 | −0.00004 | −0.00012 | 0.00311** | 0.00130 | 0.00211 | 0.00379 | 0.00386** | 0.00420* | 0.00253** | 0.00323 | |
| (0.00028) | (0.00035) | (0.00031) | (0.00034) | (0.00014) | (0.00007) | (0.00011) | (0.00014) | (0.00146) | (0.00238) | (0.00126) | (0.00166) | (0.00158) | (0.00285) | (0.00149) | (0.0016) | ||
| LnCash | 0.0253*** | 0.0207*** | 0.0223*** | 0.0295*** | 0.0194*** | 0.0109*** | 0.0156*** | 0.0204*** | 0.505*** | 0.519*** | 0.496*** | 0.495*** | 0.606*** | 0.715*** | 0.678*** | 0.587*** | |
| (0.00390) | (0.00528) | (0.00468) | (0.00521) | (0.00198) | (0.00165) | (0.00185) | (0.00243) | (0.0204) | (0.0435) | (0.0368) | (0.0350) | (0.0220) | (0.0419) | (0.0318) | (0.0319) | ||
| LnDebt | −0.00878*** | −0.00752** | −0.00539 | −0.0123*** | −0.0151*** | −0.0109*** | −0.0145*** | −0.0194*** | 0.0394*** | 0.0153 | 0.0214 | 0.0392** | 0.120*** | 0.0550* | 0.0881*** | 0.121*** | |
| (0.00265) | (0.00521) | (0.00500) | (0.00553) | (0.00135) | (0.000942) | (0.00166) | (0.00158) | (0.0139) | (0.0269) | (0.0199) | (0.0168) | (0.0150) | (0.0194) | (0.0175) | (0.0166) | ||
| LnR & D | 0.00122 | 0.00443 | 0.00286 | −0.00192 | 0.00001 | 0.00087 | 0.00057 | 0.00141 | 0.126*** | 0.152*** | 0.143*** | 0.117*** | 0.0607*** | 0.0610** | 0.0585** | 0.0570*** | |
| (0.00250) | (0.00448) | (0.00536) | (0.00441) | (0.00127) | (0.00110) | (0.00101) | (0.00110) | (0.0131) | (0.0266) | (0.0184) | (0.0213) | (0.0141) | (0.0257) | (0.0187) | (0.0177) | ||
| Constant | 0.421*** | 0.314*** | 0.408*** | 0.535*** | 0.0891*** | 0.0507*** | 0.0828*** | 0.117*** | 4.729*** | 4.143*** | 4.824*** | 5.316*** | 1.052*** | 0.295 | 1.081*** | 1.702*** | |
| (0.0211) | (0.0269) | (0.0352) | (0.0444) | (0.0107) | (0.00809) | (0.0110) | (0.0123) | (0.110) | (0.166) | (0.148) | (0.131) | (0.119) | (0.204) | (0.167) | (0.147) | ||
| Note: Standard errors in parentheses, * p < 0.10, ** p < 0.05, *** p < 0.01 | |||||||||||||||||
| Variables | Corporate Efficiency | ROA | LnMarketCap | LnProfit | |||||||||||||||||
| OLS | QR | OLS | QR | OLS | QR | OLS | QR | ||||||||||||||
| Q25 | Q50 | Q75 | Q25 | Q50 | Q75 | Q25 | Q50 | Q75 | Q25 | Q50 | Q75 | ||||||||||
| Management | 0.00047** | 0.00065* | 0.00031 | 0.00050* | 0.00013 | 0.00005 | −0.00001 | −0.00003 | −0.00100 | −0.00029 | −0.00046 | −0.00098 | 0.00209* | 0.00115 | 0.00085 | 0.00124 | |||||
| (0.00021) | (0.00039) | (0.00027) | (0.00028) | (0.00010) | (0.00008) | (0.00007) | (0.00014) | (0.00112) | (0.00134) | (0.00184) | (0.00139) | (0.00120) | (0.00204) | (0.00101) | (0.00151) | ||||||
| CSR | 0.00092*** | 0.00089*** | 0.00098*** | 0.00102*** | −0.00008 | 0.00010 | 0.00016** | −0.000013 | 0.00553*** | 0.00587*** | −0.00472*** | 0.00568*** | 0.00504*** | 0.00536*** | 0.00453*** | 0.00474*** | |||||
| (0.00021) | (0.00044) | (0.00026) | (0.00027) | (0.00010) | (0.00009) | (0.00007) | (0.00008) | (0.00110) | (0.00141) | (0.0016888) | (0.00167) | (0.00118) | (0.00160) | (0.00135) | (0.00150) | ||||||
| Shareholder | 0.00022 | 0.00032 | 0.00029 | 0.00007 | 0.00014 | 0.00005 | 0.00008 | 0.00026*** | −0.00031 | −0.00075 | −0.00117 | −0.00024 | −0.00007 | −0.00077 | −0.00057 | −0.00166 | |||||
| (0.00021) | (0.00033) | (0.00026) | (0.00027) | (0.00011) | (0.00007) | (0.00006) | (0.00010) | (0.00111) | (0.00160) | (0.00077) | (0.00188) | (0.00119) | (0.00139) | (0.00102) | (0.000965 | ||||||
| LnCash | 0.0245*** | 0.0216*** | 0.0213*** | 0.0259*** | 0.0196*** | 0.0105*** | 0.0165*** | 0.0216*** | 0.507*** | 0.511*** | 0.49749*** | 0.509*** | 0.594*** | 0.744*** | 0.656*** | 0.579*** | |||||
| (0.00394) | (0.00705) | (0.00446) | (0.00403) | (0.00198) | (0.00197) | (0.00220) | (0.00269) | (0.0204) | (0.0548) | (0.03397) | (0.0365) | (0.0219) | (0.0513) | (0.0328) | (0.0217) | ||||||
| LnDebt | −0.00833*** | −0.00651 | −0.00539* | −0.0142*** | −0.0148*** | −0.0109*** | −0.0150*** | −0.0183*** | 0.0287** | 0.000712 | 0.01545 | 0.0338 | 0.107*** | 0.0386 | 0.0777*** | 0.106*** | |||||
| (0.00268) | (0.00388) | (0.00297) | (0.00445) | (0.00135) | (0.00158) | (0.00218) | (0.00217) | (0.0139) | (0.0295) | (0.02257) | (0.0227) | (0.0149) | (0.0318) | (0.0157) | (0.0147) | ||||||
| LnR & D | 0.00267 | 0.00421 | 0.00380 | 0.00349 | 0.000213 | 0.00157* | 0.00077 | 0.00118 | 0.133*** | 0.149*** | 0.16215*** | 0.129*** | 0.0574*** | 0.0519** | 0.0489*** | 0.0589*** | |||||
| (0.00247) | (0.00352) | (0.00430) | (0.00592) | (0.00124) | (0.00104) | (0.00120) | (0.00107) | (0.0128) | (0.0190) | (0.01772) | (0.0211) | (0.0137) | (0.0211) | (0.0101) | (0.0110) | ||||||
| Constant | 0.419*** | 0.283*** | 0.410*** | 0.549*** | 0.0747*** | 0.0479*** | 0.0738*** | 0.104*** | 4.843*** | 4.282*** | 4.86925*** | 5.383*** | 1.047*** | 0.328** | 1.149*** | 1.777*** | |||||
| Note: Standard errors in parentheses, * p < 0.10, ** p < 0.05, *** p < 0.01 | |||||||||||||||||||||
| Variables | ESG Score | E Score | S Score | G Score | Environmental Activities | Social Activities | Governance Activities | |||||||
| Environmental Innovation | Resource Use | Emission Related | Community | Product Responsibility | Human Rights | Workforce | Management | CSR | Shareholder | |||||
| Corporate Efficiency | + | + | + | + | + | + | + | + | + | + | + | + | ||
| ROA | + | - | + | + | + | + | + | |||||||
| Market Cap | + | + | + | + | + | + | + | + | ||||||
| Profit After Tax | + | + | - | + | + | - | + | + | + | + | ||||
| Note: '+' and '-' symbols represent significant positive and significant negative relationships between ESG and various firm performance parameters. Blank cells represent no significant relationship. | ||||||||||||||
| Disclosure Level | ESG Score | E Score | S Score | G Score | ||||
| Intervals | Coefficients | Intervals | Coefficients | Intervals | Coefficients | Intervals | Coefficients | |
| Intercept | Intercept | 0.4970*** (0.0935) |
Intercept | 0.5416*** (0.0265) |
Intercept | 0.4886*** (0.0655) |
Intercept | 0.3852*** (0.0887) |
| Low level | [0-15] | −0.0024* (0.0068) |
[0-10] | −0.0006** (0.0003) |
[0-10] | 0.0014 (0.0073) |
[0-20] | 0.0090* (0.0046) |
| Lower-middle level | [15-40] | 0.0076 (0.0074) |
[10-90] | 0.0035* (0.0020) |
[10-50] | 0.0015 (0.0076) |
[20-85] | −0.0078* (0.0047) |
| Upper-middle level | [40-90] | 0.0033** (0.0015) |
[50-80] | 0.0024** (0.0011) |
||||
| High level | [90-100] | 0.0235* (0.0139) |
[90-100] | 0.0047 (0.0072) |
[80-100] | 0.0040* (0.0022) |
[85-100] | 0.0053* (0.0031) |
| Note: Standard errors in parentheses, * p < 0.10, ** p < 0.05, *** p < 0.01. | ||||||||
| Variables | (1) Corporate Efficiency | (2) LnProfit | (3) LnProfit | (4) LnMarketcap | (5) LnMarketcap |
| ESG | 0.00221*** (0.000317) |
0.00643*** (0.00179) |
0.00480** (0.00182) |
0.00587*** (0.00167) |
0.00612*** (0.00172) |
| Corporate Efficiency | - | - | 0.735*** (0.186) |
- | −0.114 (0.176) |
| LnCash | 0.0240*** (0.00384) |
0.604*** (0.0217) |
0.586*** (0.0219) |
0.514*** (0.0203) |
0.517*** (0.0207) |
| LnDebt | −0.00943*** (0.00265) |
0.113*** (0.0149) |
0.120*** (0.0149) |
0.0336** (0.0140) |
0.0325** (0.0141) |
| LnR & D | 0.00106 (0.00247) |
0.0544*** (0.0139) |
0.0536*** (0.0138) |
0.129*** (0.0130) |
0.129*** (0.0130) |
| Constant | 0.408*** (0.0204) |
1.030*** (0.115) |
0.730*** (0.137) |
4.707*** (0.108) |
4.754*** (0.129) |
| N | 909 | 909 | 909 | 909 | 909 |
| R2 | 0.139 | 0.719 | 0.724 | 0.688 | 0.688 |
| Indirect Effect | Not Applicable | 0.00163 | Not Applicable | ||
| Direct Effect | 0.00480 | ||||
| Total Effect | 0.00643 | ||||
| Mediated Total Effect | 25.35% | ||||
| Sobel Test z-statistics (p-value) | 3.8931*** (0.0000) | ||||
| Note: Standard errors in parentheses, * p < 0.10, ** p < 0.05, *** p < 0.01 | |||||
| (1) | (2) | (3) | (4) | |
| Variables | Efficiency | ROA | LnProfit | LnMarketcap |
| Panel A: Overall ESG Scores on Firm Performance | ||||
| ESG | 0.00173*** | 0.00015 | 0.00535*** | 0.00326* |
| LnCash | 0.0284*** | 0.0272*** | 0.589*** | 0.451*** |
| LnDebt | −0.0227*** | -0.0215*** | 0.146*** | 0.0383** |
| LnR & D | 0.0152*** | −0.00215 | 0.0411* | 0.177*** |
| Panel B: Individual E, S, and G Scores on Firm Performance | ||||
| E Score | 0.00084*** | −0.00021* | 0.00619*** | 0.00235* |
| S Score | 0.00053* | 0.00027** | −0.00279* | 0.00082 |
| G Score | 0.00056** | 0.00019 | 0.00140 | −0.00228* |
| LnCash | 0.0267*** | 0.0230*** | 0.564*** | 0.426*** |
| LnDebt | −0.0217*** | −0.0179*** | 0.126*** | 0.0405** |
| LnR & D | 0.0131*** | −0.00206 | 0.0563*** | 0.173*** |
| Panel C: Environmental Activities on Firm Performance | ||||
| Environmental Innovation | 0.00023 | 0.00006 | 0.00462*** | 0.00059 |
| Resource Use | 0.00062** | −0.00003 | −0.00308** | 0.00138 |
| Emissions | 0.000371 | 0.0000510 | 0.00407*** | 0.00194 |
| LnCash | 0.0252*** | 0.0218*** | 0.579*** | 0.440*** |
| LnDebt | −0.0180*** | −0.0166*** | 0.125*** | 0.0303* |
| LnR & D | 0.0117*** | −0.00127 | 0.0564*** | 0.182*** |
| Panel D: Social Activities on Firm Performance | ||||
| Community | −0.00021 | 0.00014 | −0.00137 | 0.0008 |
| Product Responsibility | 0.00035* | 0.000002 | −0.00035 | −0.00054 |
| Human Rights | 0.00064*** | 0.00014 | −0.00285** | −0.00164 |
| Workforce | 0.00026 | −0.00014 | 0.00397** | 0.00247* |
| LnCash | 0.0249*** | 0.0242*** | 0.556*** | 0.416*** |
| LnDebt | −0.0167*** | −0.0192*** | 0.143*** | 0.0530*** |
| LnR & D | 0.0118*** | −0.00171 | 0.0613*** | 0.174*** |
| Panel E: Governance Activities on Firm Performance | ||||
| Management | 0.00037* | 0.00010 | 0.00066 | −0.00144 |
| CSR | 0.00084*** | −0.00004 | 0.00382*** | 0.00449*** |
| Shareholder | 0.00008 | 0.00014 | −0.00083 | −0.00117 |
| LnCash | 0.0260*** | 0.0237*** | 0.544*** | 0.419*** |
| LnDebt | −0.0200*** | −0.0190*** | 0.131*** | 0.0220 |
| LnR & D | 0.0137*** | −0.00121 | 0.0534*** | 0.183*** |
| Note: Standard errors in parentheses, * p < 0.10, ** p < 0.05, *** p < 0.01. | ||||