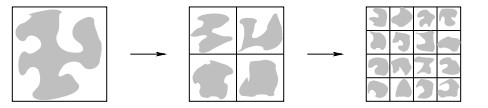
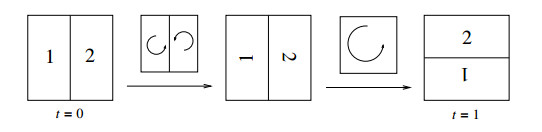
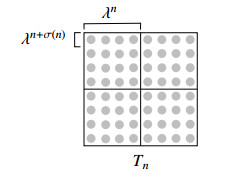
We study the mixing properties of a passive scalar advected by an incompressible flow. We consider a class of cellular flows (more general than the class in [Crippa-Schulze M$ ^3 $AS 2017]) and show that, under the constraint that the palenstrophy is bounded uniformly in time, the mixing scale of the passive scalar cannot decay exponentially.
Citation: Gianluca Crippa, Christian Schulze. Sub-exponential mixing of generalized cellular flows with bounded palenstrophy[J]. Mathematics in Engineering, 2023, 5(1): 1-12. doi: 10.3934/mine.2023006
We study the mixing properties of a passive scalar advected by an incompressible flow. We consider a class of cellular flows (more general than the class in [Crippa-Schulze M$ ^3 $AS 2017]) and show that, under the constraint that the palenstrophy is bounded uniformly in time, the mixing scale of the passive scalar cannot decay exponentially.

| [1] |
G. Alberti, G. Crippa, A. Mazzucato, Exponential self-similar mixing and loss of regularity for continuity equations, C. R. Math., 352 (2014), 901–906. http://dx.doi.org/10.1016/j.crma.2014.08.021 doi: 10.1016/j.crma.2014.08.021

|
| [2] |
G. Alberti, G. Crippa, A. Mazzucato, Exponential self-similar mixing by incompressible flows, J. Amer. Math. Soc., 32 (2019), 445–490. http://dx.doi.org/10.1090/jams/913 doi: 10.1090/jams/913
|
| [3] | A. Bressan, A lemma and a conjecture on the cost of rearrangements, Rend. Sem. Mat. Univ. Padova, 110 (2003), 97–102. |
| [4] |
G. Crippa, C. De Lellis, Estimates and regularity results for the DiPerna Lions flow, J. Reine Angew. Math., 616 (2008), 15–46. http://dx.doi.org/10.1515/CRELLE.2008.016 doi: 10.1515/CRELLE.2008.016
|
| [5] |
G. Crippa, C. Schulze, Cellular mixing with bounded palenstrophy, Math. Models Methods Appl. Sci., 27 (2017), 2297–2320. http://dx.doi.org/10.1142/S0218202517500452 doi: 10.1142/S0218202517500452
|
| [6] |
T. M. Elgindi, A. Zlatoš, Universal mixers in all dimensions, Adv. Math., 356 (2019), 106807. http://dx.doi.org/10.1016/j.aim.2019.106807 doi: 10.1016/j.aim.2019.106807
|
| [7] |
G. Iyer, A. Kiselev, X. Xu, Lower bounds on the mix norm of passive scalars advected by incompressible enstrophy-constrained flows, Nonlinearity, 27 (2014), 973–985. http://dx.doi.org/10.1088/0951-7715/27/5/973 doi: 10.1088/0951-7715/27/5/973
|
| [8] |
Z. Lin, J.-L. Thiffeault, C. R. Doering, Optimal stirring strategies for passive scalar mixing, J. Fluid Mech., 675 (2011), 465–476. http://dx.doi.org/10.1017/S0022112011000292 doi: 10.1017/S0022112011000292
|
| [9] |
E. Lunasin, Z. Lin, A. Novikov, A. Mazzucato, C. R. Doering, Optimal mixing and optimal stirring for fixed energy, fixed power, or fixed palenstrophy flows, J. Math. Phys., 53 (2012), 115611. http://dx.doi.org/10.1063/1.4752098 doi: 10.1063/1.4752098
|
| [10] |
E. Lunasin, Z. Lin, A. Novikov, A. Mazzucato, C. R. Doering, Erratum: Optimal mixing and optimal stirring for fixed energy, fixed power, or fixed palenstrophy flows, J. Math. Phys., 54 (2013), 079903. http://dx.doi.org/10.1063/1.4816334 doi: 10.1063/1.4816334
|
| [11] |
G. Mathew, I. Mezic, L. Petzold, A multiscale measure for mixing, Physica D, 211 (2005), 23–46. http://dx.doi.org/10.1016/j.physd.2005.07.017 doi: 10.1016/j.physd.2005.07.017
|
| [12] |
C. Seis, Maximal mixing by incompressible fluid flows, Nonlinearity, 26 (2013), 3279–3289. http://dx.doi.org/10.1088/0951-7715/26/12/3279 doi: 10.1088/0951-7715/26/12/3279
|
| [13] |
J.-L. Thiffeault, Using multiscale norms to quantify mixing and transport, Nonlinearity, 25 (2012), R1–R44. http://dx.doi.org/10.1088/0951-7715/25/2/R1 doi: 10.1088/0951-7715/25/2/R1
|
| [14] |
Y. Yao, A. Zlatoš, Mixing and un-mixing by incompressible flows, J. Eur. Math. Soc., 19 (2014), 1911–1948. http://dx.doi.org/10.4171/JEMS/709 doi: 10.4171/JEMS/709
|
Figures(3)

Gianluca Crippa, Christian Schulze. Sub-exponential mixing of generalized cellular flows with bounded palenstrophy[J]. Mathematics in Engineering, 2023, 5(1): 1-12. doi: 10.3934/mine.2023006


 DownLoad: