Review

Ground glass hepatocytes provide targets for therapy or prevention of hepatitis B virus-related hepatocellular carcinoma

  • Received: 12 November 2017 Accepted: 08 March 2018 Published: 14 March 2018
  • Ground glass hepatocyte (GGH) represents a histologic hallmark of chronic hepatitis B virus (HBV) infection and is characterized by the accumulation of pre-S mutant surface antigens in the endoplasmic reticulum (ER). In the past decade, GGHs have been recognized as pre-neoplastic lesions of hepatocellular carcinoma (HCC). The accumulation of pre-S mutant protein in ER may induce a misfolded protein response or ER stress signals with activation of VEGF/Akt/mTOR and COX-2/NF-κB signals, leading to oxidative DNA damage, aneuploidy, and genomic instability. Molecular studies revealed clonal HBV DNA integration in type II GGHs which continue to express and secrete surface antigens, representing the sustained surface antigens in the serum after NA antiviral treatment. The persistence of GGHs in the liver after anti-viral therapy not only constitute the challenge to eliminate HBV infection but also carry the high risk to develop HCC. DNA chip and ELISA kit are designing to detect the pre-S mutants in serum. Novel or second generation anti-HBV drugs are under phase II development and include the combination of anti-virals, immunomodulators, agents for host DNA damage, and siRNA to target at the transcription of HBsAg gene in cccDNA or integrated HBV DNA. In the past years, we explored the possibility to provide drugs or natural agents targeting at ER stress signals in GGHs to prevent HCC development. In a transgenic mice model of pre-S mutant and HBx, a combination of silymarin and resveratrol targeting at mTOR and NF-κB signals could reduce a 80% of HCC development. In a pilot clinical trial, liposomal curcumin (Meriva®) combined with anti-virals and immumodulators P1101 have been designed and attempted to eliminate the serum surface antigen and hence the recurrence of HCC after surgical resection. Therefore, the detection of pre-S mutants in serum or GGHs in the liver should provide rational target design for therapy or prevention of HCC in these high risk patients of chronic HBV infection.

    Citation: Hong-Yi Chang, Hung-Wen Tsai, Chiao-Fang Teng, Lily Hui-Ching Wang, Wenya Huang, Ih-Jen Su. Ground glass hepatocytes provide targets for therapy or prevention of hepatitis B virus-related hepatocellular carcinoma[J]. AIMS Medical Science, 2018, 5(2): 90-101. doi: 10.3934/medsci.2018.2.90

    Related Papers:

    [1] Usanee Janthasuwan, Suparat Niwitpong, Sa-Aat Niwitpong . Confidence intervals for coefficient of variation of Delta-Birnbaum-Saunders distribution with application to wind speed data. AIMS Mathematics, 2024, 9(12): 34248-34269. doi: 10.3934/math.20241631
    [2] Hongping Guo, Yuhang Qian, Yiran Zhu, Xinming Dai, Xiao Wang . Confidence intervals for the difference between coefficients of variation of zero-inflated gamma distributions. AIMS Mathematics, 2023, 8(12): 29713-29733. doi: 10.3934/math.20231521
    [3] Ahmed Elshahhat, Refah Alotaibi, Mazen Nassar . Statistical inference of the Birnbaum-Saunders model using adaptive progressively hybrid censored data and its applications. AIMS Mathematics, 2024, 9(5): 11092-11121. doi: 10.3934/math.2024544
    [4] Nasrullah Khan, Gadde Srinivasa Rao, Rehan Ahmad Khan Sherwani, Ali Hussein AL-Marshadi, Muhammad Aslam . Uncertainty-based sampling plans for various statistical distributions. AIMS Mathematics, 2023, 8(6): 14558-14571. doi: 10.3934/math.2023744
    [5] Wael W. Mohammed, Kalpasree Sharma, Partha Jyoti Hazarika, G. G. Hamedani, Mohamed S. Eliwa, Mahmoud El-Morshedy . Zero-inflated discrete Lindley distribution: Statistical and reliability properties, estimation techniques, and goodness-of-fit analysis. AIMS Mathematics, 2025, 10(5): 11382-11410. doi: 10.3934/math.2025518
    [6] Emrah Altun, Hana Alqifari, Mohamed S. Eliwa . A novel approach for zero-inflated count regression model: Zero-inflated Poisson generalized-Lindley linear model with applications. AIMS Mathematics, 2023, 8(10): 23272-23290. doi: 10.3934/math.20231183
    [7] Peihua Jiang, Xilong Yang . Reliability inference and remaining useful life prediction for the doubly accelerated degradation model based on Wiener process. AIMS Mathematics, 2023, 8(3): 7560-7583. doi: 10.3934/math.2023379
    [8] Patchanok Srisuradetchai, Jatuporn Somsamai, Wikanda Phaphan . Modified likelihood approach for Wald-typed interval of the shape parameter in Weibull distribution. AIMS Mathematics, 2025, 10(1): 1-20. doi: 10.3934/math.2025001
    [9] Yichen Lv, Xinping Xiao . Grey parameter estimation method for extreme value distribution of short-term wind speed data. AIMS Mathematics, 2024, 9(3): 6238-6265. doi: 10.3934/math.2024304
    [10] Kamran Sabahi, Chunwei Zhang, Nasreen Kausar, Ardashir Mohammadzadeh, Dragan Pamucar, Amir H. Mosavi . Input-output scaling factors tuning of type-2 fuzzy PID controller using multi-objective optimization technique. AIMS Mathematics, 2023, 8(4): 7917-7932. doi: 10.3934/math.2023399
  • Ground glass hepatocyte (GGH) represents a histologic hallmark of chronic hepatitis B virus (HBV) infection and is characterized by the accumulation of pre-S mutant surface antigens in the endoplasmic reticulum (ER). In the past decade, GGHs have been recognized as pre-neoplastic lesions of hepatocellular carcinoma (HCC). The accumulation of pre-S mutant protein in ER may induce a misfolded protein response or ER stress signals with activation of VEGF/Akt/mTOR and COX-2/NF-κB signals, leading to oxidative DNA damage, aneuploidy, and genomic instability. Molecular studies revealed clonal HBV DNA integration in type II GGHs which continue to express and secrete surface antigens, representing the sustained surface antigens in the serum after NA antiviral treatment. The persistence of GGHs in the liver after anti-viral therapy not only constitute the challenge to eliminate HBV infection but also carry the high risk to develop HCC. DNA chip and ELISA kit are designing to detect the pre-S mutants in serum. Novel or second generation anti-HBV drugs are under phase II development and include the combination of anti-virals, immunomodulators, agents for host DNA damage, and siRNA to target at the transcription of HBsAg gene in cccDNA or integrated HBV DNA. In the past years, we explored the possibility to provide drugs or natural agents targeting at ER stress signals in GGHs to prevent HCC development. In a transgenic mice model of pre-S mutant and HBx, a combination of silymarin and resveratrol targeting at mTOR and NF-κB signals could reduce a 80% of HCC development. In a pilot clinical trial, liposomal curcumin (Meriva®) combined with anti-virals and immumodulators P1101 have been designed and attempted to eliminate the serum surface antigen and hence the recurrence of HCC after surgical resection. Therefore, the detection of pre-S mutants in serum or GGHs in the liver should provide rational target design for therapy or prevention of HCC in these high risk patients of chronic HBV infection.


    In meteorology, wind speed is a fundamental atmospheric quantity caused by the movement of air from high to low pressure, usually due to temperature variations. Alongside wind speed, wind direction plays a pivotal role in the analysis and prediction of weather patterns and the global climate. Wind speed and direction significantly affect factors such as evaporation rates, sea surface turbulence, and the formation of oceanic waves and storms. Moreover, these factors have substantial impacts on water quality, water levels, and various fields, including weather forecasting, climatology, renewable energy, environmental monitoring, aviation, and agriculture. Therefore, a comprehensive understanding of wind speed is important for managing potential impacts. Additionally, using wind speed data for analysis can help researchers and experts understand and address issues related to wind speed across various areas. For wind speed data, a normal distribution may not be appropriate, even though the normal distribution is one of the most widely used statistical distributions. If the data exhibits skewness, it is advisable to consider alternative distributions. Many new distributions have been developed using certain transformations from the normal distribution. One such distribution is the Birnbaum-Saunders distribution. Importantly, Mohammadi, Alavi, and McGowan [1] investigated the application of the two-parameter Birnbaum-Saunders distribution for analyzing wind speed and wind energy density at ten different stations in Canada. Their results demonstrated that the Birnbaum-Saunders distribution was especially effective at all the chosen locations. The Birnbaum-Saunders distribution was introduced by Birnbaum and Saunders [2] for the purpose of modeling the fatigue life of metals subjected to periodic stress. As a result, this distribution is sometimes referred to as the fatigue life distribution. The Birnbaum-Saunders distribution has been applied in various contexts, such as engineering, testing, medical sciences, and environmental studies. It is well known that the Birnbaum-Saunders distribution is a positive skewed one. However, some data to be analyzed may have both positive and zero values. Therefore, if zero observations follow a binomial distribution combined with the Birnbaum-Saunders distribution, the resulting distribution is the zero-inflated Birnbaum-Saunders (ZIBS) distribution, which is a new and interesting distribution. This ZIBS distribution was inspired by Aitchison [3], and several researchers have studied the combination of zero observations with other distributions to form new distributions, such as the zero-inflated lognormal distribution [4], the zero-inflated gamma distribution [5], and the zero-inflated two-parameter exponential distribution [6].

    The coefficient of variation (CV) of wind speed is important for several reasons. Since the CV measures the dispersion of data relative to the mean, it is expressed as the ratio of the standard deviation to the mean. The CV assesses the variability of a dataset, regardless of the unit of measurement. Additionally, using the CV to evaluate wind speed is beneficial in various contexts. For instance, calculating the CV helps in understanding how much wind speed fluctuates compared to its average. If the CV is high, it indicates that the wind speed is highly variable, making it more difficult to predict wind conditions. In the context of wind energy, the CV can help assess the reliability of energy sources. If wind speed variability is high, it may result in inconsistent energy production, which could affect the stability of energy output from wind farms. Additionally, the coefficient of variation has been used in many fields, including life insurance, science, economics, and medicine. Importantly, many researchers have constructed confidence intervals (CIs) for the coefficient of variation, which have been applied to various distributions. For example, Vangel [7] constructed the CIs for a normal distribution coefficient of variation. Buntao and Niwitpong [8] introduced the CIs for the coefficient of variation of zero-inflated lognormal and lognormal distributions. D'Cunha and Rao [9] proposed the Bayes estimator and created CIs for the coefficient of variation of the lognormal distribution. Sangnawakij and Niwitpong [10] developed CIs for coefficients of variation in two-parameter exponential distributions. Janthasuwan, Niwitpong, and Niwitpong [11] established CIs for the coefficients of variation in the zero-inflated Birnbaum-Saunders distribution.

    In the analysis and comparison of wind variability across multiple weather stations or wind directions, without needing to account for the differences in average wind speed at each station or direction, it is necessary to use the common CV. The common CV provides a single indicator representing the overall variability of wind speed, which is crucial when planning wind energy projects, designing wind turbines, or calculating the power production of wind farms that require knowledge of wind stability across different areas. Additionally, the common CV is useful in meteorological and climatological research, as it allows for the analysis of wind variability across multiple regions simultaneously. It can also assist in examining the relationship between wind variability and long-term climate changes or recurring events, such as storms or shifts in wind patterns. Therefore, the common coefficient of variation is a crucial aspect when making inferences for more than one population. This holds particularly true when collecting independent samples from various situations. Consequently, numerous researchers have investigated methods for computing the common coefficient of variation in several populations from variety distributions. For instance, Tian [12] made inferences about the coefficient of variation of a common population within a normal distribution. Then, Forkman [13] studied methods for constructing CIs and statistical tests based on McKay's approximation for the common coefficient of variation in several populations with normal distributions. Sangnawakij and Niwitpong [14] proposed the method of variance of estimate recovery to construct CIs for the common coefficient of variation for several gamma distributions. Next, Singh et al. [15] used several inverse Gaussian populations to estimate the common coefficient of variation, test the homogeneity of the coefficient of variation, and test for a specified value of the common coefficient of variation. After that, Yosboonruang, Niwitpong, and Niwitpong [16] presented methods to construct CIs for the common coefficient of variation of zero-inflated lognormal distributions, employing the method of variance estimate recovery, equal-tailed Bayesian intervals, and the fiducial generalized confidence interval. Finally, Puggard, Niwitpong, and Niwitpong [17] introduced Bayesian credible intervals, highest posterior density intervals, the method of variance estimate recovery, generalized confidence intervals, and large-sample methods to construct confidence intervals for the common coefficient of variation in several Birnbaum-Saunders distributions. Previous research has shown that no studies have investigated the estimation of the common coefficient of variation in the context of several ZIBS distributions. Therefore, the primary objective of this article is to determine the CIs for the common coefficient of variation of several ZIBS distributions. The article presents five distinct methods: the generalized confidence interval, the method of variance estimates recovery, the large sample approximation, the bootstrap confidence interval, and the fiducial generalized confidence interval.

    Let $ {Y}_{ij}, i = \mathrm{1, 2}, \dots, k $ and $ j = \mathrm{1, 2}, \dots, {m}_{i} $ be a random sample drawn from the ZIBS distributions. The density function of $ {Y}_{ij} $ is given by

    $f(yij;ϑi,αi,βi)=ϑiI0[yij]+(1ϑi)12αiβi2π[(βiyij)1/2+(βiyij)3/2]×exp[12(yijβi+βiyij2)]I(0,)[yij],
    $

    where $ {\vartheta }_{i}, {\alpha }_{i} $, and $ {\beta }_{i} $ are the proportion of zero, shape, and scale parameters, respectively. $ \mathrm{{\rm I}} $ is an indicator function, with $ {\mathrm{{\rm I}}}_{0}\left[{y}_{ij}\right] = \left\{1;yij=0,0;otherwise,

    \right. $ and $ {\mathrm{{\rm I}}}_{\left(0, \infty \right)}\left[{y}_{ij}\right] = \left\{0;yij=0,1;yij>0
    \right. $. This distribution is a combination of Birnbaum-Saunders and binomial distributions. Suppose that $ {m}_{i} = {m}_{i\left(1\right)}+{m}_{i\left(0\right)} $ is the sample size, where $ {m}_{i\left(1\right)} $ and $ {m}_{i\left(0\right)} $ are the numbers of positive and zero values, respectively. For the expected value and variance of $ {Y}_{ij} $, we have applied the concepts from Aitchison [3], which can be expressed as follows:

    $ E\left({Y}_{ij}\right) = \left(1-{\vartheta }_{i}\right){\beta }_{i}\left(1+\frac{{\alpha }_{i}^{2}}{2}\right) $

    and

    $ V\left({Y}_{ij}\right) = \left(1-{\vartheta }_{i}\right){\left({\alpha }_{i}{\beta }_{i}\right)}^{2}\left(1+\frac{5{\alpha }_{i}^{2}}{4}\right)+{\vartheta }_{i}\left(1-{\vartheta }_{i}\right){\beta }_{i}^{2}{\left(1+\frac{{\alpha }_{i}^{2}}{2}\right)}^{2}, $

    respectively. Hence, the coefficient of variation of $ {Y}_{ij} $ is defined as

    $ \theta = \frac{1}{2+{\alpha }_{i}^{2}}\sqrt{\frac{{\alpha }_{i}^{2}\left(4+5{\alpha }_{i}^{2}\right)+{\vartheta }_{i}{\left(2+{\alpha }_{i}^{2}\right)}^{2}}{1-{\vartheta }_{i}}}. $

    The asymptotic distribution of $ {\widehat{\vartheta }}_{i} $ is calculated by using the delta method, which is given by $ \sqrt{{m}_{i}}\left({\widehat{\vartheta }}_{i}-{\vartheta }_{i}\right)\sim N\left(0, {\vartheta }_{i}(1-{\vartheta }_{i})\right) $, where $ {\widehat{\vartheta }}_{i} = {m}_{i\left(0\right)}/{m}_{i} $. According to Ng, Kundu, and Balakrishnan [18], the asymptotic joint distribution of $ {\widehat{\alpha }}_{i} $ and $ {\widehat{\beta }}_{i} $ is obtained as

    $ \left(ˆαiˆβi
    \right)\sim N\left(\left(αiβi
    \right), \left(α2i2mi(1)00(αiβi)2mi(1)(1+34α2i(1+12α2i)2)
    \right)\right), $

    where $ {\widehat{\alpha }}_{i} = {\left\{2\left[{\left({\stackrel{-}{y}}_{i}{\sum }_{j = 1}^{{m}_{i\left(1\right)}}\frac{{y}_{ij}^{-1}}{{m}_{i\left(1\right)}}\right)}^{\frac{1}{2}}-1\right]\right\}}^{\frac{1}{2}} $, $ {\widehat{\beta }}_{i} = {\left\{{\stackrel{-}{y}}_{i}{\left({\sum }_{j = 1}^{{m}_{i\left(1\right)}}\frac{{y}_{ij}^{-1}}{{m}_{i\left(1\right)}}\right)}^{-1}\right\}}^{\frac{1}{2}} $, and $ {\stackrel{-}{y}}_{i} = {\sum }_{j = 1}^{{m}_{i\left(1\right)}}\frac{{y}_{ij}}{{m}_{i\left(1\right)}} $. The estimator of $ {\theta }_{i} $ is given by

    $ {\widehat{\theta }}_{i} = \frac{1}{2+{\widehat{\alpha }}_{i}^{2}}\sqrt{\frac{{\widehat{\alpha }}_{i}^{2}\left(4+5{\widehat{\alpha }}_{i}^{2}\right)+{\widehat{\vartheta }}_{i}{\left(2+{\widehat{\alpha }}_{i}^{2}\right)}^{2}}{1-{\widehat{\vartheta }}_{i}}} . $ (1)

    According to Janthasuwan, Niwitpong, and Niwitpong [11], the asymptotic variance of $ {\widehat{\theta }}_{i} $, derived using the Taylor series in the delta method, is given by

    $ V\left({\widehat{\theta }}_{i}\right)\approx \frac{1}{{\varPsi }_{i}}\left\{\frac{32{\alpha }_{i}^{4}{\left(1+2{\alpha }_{i}^{2}\right)}^{2}}{{m}_{i\left(1\right)}{\left(2+{\alpha }_{i}^{2}\right)}^{2}}+\frac{{\vartheta }_{i}{\left[2+{\alpha }_{i}^{2}\left(4+3{\alpha }_{i}^{2}\right)\right]}^{2}}{{m}_{i}\left(1-{\vartheta }_{i}\right)}\right\} , $ (2)

    where $ {\varPsi }_{i} = {\left(2+{\alpha }_{i}^{2}\right)}^{2}\left(1-{\vartheta }_{i}\right)\left[{\alpha }_{i}^{2}\left(4+5{\alpha }_{i}^{2}\right)+{\vartheta }_{i}{\left(2+{\alpha }_{i}^{2}\right)}^{2}\right] $. According to Graybill and Deal [19], the common CV of several ZIBS distributions can be written as

    $ \widehat{\theta } = \frac{{\sum }_{i = 1}^{k}{\widehat{\theta }}_{i}/\widehat{V}\left({\widehat{\theta }}_{i}\right)}{{\sum }_{i = 1}^{k}1/\widehat{V}\left({\widehat{\theta }}_{i}\right)} , $ (3)

    where $ \widehat{V}\left({\widehat{\theta }}_{i}\right) $ denotes the estimator of $ V\left({\widehat{\theta }}_{i}\right) $, which is defined in Eq (2) with $ {\alpha }_{i} $ and $ {\vartheta }_{i} $ replaced by $ {\widehat{\alpha }}_{i} $ and $ {\widehat{\vartheta }}_{i} $, respectively. This can be expressed as follows:

    $ \widehat{V}\left({\widehat{\theta }}_{i}\right)\approx \frac{1}{{\widehat{\varPsi }}_{i}}\left\{\frac{32{\widehat{\alpha }}_{i}^{4}{\left(1+2{\widehat{\alpha }}_{i}^{2}\right)}^{2}}{{m}_{i\left(1\right)}{\left(2+{\widehat{\alpha }}_{i}^{2}\right)}^{2}}+\frac{{\widehat{\vartheta }}_{i}{\left[2+{\widehat{\alpha }}_{i}^{2}\left(4+3{\widehat{\alpha }}_{i}^{2}\right)\right]}^{2}}{{m}_{i}\left(1-{\widehat{\vartheta }}_{i}\right)}\right\}, $

    where $ {\widehat{\varPsi }}_{i} = {\left(2+{\widehat{\alpha }}_{i}^{2}\right)}^{2}\left(1-{\widehat{\vartheta }}_{i}\right)\left[{\widehat{\alpha }}_{i}^{2}\left(4+5{\widehat{\alpha }}_{i}^{2}\right)+{\widehat{\vartheta }}_{i}{\left(2+{\widehat{\alpha }}_{i}^{2}\right)}^{2}\right] $.

    The following subsection provides detailed explanations of the methods employed for constructing confidence intervals.

    Weerahandi [20] recommended the generalized confidence interval (GCI) method for constructing confidence intervals, which is based on the concept of a generalized pivotal quantity (GPQ). To construct the confidence interval for $ \theta $ using the GCI, we get the generalized pivotal quantities for the parameters $ {\beta }_{i} $, $ {\alpha }_{i} $, and $ {\vartheta }_{i} $. Sun [21] introduced the GPQ for the scale parameter $ {\beta }_{i} $, which can be derived as

    $ {G}_{{\beta }_{i}}\left({y}_{ij};{\varLambda }_{i}\right) = \left\{max(βi1,βi2);Λi0;min(βi1,βi2);Λi>0,
    \right. $
    (4)

    where $ {\varLambda }_{i} $ follows the t-distribution with $ {m}_{i\left(1\right)}-1 $ degrees of freedom. $ {\beta }_{i1} $ and $ {\beta }_{i2} $ are the two solutions of the following quadratic equation:

    $ {\varOmega }_{1}{{\beta }_{i}}^{2}-2{\varOmega }_{2}{\beta }_{i}+\left({m}_{i\left(1\right)}-1\right){{C}_{i}}^{2}-\frac{1}{{m}_{i\left(1\right)}}{D}_{i}{\varLambda }_{i}^{2} = 0 , $

    where $ {\varOmega }_{1} = \left({m}_{i\left(1\right)}-1\right){A}_{i}^{2}-\frac{1}{{m}_{i\left(1\right)}}{B}_{i}{\varLambda }_{i}^{2} $, $ {\varOmega }_{2} = \left({m}_{i\left(1\right)}-1\right){A}_{i}{C}_{i}-\left(1-{A}_{i}{C}_{i}\right){\varLambda }_{i}^{2} $, $ {A}_{i} = \frac{1}{{m}_{i\left(1\right)}}{\sum }_{j = 1}^{{m}_{i\left(1\right)}}\frac{1}{\sqrt{{Y}_{ij}}} $, $ {B}_{i} = {{\sum }_{j = 1}^{{m}_{i\left(1\right)}}\left(\frac{1}{\sqrt{{Y}_{ij}}}-{A}_{i}\right)}^{2} $, $ {C}_{i} = \frac{1}{{m}_{i\left(1\right)}}{\sum }_{j = 1}^{{m}_{i\left(1\right)}}\sqrt{{Y}_{ij}} $, and $ {D}_{i} = {\sum }_{j = 1}^{{m}_{i\left(1\right)}}{\left(\sqrt{{Y}_{ij}}-{C}_{i}\right)}^{2} $. Next, considering the GPQ for the shape parameter $ {\alpha }_{i} $ as proposed by Wang [22], the GPQ for $ {\alpha }_{i} $ is derived as

    $ {G}_{{\alpha }_{i}}\left({y}_{ij};{{\rm K}}_{i}, {\varLambda }_{i}\right) = \sqrt{\frac{{E}_{i1}+{E}_{i2}{G}_{{\beta }_{i}}^{2}\left({y}_{ij};{\varLambda }_{i}\right)-2{m}_{i\left(1\right)}{G}_{{\beta }_{i}}\left({y}_{ij};{\varLambda }_{i}\right)}{{G}_{{\beta }_{i}}\left({y}_{ij};{\varLambda }_{i}\right){{\rm K}}_{i}}} , $ (5)

    where $ {E}_{i1} = {\sum }_{j = 1}^{{m}_{i\left(1\right)}}{Y}_{ij} $, $ {E}_{i2} = {\sum }_{j = 1}^{{m}_{i\left(1\right)}}\frac{1}{{Y}_{ij}} $, and $ {{\rm K}}_{i} $ follows the chi-squared distribution with $ {m}_{i\left(1\right)} $ degrees of freedom. Subsequently, the GPQ for the proportion of zero $ {\vartheta }_{i} $ was recommended by Wu and Hsieh [23], who proposed using the GPQ based on the variance stabilized transformation to construct confidence intervals. Therefore, the GPQ for $ {\vartheta }_{i} $ is defined as

    $ {G}_{{\vartheta }_{i}} = {\mathrm{sin}}^{2}\left[\mathrm{arcsin}\sqrt{{\widehat{\vartheta }}_{i}}-\frac{{W}_{i}}{2\sqrt{{m}_{i}}}\right] , $ (6)

    where $ {W}_{i} = 2\sqrt{{m}_{i}}\left(\mathrm{arcsin}\sqrt{{\widehat{\vartheta }}_{i}}-\mathrm{arcsin}\sqrt{{\vartheta }_{i}}\right)\sim N\left(\mathrm{0, 1}\right) $. Now, we can calculate the GPQs for $ {\theta }_{i} $ and the variance of $ {\widehat{\theta }}_{i} $ using Eqs (5) and (6), resulting in

    $ {G}_{{\theta }_{i}} = \frac{1}{2+{G}_{{\alpha }_{i}}^{2}}\sqrt{\frac{{G}_{{\alpha }_{i}}^{2}\left(4+5{G}_{{\alpha }_{i}}^{2}\right)+{G}_{{\vartheta }_{i}}{\left(2+{G}_{{\alpha }_{i}}^{2}\right)}^{2}}{1-{G}_{{\vartheta }_{i}}}} $ (7)

    and

    $ {G}_{V\left({\widehat{\theta }}_{i}\right)} = \frac{1}{{G}_{{\varPsi }_{i}}}\left\{\frac{32{G}_{{\alpha }_{i}}^{4}{\left(1+2{G}_{{\alpha }_{i}}^{2}\right)}^{2}}{{m}_{i\left(1\right)}{\left(2+{G}_{{\alpha }_{i}}^{2}\right)}^{2}}+\frac{{G}_{{\vartheta }_{i}}{\left[2+{G}_{{\alpha }_{i}}^{2}\left(4+3{G}_{{\alpha }_{i}}^{2}\right)\right]}^{2}}{{m}_{i}\left(1-{G}_{{\vartheta }_{i}}\right)}\right\} , $ (8)

    where $ {G}_{{\varPsi }_{i}} = {\left(2+{G}_{{\alpha }_{i}}^{2}\right)}^{2}\left(1-{G}_{{\vartheta }_{i}}\right)\left[{G}_{{\alpha }_{i}}^{2}\left(4+5{G}_{{\alpha }_{i}}^{2}\right)+{G}_{{\vartheta }_{i}}{\left(2+{G}_{{\alpha }_{i}}^{2}\right)}^{2}\right] $. Therefore, the GPQ for $ {\theta }_{i} $ is the weighted average of the GPQ $ {G}_{{\theta }_{i}} $ based on $ k $ individual samples, given by

    $ {G}_{\theta } = \frac{{\sum }_{i = 1}^{k}{G}_{{\theta }_{i}}/{G}_{V\left({\widehat{\theta }}_{i}\right)}}{{\sum }_{i = 1}^{k}1/{G}_{V\left({\widehat{\theta }}_{i}\right)}} . $ (9)

    Then, the $ \left(1-\rho \right)100\% $ CI for the common CV of several ZIBS distributions employing the GCI method is given by

    $ \left[{L}_{GCI}, {U}_{GCI}\right] = \left[{G}_{\theta }\left(\rho /2\right), {G}_{\theta }\left(1-\rho /2\right)\right] , $ (10)

    where $ {G}_{\theta }\left(\rho /2\right) $ and $ {G}_{\theta }\left(1-\rho /2\right) $ denote the $ 100\left(\rho /2\right)\mathrm{t}\mathrm{h} $ and $ 100\left(1-\rho /2\right)\mathrm{t}\mathrm{h} $ percentiles of $ {G}_{\theta } $, respectively.

    Algorithm 1 is used to construct the GCI for the common coefficient of variation of several ZIBS distributions.

    Algorithm 1.

         For $ g = 1 $ to $ n $, where $ n $ is the number of generalized computations:

        1) Compute $ {A}_{i}, {B}_{i}, {C}_{i}, {D}_{i}, {E}_{i1} $, and $ {E}_{i2} $.

        2) At the $ p $ step:

            a) Generate $ {\varLambda }_{i}\sim t\left({m}_{i\left(1\right)}-1\right) $, and then compute $ {G}_{{\beta }_{i}}\left({y}_{ij}; {\varLambda }_{i}\right) $ from Eq (4);

            b) If $ {G}_{{\beta }_{i}}\left({y}_{ij}; {\varLambda }_{i}\right) < 0, $ regenerate $ {\varLambda }_{i}\sim t\left({m}_{i\left(1\right)}-1\right) $;

            c) Generate $ {{\rm K}}_{i}\sim{\chi }_{{m}_{i\left(1\right)}}^{2} $, and then compute $ {G}_{{\alpha }_{i}}\left({y}_{ij}; {K}_{i}, {\varLambda }_{i}\right) $ from Eq (5);

            d) Compute $ {G}_{{\vartheta }_{i}} $, $ {G}_{{\theta }_{i}} $, and $ {G}_{V\left({\widehat{\theta }}_{i}\right)} $ from Eqs (6)–(8), respectively;

            e) Compute $ {G}_{\theta } $ from Eq (9).

         End $ g $ loop.

        3) Repeat step 2, a total of G times;

        4) Compute $ {L}_{GCI} $ and $ {U}_{GCI} $ from Eq (10).

    The method of variance estimates recovery (MOVER) estimates a closed-form confidence interval. Let $ {\widehat{\omega }}_{i} $ be an unbiased estimator of $ {\omega }_{i} $. Furthermore, let $ \left[{l}_{i}, {u}_{i}\right] $ represent the $ \left(1-\rho \right)100\% $ confidence interval for $ {\omega }_{i}, i = \mathrm{1, 2}, ..., k $. Assume that $ {\sum }_{i = 1}^{k}{c}_{i}{\omega }_{i} $ is a linear combination of the parameters $ {\omega }_{i} $, where $ {c}_{i} $ are constants. According to Zou, Huang, and Zhang [24], the lower and upper limits of the confidence interval for $ {\sum }_{i = 1}^{k}{c}_{i}{\omega }_{i} $ are defined by

    $ L = \sum\limits_{i = 1}^{k}{c}_{i}{\widehat{\omega }}_{i}-\sqrt{\sum\limits_{i = 1}^{k}{\left[{c}_{i}{\widehat{\omega }}_{i}-\mathrm{min}\left({c}_{i}{l}_{i}, {c}_{i}{u}_{i}\right)\right]}^{2}} $

    and

    $ U = {\sum }_{i = 1}^{k}{c}_{i}{\widehat{\omega }}_{i}+\sqrt{{\sum }_{i = 1}^{k}{\left[{c}_{i}{\widehat{\omega }}_{i}-\mathrm{max}\left({c}_{i}{l}_{i}, {c}_{i}{u}_{i}\right)\right]}^{2}} . $

    Considering Eq (7), the $ \left(1-\rho \right)100\% $ CI for $ {\theta }_{i} $ based on the GPQs has become

    $ \left[{l}_{i}, {u}_{i}\right] = \left[{G}_{{\theta }_{i}}\left(\rho /2\right), {G}_{{\theta }_{i}}\left(1-\rho /2\right)\right] , $ (11)

    where $ {G}_{{\theta }_{i}}\left(\rho /2\right) $ and $ {G}_{{\theta }_{i}}\left(1-\rho /2\right) $ represent the $ 100\left(\rho /2\right)\mathrm{t}\mathrm{h} $ and $ 100\left(1-\rho /2\right)\mathrm{t}\mathrm{h} $ percentiles of $ {G}_{{\theta }_{i}} $, respectively. Hence, the $ \left(1-\rho \right)100\% $ CI for the common CV of several ZIBS distributions employing the MOVER method is given by

    $ {L}_{MOVER} = {\sum }_{i = 1}^{k}{c}_{i}^{\#}{\widehat{\theta }}_{i}-\sqrt{{\sum }_{i = 1}^{k}{\left[{c}_{i}^{\#}{\widehat{\theta }}_{i}-min\left({c}_{i}^{\#}{l}_{i}, {c}_{i}^{\#}{u}_{i}\right)\right]}^{2}} $ (12)

    and

    $ {U}_{MOVER} = {\sum }_{i = 1}^{k}{c}_{i}^{\#}{\widehat{\theta }}_{i}+\sqrt{{\sum }_{i = 1}^{k}{\left[{c}_{i}^{\#}{\widehat{\theta }}_{i}-max\left({c}_{i}^{\#}{l}_{i}, {c}_{i}^{\#}{u}_{i}\right)\right]}^{2}} , $ (13)

    where $ {c}_{i}^{\#} = \frac{{\eta }_{i}}{{\sum }_{j = 1}^{k}{\eta }_{j}} $ and $ {\eta }_{i} = \frac{1}{\widehat{V}\left({\widehat{\theta }}_{i}\right)} $.

    Algorithm 2 is used to construct the MOVER for the common coefficient of variation of several ZIBS distributions.

    Algorithm 2.

        1)  Compute $ {\widehat{\alpha }}_{i} $ and $ {\widehat{\vartheta }}_{i} $;

        2)  Compute $ {\widehat{\theta }}_{i} $ and $ \widehat{V}\left({\widehat{\theta }}_{i}\right) $;

        3)  Compute $ {l}_{i} $ and $ {u}_{i} $ from Eq (11);

        4)  Compute $ {L}_{MOVER} $ from Eq (12);

        5)  Compute $ {U}_{MOVER} $ from Eq (13).

    Recall that the estimator of $ {\theta }_{i} $ from Eq (1) is

    $ {\widehat{\theta }}_{i} = \frac{1}{2+{\widehat{\alpha }}_{i}^{2}}\sqrt{\frac{{\widehat{\alpha }}_{i}^{2}\left(4+5{\widehat{\alpha }}_{i}^{2}\right)+{\widehat{\vartheta }}_{i}{\left(2+{\widehat{\alpha }}_{i}^{2}\right)}^{2}}{1-{\widehat{\vartheta }}_{i}}}, $

    and the estimated variance of $ {\hat \theta _i} $ is

    $ \widehat{V}\left({\widehat{\theta }}_{i}\right)\approx \frac{1}{{\widehat{\varPsi }}_{i}}\left\{\frac{32{\widehat{\alpha }}_{i}^{4}{\left(1+2{\widehat{\alpha }}_{i}^{2}\right)}^{2}}{{m}_{i\left(1\right)}{\left(2+{\widehat{\alpha }}_{i}^{2}\right)}^{2}}+\frac{{\widehat{\vartheta }}_{i}{\left[2+{\widehat{\alpha }}_{i}^{2}\left(4+3{\widehat{\alpha }}_{i}^{2}\right)\right]}^{2}}{{m}_{i}\left(1-{\widehat{\vartheta }}_{i}\right)}\right\}, $

    where $ {\widehat{\varPsi }}_{i} = {\left(2+{\widehat{\alpha }}_{i}^{2}\right)}^{2}\left(1-{\widehat{\vartheta }}_{i}\right)\left[{\widehat{\alpha }}_{i}^{2}\left(4+5{\widehat{\alpha }}_{i}^{2}\right)+{\widehat{\vartheta }}_{i}{\left(2+{\widehat{\alpha }}_{i}^{2}\right)}^{2}\right] $. The large sample (LS) estimate of the CV for the ZIBS distribution is a pooled estimate, as described in Eq (3). Accordingly, the $ \left(1-\rho \right)100\% $ CI for the common CV of several ZIBS distributions employing the LS method is as follows:

    $ \left[{L}_{LS}, {U}_{LS}\right] = \left[\widehat{\theta }-{z}_{1-\frac{\rho }{2}}\sqrt{\frac{1}{{\sum }_{i = 1}^{k}{\eta }_{i}}}, \widehat{\theta }+{z}_{1-\frac{\rho }{2}}\sqrt{\frac{1}{{\sum }_{i = 1}^{k}{\eta }_{i}}}\right] , $ (14)

    where $ {\eta }_{i} = \frac{1}{\widehat{V}\left({\widehat{\theta }}_{i}\right)} $.

    Algorithm 3 is used to construct the LS for the common coefficient of variation of several ZIBS distributions.

    Algorithm 3.

        1)     Compute $ {\widehat{\alpha }}_{i} $ and $ {\widehat{\vartheta }}_{i} $;

        2)     Compute $ {\widehat{\theta }}_{i} $ and $ \widehat{V}\left({\widehat{\theta }}_{i}\right) $;

        3)     Compute $ {L}_{LS} $ and $ {U}_{LS} $ from Eq (14).

    Efron [25] introduced the bootstrap method, which involves repeated resampling of existing data. According to Lemonte, Simas, and Cribari-Neto [26], the constant-bias-correcting parametric bootstrap is the most efficient method for reducing bias. As a result, we used it to estimate the confidence interval for $ \theta $. Assuming that there are $ D $ bootstrap samples available, the $ {\widehat{\alpha }}_{i} $ series for those samples can be computed, which is shown as $ {\widehat{\alpha }}_{i1}^{\#}, {\widehat{\alpha }}_{i2}^{\#}, ..., {\widehat{\alpha }}_{iD}^{\#} $. Here, $ {\widehat{\alpha }}_{ir}^{\#} $ is a sequence of the bootstrap maximum likelihood estimation (MLE) of $ {\alpha }_{ir} $ for $ i = \mathrm{1, 2}, ..., k $ and $ r = \mathrm{1, 2}, ..., D $. The MLE of $ {\alpha }_{ir} $ can be calculated using the Broyden-Fletcher-Goldfarb-Shanno (BFGS) quasi-Newton nonlinear optimization algorithm. The bias of the estimator $ {\alpha }_{i} $ is defined as

    $ D\left({\widehat{\alpha }}_{i}, {\alpha }_{i}\right) = E\left({\widehat{\alpha }}_{i}\right)-{\alpha }_{i} , $

    and then the bootstrap expectation $ E\left({\widehat{\alpha }}_{i}\right) $ could be approximated using the mean $ {\widehat{\alpha }}_{i}^{/} = \frac{1}{D}{\sum }_{r = 1}^{D}{\widehat{\alpha }}_{ir}^{\#} $. As a result, the bootstrap bias estimate for $ D $ replications of $ {\widehat{\alpha }}_{i} $ is derived as $ \widehat{D}\left({\widehat{\alpha }}_{i}, {\alpha }_{i}\right) = {\widehat{\alpha }}_{i}^{/}-{\widehat{\alpha }}_{i} $. According to Mackinnon and Smith [27], the corrected estimate for $ {\widehat{\alpha }}_{i}^{\#} $ is obtained by applying the bootstrap bias estimate, which is

    $ {\widehat{\alpha }}_{i}^{*} = {{\widehat{\alpha }}^{\#}}_{i}-2\widehat{D}\left({\widehat{\alpha }}_{i}, {\alpha }_{i}\right) . $ (15)

    Let $ {\widehat{\vartheta }}_{i}^{\#} $ be observed values of $ {\widehat{\vartheta }}_{i} $ based on bootstrap samples. In accordance with Brown, Cai, and DasGupta [28], the bootstrap estimator of $ {\vartheta }_{i} $ is given by

    $ {\widehat{\vartheta }}_{i}^{*}\sim beta\left({m}_{i}{\widehat{\vartheta }}_{i}^{\#}+\frac{1}{2}, {m}_{i}\left(1-{\widehat{\vartheta }}_{i}^{\#}\right)+\frac{1}{2}\right) . $ (16)

    By using Eqs (15) and (16), the bootstrap estimators of $ {\theta _i} $ and the variance of $ {\widehat{\theta }}_{i} $ can be written as

    $ {\widehat{\theta }}_{i}^{*} = \frac{1}{2+{\left({\widehat{\alpha }}_{i}^{*}\right)}^{2}}\sqrt{\frac{{\left({\widehat{\alpha }}_{i}^{*}\right)}^{2}\left(4+5{\left({\widehat{\alpha }}_{i}^{*}\right)}^{2}\right)+{\widehat{\vartheta }}_{i}^{*}{\left(2+{\left({\widehat{\alpha }}_{i}^{*}\right)}^{2}\right)}^{2}}{1-{\widehat{\vartheta }}_{i}^{*}}} $ (17)

    and

    $ {\widehat{V}}^{*}\left({\widehat{\theta }}_{i}\right)\approx \frac{1}{{\widehat{\varPsi }}_{i}^{*}}\left\{\frac{32{\left({\widehat{\alpha }}_{i}^{*}\right)}^{4}{\left(1+2{\left({\widehat{\alpha }}_{i}^{*}\right)}^{2}\right)}^{2}}{{m}_{i\left(1\right)}{\left(2+{\left({\widehat{\alpha }}_{i}^{*}\right)}^{2}\right)}^{2}}+\frac{{\widehat{\vartheta }}_{i}^{*}{\left[2+{\left({\widehat{\alpha }}_{i}^{*}\right)}^{2}\left(4+3{\left({\widehat{\alpha }}_{i}^{*}\right)}^{2}\right)\right]}^{2}}{{m}_{i}\left(1-{\widehat{\vartheta }}_{i}^{*}\right)}\right\} , $ (18)

    where $ {\widehat{\varPsi }}_{i}^{*} = {\left(2+{\left({\widehat{\alpha }}_{i}^{*}\right)}^{2}\right)}^{2}\left(1-{\widehat{\vartheta }}_{i}^{*}\right)\left[{\left({\widehat{\alpha }}_{i}^{*}\right)}^{2}\left(4+5{\left({\widehat{\alpha }}_{i}^{*}\right)}^{2}\right)+{\widehat{\vartheta }}_{i}^{*}{\left(2+{\left({\widehat{\alpha }}_{i}^{*}\right)}^{2}\right)}^{2}\right] $. Now, the common $ \theta $ based on $ k $ individual sample is obtained by

    $ {\widehat{\theta }}^{*} = \frac{{\sum }_{i = 1}^{k}{\widehat{\theta }}_{i}^{*}/{\widehat{V}}^{*}\left({\widehat{\theta }}_{i}\right)}{{\sum }_{i = 1}^{k}1/{\widehat{V}}^{*}\left({\widehat{\theta }}_{i}\right)}. $ (19)

    Consequently, the $ \left(1-\rho \right)100\% $ CI for the common CV of several ZIBS distributions employing the bootstrap confidence interval (BCI) method is provided by

    $ \left[{L}_{BCI}, {U}_{BCI}\right] = \left[{\widehat{\theta }}^{*}\left(\rho /2\right), {\widehat{\theta }}^{*}\left(1-\rho /2\right)\right] , $ (20)

    where $ {\widehat{\theta }}^{*}\left(\rho /2\right) $ and $ {\widehat{\theta }}^{*}\left(1-\rho /2\right) $ denote the $ 100\left(\rho /2\right)\mathrm{t}\mathrm{h} $ and $ 100\left(1-\rho /2\right)\mathrm{t}\mathrm{h} $ percentiles of $ {\widehat{\theta }}^{*} $, respectively.

    Algorithm 4 is used to construct the BCI for the common coefficient of variation of several ZIBS distributions.

    Algorithm 4.

         For $ b = 1 $ to $ n $ :

        1) At the $ q $ step:

              Fa) Generate $ {y}_{ij}^{*} $, with replacement from $ {y}_{ij} $ where $ i = \mathrm{1, 2}, ..., k $ and $ j = \mathrm{1, 2}, ..., {m}_{i} $;

              b) Compute $ {\widehat{\alpha }}_{i}^{/} $ and $ \widehat{D}\left({\widehat{\alpha }}_{i}, {\alpha }_{i}\right) $;

              c) Compute $ {\widehat{\alpha }}_{i}^{*} $ from Eq (15);

              d) Generate $ {\widehat{\vartheta }}_{i}^{*} $ from Eq (16);

              e) Compute $ {\widehat{\theta }}_{i}^{*} $ from Eq (17);

              f) Compute $ {\widehat{V}}^{*}\left({\widehat{\theta }}_{i}\right) $ from Eq (18);

              g) Compute $ {\widehat{\theta }}^{*} $ from Eq (19).

         End $ b $ loop.

        2) Repeat step 1, a total of B times;

        3) Compute $ {L}_{BCI} $ and $ {U}_{BCI} $ from Eq (20).

    Hannig [29] and Hannig [30] introduced the concept of the generalized fiducial distribution by assuming a functional relationship $ {R}_{j} = {Q}_{j}\left(\delta, \boldsymbol{U}\right) $ for $ j = \mathrm{1, 2}, ..., m $, where $ \boldsymbol{Q} = \left({Q}_{1}, ..., {Q}_{m}\right) $ are the structural equations. Then, assume that $ \boldsymbol{U} = \left({U}_{1}, ..., {U}_{m}\right) $ are independent and identically distributed samples from a uniform distribution $ U\left(\mathrm{0, 1}\right) $ and that the parameter $ \delta \in \mathrm{\Xi }\subseteq {R}^{p} $ is $ p $ -dimensional. Consequently, the generalized fiducial distribution is absolutely continuous with a density

    $ \psi \left(\delta \right) = \frac{J\left(r, \delta \right)L\left(r, \delta \right)}{{\int }_{\Xi }J\left(r, {\delta }^{\text{'}}\right)L\left(r, {\delta }^{\text{'}}\right)d{\delta }^{\text{'}}} , $ (21)

    where $ L\left(\boldsymbol{r}, \boldsymbol{\delta }\right) $ represents the joint likelihood function of the observed data and

    $ J\left(r, \delta \right) = \sum\limits_{j=(j1,...,jp)1ji<...<jpm
    }\left|{\mathrm{det}\left({\left(\frac{d}{dr}{\boldsymbol{Q}}^{-1}\left(r, \delta \right)\right)}^{-1}\frac{d}{d\delta }{\boldsymbol{Q}}^{-1}\left(r, \delta \right)\right)}_{j}\right|, $

    where $ \frac{d}{dr}{\boldsymbol{Q}}^{-1}\left(r, \delta \right) $ and $ \frac{d}{d\delta }{\boldsymbol{Q}}^{-1}\left(r, \delta \right) $ are $ m\times p $ and $ m\times m $ Jacobian matrices, respectively. In addition, Hannig [29] deduced that if the sample $ r $ was independently and identically distributed from an absolutely continuous distribution with cumulative distribution function $ {F}_{\delta }\left(r\right) $, then $ {\boldsymbol{Q}}^{-1} = \left({F}_{\delta }\left({R}_{1}\right), ..., {F}_{\delta }\left({R}_{m}\right)\right) $. Let $ {Z}_{ij}, i = \mathrm{1, 2}, ..., k, j = \mathrm{1, 2}, ..., {m}_{i\left(1\right)} $, be a random sample drawn from the Birnbaum-Saunders distribution. The likelihood function can be written as

    $ L\left({z}_{ij}\left|{\alpha }_{i}, {\beta }_{i}\right.\right)\propto \frac{1}{{\alpha }_{i}^{{m}_{i\left(1\right)}}{\beta }_{i}^{{m}_{i\left(1\right)}}}{\prod }_{j = 1}^{{m}_{i\left(1\right)}}\left[{\left(\frac{{\beta }_{i}}{{z}_{ij}}\right)}^{\frac{1}{2}}+{\left(\frac{{\beta }_{i}}{{z}_{ij}}\right)}^{\frac{3}{2}}\right]exp\left[-\frac{1}{2{\alpha }_{i}^{2}}{\sum }_{j = 1}^{{m}_{i\left(1\right)}}\left(\frac{{z}_{ij}}{{\beta }_{i}}+\frac{{\beta }_{i}}{{z}_{ij}}-2\right)\right] . $

    Therefore, from Eq (20), the generalized fiducial distribution of $ \left({\alpha }_{i}, {\beta }_{i}\right) $ is

    $ p\left({\alpha }_{i}, {\beta }_{i}\left|{z}_{ij}\right.\right)\propto J\left({z}_{ij}, \left({\alpha }_{i}, {\beta }_{i}\right)\right)L\left({z}_{ij}\left|{\alpha }_{i}, {\beta }_{i}\right.\right) , $

    where

    $ J\left({z}_{ij}, \left({\alpha }_{i}, {\beta }_{i}\right)\right) = \sum\limits_{1\le j < l\le {m}_{i\left(1\right)}}\frac{4\left|{z}_{ij}-{z}_{il}\right|}{{\alpha }_{i}\left(1+{\beta }_{i}/{z}_{ij}\right)\left(1+{\beta }_{i}/{z}_{il}\right)} $

    as obtained by Li and Xu [31]. Let $ {\alpha }_{i}^{\#} $ and $ {\beta }_{i}^{\#} $ be the generalized fiducial samples for $ {\alpha }_{i} $ and $ {\beta }_{i} $, respectively. According to Li and Xu [31], the adaptive rejection Metropolis sampling (ARMS) method was used to obtain the fiducial estimates of $ {\alpha }_{i} $ and $ {\beta }_{i} $ from the generalized fiducial distribution. Thus, the calculation of $ {\alpha }_{i}^{\#} $ and $ {\beta }_{i}^{\#} $ can be implemented using the function arms in the package dlm of R software. Additionally, Hannig [29] recommended methods for estimating the fiducial generalized pivotal quantities for binomial proportion $ {\vartheta }_{i} $, with simulation results indicating that the best option is the mixture distribution of two beta distributions with weight ½, which is

    $ {\vartheta }_{i}^{\#}\sim \frac{1}{2}beta\left({m}_{i\left(0\right)}, {m}_{i\left(1\right)}+1\right)+\frac{1}{2}beta\left({m}_{i\left(0\right)}+1, {m}_{i\left(1\right)}\right) . $ (22)

    Currently, the approximate fiducial generalized pivotal quantities for $ {\theta }_{i} $ and the variance of $ {\widehat{\theta }}_{i} $ can be computed by

    $ {\theta }_{i}^{\#} = \frac{1}{2+{\left({\alpha }_{i}^{\#}\right)}^{2}}\sqrt{\frac{{\left({\alpha }_{i}^{\#}\right)}^{2}\left(4+5{\left({\alpha }_{i}^{\#}\right)}^{2}\right)+{\vartheta }_{i}^{\#}{\left(2+{\left({\alpha }_{i}^{\#}\right)}^{2}\right)}^{2}}{1-{\vartheta }_{i}^{\#}}} , $ (23)

    and

    $ {V}^{\#}\left({\widehat{\theta }}_{i}\right)\approx \frac{1}{{\varPsi }_{i}^{\#}}\left\{\frac{32{\left({\alpha }_{i}^{\#}\right)}^{4}{\left(1+2{\left({\alpha }_{i}^{\#}\right)}^{2}\right)}^{2}}{{m}_{i\left(1\right)}{\left(2+{\left({\alpha }_{i}^{\#}\right)}^{2}\right)}^{2}}+\frac{{\vartheta }_{i}^{\#}{\left[2+{\left({\alpha }_{i}^{\#}\right)}^{2}\left(4+3{\left({\alpha }_{i}^{\#}\right)}^{2}\right)\right]}^{2}}{{m}_{i}\left(1-{\vartheta }_{i}^{\#}\right)}\right\} , $ (24)

    where $ {\varPsi }_{i}^{\#} = {\left(2+{\left({\alpha }_{i}^{\#}\right)}^{2}\right)}^{2}\left(1-{\vartheta }_{i}^{\#}\right)\left[{\left({\alpha }_{i}^{\#}\right)}^{2}\left(4+5{\left({\alpha }_{i}^{\#}\right)}^{2}\right)+{\vartheta }_{i}^{\#}{\left(2+{\left({\alpha }_{i}^{\#}\right)}^{2}\right)}^{2}\right] $. As a result, the common $ \theta $ based on $ k $ individual samples is calculated as

    $ {\theta }^{\#} = \frac{{\sum }_{i = 1}^{k}{\theta }_{i}^{\#}/{V}^{\#}\left({\widehat{\theta }}_{i}\right)}{{\sum }_{i = 1}^{k}1/{V}^{\#}\left({\widehat{\theta }}_{i}\right)} . $ (25)

    The $ \left(1-\rho \right)100\% $ confidence interval for the common CV of several ZIBS distributions employing the fiducial generalized confidence interval (FGCI) method is obtained by

    $ \left[{L}_{FGCI}, {U}_{FGCI}\right] = \left[{\theta }^{\#}\left(\rho /2\right), {\theta }^{\#}\left(1-\rho /2\right)\right] , $ (26)

    where $ {\theta }^{\#}\left(\rho /2\right) $ and $ {\theta }^{\#}\left(1-\rho /2\right) $ denote the $ 100\left(\rho /2\right)\mathrm{t}\mathrm{h} $ and $ 100\left(1-\rho /2\right)\mathrm{t}\mathrm{h} $ percentiles of $ {\theta }^{\#} $, respectively.

    The algorithm 5 is used to construct the FGCI for the common coefficient of variation of several ZIBS distributions.

    Algorithm 5.

         For $ g = 1 $ to $ n $ :

        1) Generate $ G $ samples of $ {\alpha }_{i} $ and $ {\beta }_{i} $ by using the arms function in the dlm package of R software;

        2) Burn-in $ F $ samples (the number of remaining samples is $ G-F $);

        3) Thin the samples by applying sampling lag $ L > 1 $, and the final number of samples is $ {G}^{\text{'}} = \left(G-F\right)/L $. Because the generated samples are not independent, we must reduce the autocorrelation by thinning them;

        4) Generate $ {\vartheta }_{i}^{\#} $ from Eq (22);

        5) Compute $ {\theta }_{i}^{\#} $ and $ {V}^{\#}\left({\widehat{\theta }}_{i}\right) $ from Eqs (23) and (24), respectively;

        6) Compute $ {\theta }^{\#} $ from Eq (25);

    End $ g $ loop.

        7) Repeat steps 1–6, a total of $ G $ times;

        8) Compute $ {L}_{FGCI} $ and $ {U}_{FGCI} $ from Eq (26).

    To evaluate the performance of the proposed methods, Monte Carlo simulations in R software were conducted under various scenarios using different sample sizes, proportions of zeros, and shape parameters, as shown in Table 1. The scale parameter was consistently fixed at 1.0 in all scenarios. In generating a simulation, we set the total number of replications to 1000 replicates, 3000 replications for the GCI and FGCI, and 500 replications for the BCI. The performance comparison was based on a coverage probability (CP) greater than or equal to the nominal confidence level of 0.95, as well as the narrowest average width (AW). Algorithm 6 shows the computational steps to estimate the coverage probability and average width performances of all the methods.

    Table 1.  Parameter settings for k = 3, 5, 10.
    Scenarios $ \left({m}_{1}, ..., {m}_{k}\right) $ $ \left({\alpha }_{1}, {\alpha }_{2}, ..., {\alpha }_{k}\right) $ $ \left({\vartheta }_{1}, {\vartheta }_{2}, ..., {\vartheta }_{k}\right) $
    k = 3
    1–12 (303) (2.03), (2.53), (3.03) (0.13), (0.1, 0.3, 0.5), (0.33), (0.53)
    13–24 (30, 50,100) (2.03), (2.53), (3.03) (0.13), (0.1, 0.3, 0.5), (0.33), (0.53)
    25–36 (503) (2.03), (2.53), (3.03) (0.13), (0.1, 0.3, 0.5), (0.33), (0.53)
    37–48 (1003) (2.03), (2.53), (3.03) (0.13), (0.1, 0.3, 0.5), (0.33), (0.53)
    k = 5
    49–60 (303, 502) (2.05), (2.55), (3.05) (0.15), (0.12, 0.32, 0.5), (0.35), (0.55)
    61–72 (302, 502, 100) (2.05), (2.55), (3.05) (0.15), (0.12, 0.32, 0.5), (0.35), (0.55)
    73–84 (30, 502, 1002) (2.05), (2.55), (3.05) (0.15), (0.12, 0.32, 0.5), (0.35), (0.55)
    85–96 (503, 1002) (2.05), (2.55), (3.05) (0.15), (0.12, 0.32, 0.5), (0.35), (0.55)
    k = 10
    97–108 (305, 505) (2.010), (2.510), (3.010) (0.110), (0.15, 0.33, 0.52), (0.310), (0.510)
    109–120 (305, 503, 1002) (2.010), (2.510), (3.010) (0.110), (0.15, 0.33, 0.52), (0.310), (0.510)
    121–132 (506, 1004) (2.010), (2.510), (3.010) (0.110), (0.15, 0.33, 0.52), (0.310), (0.510)
    133–144 (10010) (2.010), (2.510), (3.010) (0.110), (0.15, 0.33, 0.52), (0.310), (0.510)
    *Note: (303) stands for (30, 30, 30).

     | Show Table
    DownLoad: CSV

    The simulation results for k = 3 are shown in Table 2 and Figure 1. The coverage probabilities of the confidence intervals for the GCI method are greater than the nominal confidence level of 0.95 in almost all scenarios, while the coverage probabilities for the MOVER method are close to the specified coverage probability value when proportions of zeros equal 0.13. For the BCI method, they are close to the target, especially when the sample size is large. For the LS and FGCI methods, they provide coverage probability values lower than 0.95 in all scenarios. In terms of average width, the LS and MOVER methods have narrower confidence intervals than other methods in most scenarios. However, the coverage probabilities of both confidence intervals are less than 0.95 in almost all scenarios, so they do not meet the requirements. Among the remaining methods, the GCI method has the shortest average width in all scenarios studied, while the BCI method has the widest.

    Table 2.  Performance measures of the 95% confidence intervals for the common CV; k = 3.
    Scenarios Coverage probability Average width
    GCI MOVER LS BCI FGCI GCI MOVER LS BCI FGCI
    1 0.960 0.954 0.898 0.943 0.941 0.3124 0.2772 0.2826 0.3127 0.3190
    2 0.956 0.931 0.866 0.934 0.937 0.4539 0.3607 0.3706 0.4235 0.4313
    3 0.964 0.941 0.857 0.935 0.920 0.4097 0.3738 0.3921 0.4678 0.4459
    4 0.975 0.920 0.786 0.923 0.909 0.6208 0.5442 0.5843 0.7380 0.6854
    5 0.952 0.952 0.864 0.948 0.931 0.2648 0.2344 0.2354 0.2779 0.2756
    6 0.968 0.947 0.818 0.933 0.928 0.4445 0.3103 0.3108 0.4040 0.4133
    7 0.968 0.935 0.797 0.953 0.923 0.3517 0.3257 0.3325 0.4519 0.4129
    8 0.987 0.908 0.747 0.943 0.910 0.5304 0.4918 0.5044 0.7448 0.6674
    9 0.965 0.953 0.865 0.950 0.929 0.2193 0.1965 0.1938 0.2527 0.2407
    10 0.967 0.907 0.758 0.943 0.926 0.4259 0.2698 0.2620 0.3955 0.3937
    11 0.976 0.922 0.715 0.937 0.901 0.2917 0.2885 0.2770 0.4365 0.3813
    12 0.982 0.911 0.682 0.945 0.910 0.4374 0.4473 0.4247 0.7475 0.6405
    13 0.960 0.953 0.900 0.942 0.937 0.2055 0.1927 0.1977 0.2176 0.2136
    14 0.956 0.926 0.886 0.938 0.917 0.2770 0.2877 0.2998 0.3452 0.3159
    15 0.965 0.936 0.863 0.941 0.920 0.2647 0.2590 0.2761 0.3312 0.3012
    16 0.965 0.925 0.843 0.941 0.902 0.3964 0.3780 0.4159 0.5280 0.4647
    17 0.957 0.944 0.898 0.945 0.934 0.1730 0.1618 0.1647 0.1950 0.1849
    18 0.953 0.906 0.811 0.939 0.902 0.2519 0.2507 0.2525 0.3395 0.3026
    19 0.978 0.933 0.834 0.946 0.911 0.2259 0.2267 0.2326 0.3188 0.2774
    20 0.966 0.916 0.767 0.943 0.892 0.3358 0.3371 0.3515 0.5252 0.4429
    21 0.954 0.944 0.859 0.948 0.908 0.1427 0.1356 0.1344 0.1761 0.1609
    22 0.956 0.905 0.717 0.956 0.922 0.2403 0.2170 0.2092 0.3444 0.3006
    23 0.970 0.918 0.759 0.952 0.893 0.1872 0.1996 0.1926 0.3086 0.2570
    24 0.977 0.912 0.696 0.948 0.886 0.2877 0.3083 0.2973 0.5290 0.4305
    25 0.962 0.944 0.894 0.946 0.930 0.2247 0.2130 0.2172 0.2394 0.2345
    26 0.969 0.960 0.914 0.950 0.941 0.2951 0.2764 0.2841 0.3215 0.3095
    27 0.965 0.934 0.844 0.940 0.910 0.2898 0.2888 0.3035 0.3631 0.3295
    28 0.963 0.922 0.832 0.930 0.898 0.4228 0.4224 0.4543 0.5779 0.5085
    29 0.967 0.954 0.900 0.942 0.923 0.1878 0.1796 0.1804 0.2135 0.2037
    30 0.968 0.942 0.838 0.938 0.916 0.2754 0.2367 0.2390 0.3086 0.2920
    31 0.964 0.932 0.813 0.940 0.902 0.2438 0.2494 0.2546 0.3483 0.3037
    32 0.978 0.901 0.775 0.943 0.892 0.3631 0.3816 0.3885 0.5766 0.4877
    33 0.951 0.939 0.842 0.930 0.908 0.1543 0.1498 0.1478 0.1930 0.1768
    34 0.969 0.907 0.790 0.953 0.922 0.2610 0.2050 0.1972 0.2997 0.2773
    35 0.977 0.919 0.723 0.941 0.882 0.2022 0.2227 0.2128 0.3380 0.2830
    36 0.978 0.916 0.772 0.916 0.854 0.3030 0.3462 0.3280 0.5797 0.4705
    37 0.953 0.944 0.917 0.945 0.926 0.1508 0.1500 0.1537 0.1685 0.1604
    38 0.951 0.955 0.926 0.946 0.916 0.1871 0.1973 0.2013 0.2248 0.2076
    39 0.936 0.937 0.893 0.950 0.906 0.1917 0.2062 0.2144 0.2582 0.2271
    40 0.921 0.915 0.873 0.943 0.891 0.2691 0.3055 0.3206 0.4083 0.3453
    41 0.952 0.939 0.887 0.943 0.928 0.1249 0.1262 0.1270 0.1502 0.1390
    42 0.947 0.943 0.876 0.955 0.926 0.1677 0.1701 0.1679 0.2150 0.1936
    43 0.948 0.913 0.838 0.957 0.909 0.1601 0.1799 0.1800 0.2476 0.2091
    44 0.951 0.899 0.804 0.956 0.894 0.2276 0.2749 0.2708 0.4040 0.3288
    45 0.955 0.943 0.879 0.954 0.916 0.1016 0.1053 0.1034 0.1354 0.1205
    46 0.954 0.900 0.810 0.959 0.902 0.1540 0.1452 0.1381 0.2101 0.1849
    47 0.938 0.909 0.763 0.951 0.880 0.1309 0.1614 0.1486 0.2379 0.1937
    48 0.915 0.890 0.727 0.958 0.883 0.1877 0.2503 0.2267 0.4030 0.3163
    *Note: Italics indicate the most suitable average width.

     | Show Table
    DownLoad: CSV
    Figure 1.  Comparison of the performance of the proposed method for k = 3 in terms of coverage probability with respect to (A) sample size, (B) shape parameter, (C) proportion of zero, and in terms of average width with respect to (D) sample sizes, (E) shape parameter, and (F) proportion of zero (a1 = (303), b1 = (30, 50,100), c1 = (503), d1 = (1003), e1 = (2.03), f1 = (2.53), g1 = (3.03), h1 = (0.13), i1 = (0.1, 0.3, 0.5), j1 = (0.33), k1 = (0.53)).

    The simulation results for k = 5 are shown in Table 3 and Figure 2. The coverage probabilities of the LS and BCI methods are close to the nominal confidence level of 0.95 in almost all scenarios. In contrast, the MOVER and FGCI methods have values below the specified target. For the GCI method, the coverage probability meets the target when the proportions of zeros are unequal. In terms of the average width, the confidence interval of the MOVER method is the narrowest. However, this method has a coverage probability lower than 0.95 in all scenarios, thus failing to meet the criteria. The LS and BCI methods have the widest confidence intervals compared to the other methods.

    Table 3.  Performance measures of the 95% confidence intervals for the common CV; k = 5.
    Scenarios Coverage probability Average width
    GCI MOVER LS BCI FGCI GCI MOVER LS BCI FGCI
    49 0.944 0.933 0.978 0.944 0.938 0.2182 0.1734 0.2820 0.2145 0.2196
    50 0.954 0.935 0.942 0.954 0.951 0.2685 0.2293 0.3080 0.2834 0.2831
    51 0.937 0.902 0.965 0.944 0.933 0.2862 0.2319 0.3922 0.3217 0.3080
    52 0.940 0.893 0.910 0.904 0.893 0.4433 0.3356 0.5854 0.5083 0.4783
    53 0.924 0.930 0.977 0.941 0.934 0.1860 0.1490 0.2356 0.1903 0.1904
    54 0.951 0.920 0.910 0.946 0.930 0.2355 0.1987 0.2566 0.2657 0.2582
    55 0.915 0.905 0.927 0.941 0.912 0.2485 0.2079 0.3326 0.3074 0.2841
    56 0.910 0.882 0.895 0.934 0.919 0.3868 0.3079 0.5006 0.5068 0.4596
    57 0.900 0.928 0.961 0.941 0.917 0.1570 0.1266 0.1946 0.1711 0.1655
    58 0.959 0.914 0.813 0.935 0.920 0.2159 0.1730 0.2119 0.2573 0.2457
    59 0.881 0.879 0.896 0.955 0.920 0.2094 0.1866 0.2774 0.2993 0.2633
    60 0.866 0.832 0.803 0.922 0.888 0.3235 0.2896 0.4272 0.5123 0.4468
    61 0.915 0.918 0.986 0.940 0.937 0.1794 0.1482 0.2542 0.1822 0.1824
    62 0.959 0.935 0.933 0.931 0.913 0.2317 0.2076 0.2873 0.2584 0.2453
    63 0.898 0.900 0.975 0.937 0.911 0.2318 0.1991 0.3535 0.2751 0.2559
    64 0.897 0.879 0.944 0.912 0.891 0.3514 0.2837 0.5282 0.4348 0.3954
    65 0.907 0.917 0.988 0.937 0.928 0.1526 0.1264 0.2120 0.1617 0.1583
    66 0.950 0.923 0.909 0.946 0.921 0.2032 0.1796 0.2397 0.2467 0.2274
    67 0.878 0.895 0.948 0.946 0.904 0.2016 0.1778 0.3009 0.2640 0.2367
    68 0.875 0.873 0.922 0.939 0.905 0.3101 0.2663 0.4551 0.4360 0.3821
    69 0.877 0.911 0.979 0.951 0.920 0.1266 0.1053 0.1743 0.1456 0.1376
    70 0.966 0.888 0.827 0.945 0.908 0.1865 0.1581 0.1996 0.2466 0.2211
    71 0.816 0.859 0.912 0.958 0.906 0.1664 0.1565 0.2496 0.2550 0.2195
    72 0.833 0.816 0.863 0.928 0.887 0.2587 0.2442 0.3822 0.4364 0.3693
    73 0.938 0.946 0.996 0.950 0.944 0.1531 0.1339 0.2344 0.1615 0.1588
    74 0.959 0.937 0.954 0.940 0.932 0.1894 0.1762 0.2585 0.2225 0.2082
    75 0.919 0.918 0.982 0.942 0.926 0.1967 0.1761 0.3266 0.2440 0.2228
    76 0.884 0.880 0.955 0.916 0.884 0.2931 0.256 0.4900 0.3874 0.3432
    77 0.928 0.920 0.996 0.944 0.923 0.1296 0.1134 0.1945 0.1429 0.1377
    78 0.965 0.898 0.935 0.952 0.925 0.1656 0.1574 0.216 0.2128 0.1940
    79 0.870 0.881 0.966 0.948 0.917 0.1684 0.1581 0.2772 0.2346 0.2055
    80 0.875 0.835 0.932 0.932 0.894 0.2572 0.2371 0.4154 0.3859 0.3298
    81 0.923 0.935 0.980 0.942 0.905 0.1074 0.0949 0.1594 0.1289 0.1197
    82 0.952 0.928 0.882 0.952 0.922 0.1488 0.1371 0.1773 0.2100 0.1868
    83 0.843 0.907 0.933 0.953 0.892 0.1417 0.1401 0.2284 0.2271 0.1910
    84 0.844 0.866 0.896 0.945 0.882 0.2195 0.2161 0.3534 0.3878 0.3185
    85 0.931 0.925 0.984 0.948 0.929 0.1346 0.1221 0.1881 0.1460 0.1415
    86 0.950 0.939 0.959 0.953 0.937 0.1661 0.1606 0.2165 0.1994 0.1852
    87 0.907 0.916 0.961 0.939 0.899 0.1701 0.1615 0.2626 0.2221 0.1999
    88 0.883 0.895 0.954 0.922 0.891 0.2420 0.2330 0.3924 0.3520 0.3043
    89 0.928 0.926 0.978 0.948 0.924 0.1123 0.1025 0.1558 0.1297 0.1228
    90 0.952 0.935 0.925 0.955 0.919 0.1431 0.1379 0.1806 0.1898 0.1712
    91 0.861 0.903 0.945 0.946 0.905 0.1432 0.1424 0.2215 0.2126 0.1837
    92 0.862 0.864 0.903 0.938 0.894 0.2063 0.2140 0.3319 0.3503 0.2915
    93 0.909 0.907 0.953 0.939 0.903 0.0919 0.0858 0.1269 0.1167 0.1064
    94 0.958 0.900 0.847 0.947 0.918 0.1290 0.1225 0.1481 0.1857 0.1631
    95 0.860 0.889 0.897 0.952 0.914 0.1172 0.1258 0.1831 0.2054 0.1705
    96 0.819 0.832 0.847 0.937 0.881 0.1713 0.2029 0.2787 0.3511 0.2824
    *Note: Italics indicate the most suitable average width.

     | Show Table
    DownLoad: CSV
    Figure 2.  Comparison of the performance of the proposed method for k = 5 in terms of coverage probability with respect to (G) sample size, (H) shape parameter, (I) proportion of zero, and in terms of average width with respect to (J) sample sizes, (K) shape parameter, and (L) proportion of zero (a2 = (303, 502), b2 = (302, 502, 100), c2 = (30, 502, 1002), d2 = (503, 1002), e2 = (2.05), f2 = (2.55), g2 = (3.05), h2 = (0.15), i2 = (0.12, 0.32, 0.5), j2 = (0.35), k2 = (0.55)).

    The simulation results for k = 10 are shown in Table 4 and Figure 3. In almost all scenarios, the LS and BCI methods have coverage probabilities greater than or close to 0.95, except when the proportions of zeros equal 0.510. Both methods have wider average widths compared to the other methods. The GCI method has coverage probabilities close to 0.95 when the sample size is large and the shape parameters are equal to 2.0. For the MOVER method, even though it has the narrowest average width, it has coverage probabilities lower than 0.95 in all scenarios.

    Table 4.  Performance measures of the 95% confidence intervals for the common CV; k = 10.
    Scenarios Coverage probability Average width
    GCI MOVER LS BCI FGCI GCI MOVER LS BCI FGCI
    97 0.927 0.894 0.961 0.953 0.953 0.1535 0.1264 0.2812 0.1481 0.1525
    98 0.951 0.940 0.935 0.959 0.952 0.1855 0.1628 0.2812 0.1867 0.1872
    99 0.954 0.850 0.943 0.958 0.954 0.2056 0.1670 0.3932 0.2208 0.2145
    100 0.929 0.789 0.854 0.902 0.891 0.3392 0.2946 0.5878 0.3486 0.3355
    101 0.903 0.905 0.950 0.953 0.929 0.1336 0.1075 0.2353 0.1307 0.1336
    102 0.929 0.931 0.948 0.953 0.944 0.1707 0.1443 0.2344 0.1745 0.1707
    103 0.909 0.862 0.904 0.957 0.936 0.1814 0.1472 0.3341 0.2105 0.1967
    104 0.888 0.803 0.826 0.907 0.896 0.3046 0.2221 0.5069 0.3499 0.3245
    105 0.824 0.914 0.951 0.937 0.920 0.1122 0.0900 0.1926 0.1165 0.1148
    106 0.866 0.908 0.952 0.957 0.940 0.1581 0.1275 0.1935 0.1688 0.1587
    107 0.834 0.853 0.864 0.957 0.906 0.1547 0.1313 0.2802 0.2057 0.1827
    108 0.836 0.791 0.764 0.931 0.870 0.2584 0.2081 0.4254 0.3564 0.3196
    109 0.920 0.908 0.961 0.959 0.933 0.1333 0.1111 0.2818 0.1316 0.1339
    110 0.944 0.931 0.965 0.963 0.915 0.1626 0.1540 0.2816 0.1782 0.1728
    111 0.934 0.895 0.927 0.956 0.925 0.1774 0.1455 0.3911 0.1979 0.1876
    112 0.934 0.874 0.856 0.920 0.889 0.2932 0.2572 0.5836 0.3132 0.2929
    113 0.887 0.926 0.953 0.953 0.920 0.1160 0.0948 0.2347 0.1167 0.1172
    114 0.913 0.915 0.963 0.952 0.931 0.1417 0.1362 0.2356 0.1686 0.1563
    115 0.904 0.895 0.904 0.958 0.908 0.1584 0.1290 0.3312 0.1889 0.1732
    116 0.892 0.865 0.840 0.917 0.871 0.2691 0.1937 0.5054 0.3140 0.2841
    117 0.873 0.920 0.936 0.944 0.892 0.0983 0.0786 0.1927 0.1039 0.1007
    118 0.926 0.905 0.959 0.955 0.912 0.1309 0.1214 0.1922 0.1667 0.1490
    119 0.861 0.879 0.836 0.958 0.905 0.1361 0.1148 0.2756 0.1833 0.1598
    120 0.875 0.788 0.747 0.910 0.830 0.2287 0.1802 0.4273 0.3159 0.2729
    121 0.943 0.921 0.962 0.958 0.929 0.1039 0.0941 0.2170 0.1103 0.1090
    122 0.949 0.931 0.957 0.954 0.923 0.1250 0.1221 0.2174 0.1426 0.1357
    123 0.950 0.903 0.951 0.947 0.903 0.1332 0.1243 0.3034 0.1674 0.1532
    124 0.958 0.900 0.917 0.932 0.883 0.1959 0.1793 0.4527 0.2642 0.2349
    125 0.880 0.919 0.961 0.941 0.889 0.0877 0.0797 0.1804 0.0979 0.0944
    126 0.924 0.930 0.954 0.956 0.927 0.1100 0.1071 0.1808 0.1341 0.1237
    127 0.955 0.907 0.920 0.948 0.887 0.1134 0.1092 0.2552 0.1599 0.1408
    128 0.950 0.859 0.865 0.943 0.882 0.1697 0.1626 0.3878 0.2634 0.2246
    129 0.894 0.923 0.952 0.943 0.866 0.0723 0.0671 0.1480 0.0880 0.0819
    130 0.920 0.904 0.959 0.956 0.910 0.1008 0.0943 0.1468 0.1301 0.1158
    131 0.921 0.863 0.873 0.950 0.906 0.0941 0.0986 0.2125 0.1551 0.1309
    132 0.924 0.823 0.789 0.934 0.862 0.1446 0.1531 0.3257 0.2649 0.2175
    133 0.959 0.933 0.970 0.954 0.936 0.0836 0.0798 0.1534 0.0920 0.0888
    134 0.953 0.949 0.961 0.951 0.923 0.0957 0.1005 0.1538 0.1100 0.1037
    135 0.964 0.907 0.959 0.940 0.919 0.1057 0.1063 0.2146 0.1404 0.1257
    136 0.964 0.883 0.943 0.930 0.895 0.1490 0.1541 0.3189 0.2215 0.1904
    137 0.946 0.909 0.969 0.952 0.931 0.0696 0.0678 0.1266 0.0817 0.0769
    138 0.942 0.946 0.964 0.955 0.946 0.0838 0.0886 0.1274 0.1022 0.0934
    139 0.968 0.888 0.927 0.954 0.929 0.0886 0.0946 0.1798 0.1343 0.1154
    140 0.957 0.859 0.904 0.927 0.895 0.1261 0.1418 0.2706 0.2205 0.1824
    141 0.936 0.921 0.947 0.959 0.934 0.0568 0.0590 0.1038 0.0733 0.0666
    142 0.940 0.918 0.958 0.957 0.916 0.0751 0.0782 0.1036 0.0968 0.0858
    143 0.958 0.875 0.877 0.958 0.905 0.0727 0.0841 0.1486 0.1302 0.1073
    144 0.962 0.831 0.858 0.940 0.907 0.1047 0.1298 0.2275 0.2218 0.1763
    *Note: Italics indicate the most suitable average width.

     | Show Table
    DownLoad: CSV
    Figure 3.  Comparison of the performance of the proposed method for k = 10 in terms of coverage probability with respect to (M) sample size, (N) shape parameter, (O) proportion of zero, and in terms of average width with respect to (P) sample sizes, (Q) shape parameter, and (R) proportion of zero (a3 = (305, 505), b3 = (305, 503, 1002), c3 = (506, 1004), d3 = (10010), e3 = (2.010), f3 = (2.510), g3 = (3.010), h3 = (0.110), i3 = (0.15, 0.33, 0.52), j3 = (0.310), k3 = (0.510)).

    Figures 13 exhibit similar patterns, showing consistent trends. As the sample size increases, all the proposed methods tend to decrease. Similarly, as the shape parameter increases, all the proposed methods also tend to decrease. Conversely, when the proportion of zeros increases, all the proposed methods tend to increase. These observations are all based on the average width.

    Algorithm 6.

         For a given $ \left({m}_{1}, {m}_{2}, ..., {m}_{k}\right) $, $ \left({\alpha }_{1}, {\alpha }_{2}, ..., {\alpha }_{k}\right) $, $ \left({\vartheta }_{1}, {\vartheta }_{2}, ..., {\vartheta }_{k}\right) $, and $ {\beta }_{1} = {\beta }_{2} = ... = {\beta }_{k} = 1 $,

         for $ r = 1 $ to $ M $

        1)  Generate sample from the ZIBS distribution;

        2)  Compute the unbiased estimates $ {\widehat{\alpha }}_{i} $ and $ {\widehat{\vartheta }}_{i} $;

        3)  Compute the 95% confidence intervals for $ \theta $ based on the GCI, MOVER, LS, BCI, and FGCI via Algorithms 1–5, respectively;

        4)  If $ \left[{L}_{r}\le \theta \le {U}_{r}\right] $, set $ {D}_{r} = 1 $; else set $ {D}_{r} = 0 $;

    End $ r $ loop.

        5)  The coverage probability and average width for each method are obtained by $ CP = \frac{1}{M}{\sum }_{r = 1}^{M}{D}_{r} $ and $ AW = \frac{{U}_{r}-{L}_{r}}{M} $, where $ {U}_{r} $ and $ {L}_{r} $ are the upper and lower confidence limits, respectively.

    In this study, we leverage wind speed data from all directions to construct CIs for the common coefficient of variation of several ZIBS distributions. The data were collected from January 1 to 7, 2024, from three weather stations: Chanthaburi Weather Observing Station in Chanthaburi Province, Chumphon Weather Observing Station in Chumphon Province, and Songkhla Weather Observing Station in Songkhla Province. The selection of these three stations is due to their proximity to the Gulf of Thailand, which makes them directly influenced by sea breezes and tropical storms. This results in high wind speed fluctuations and also impacts the livelihoods, economy, and environment of the surrounding communities. All data were collected by the Thai Meteorological Department and are presented in Table 5 (Thai Meteorological Department Automatic Weather System, https://www.tmd.go.th/service/tmdData). To visualize the data distribution, we plotted histograms of wind speed data from all three stations, as shown in Figure 4. Table 6 provides statistical summaries for wind speed data at each station, revealing that the coefficients of variation of the wind speed data for the Chanthaburi Weather Observing Station, Chumphon Weather Observing Station, and Songkhla Weather Observing Station are 2.6799, 2.5111, and 2.7118, respectively. When considering the entire wind speed dataset, we observe a mixture of zero values (no wind) and positive values. For the positive values, we evaluate the suitability of the data distribution using the Akaike Information Criterion (AIC) and Bayesian Information Criterion (BIC) calculated as $ AIC = 2ln\left(L\right)+2p $ and $ BIC = 2ln\left(L\right)+2pln\left(o\right) $, respectively, where p is the number of parameters estimated, o is the number of observations, and L is the likelihood function. From Table 7, it is evident that the Birnbaum-Saunders distribution exhibits the lowest AIC and BIC values compared to other distributions, indicating its best fit for positive wind speed data. Additionally, to confirm that the positive wind speed data follows the Birnbaum-Saunders distribution, we plotted the cumulative distribution function (CDF) derived from the positive wind speed data and the estimated CDF from the Birnbaum-Saunders distribution. As shown in Figure 5, both graphs are similar, indicating a good fit. Therefore, the wind speed data comprises both positive and zero values and follows the ZIBS distribution. This distribution was thus used to compute the CIs for the common coefficient of variation of the wind speed data. Table 8 presents the 95% confidence intervals for the common coefficient of variation of wind speed data from the three weather observing stations using the GCI, MOVER, LS, BCI, and FGCI methods. We compared wind speed data with parameters generated from simulation using a sample size of $ {m}_{i} $ = 1003, parameter $ {\alpha }_{i} $ = 2.53, and parameter $ {\vartheta }_{i} $ = 0.53, as shown in Table 2. The simulation results indicate that the GCI and BCI methods meet the criterion of coverage probability greater than or equal to the nominal confidence level of 0.95. When considering the average width, the GCI method provides the narrowest confidence interval. The results in Table 8 show that the confidence interval for the common coefficient of variation for the wind speed data using the GCI method is [2.5001, 2.7224], with a confidence interval width of 0.2224, which is the narrowest among all methods. This leads to the conclusion that the appropriate method for the wind speed data is consistent with the simulation results.

    Table 5.  Data on the wind speed (knots) from the Chanthaburi Weather Observing Station, Chumphon Weather Observing Station, and Songkhla Weather Observing Station, Thailand.
    N NNE NE ENE E ESE SE SSE S SSW SW WSW W WNW NW NNW
    Chanthaburi Weather Observing Station
    4.7 19.4 25.7 10.2 1.7 0.9 0.3 2.2 0.7 0.3 1.5 1.5 0.3 0.0 0.0 1.8
    9.2 18.2 20.6 8.2 0.7 0.1 0.7 1.9 0.4 0.0 0.6 1.7 0.3 0.3 2.2 7.4
    9.8 31.8 36.5 5.6 0.8 0.0 0.0 0.0 0.0 0.0 0.0 0.0 0.0 0.1 1.2 5.4
    8.3 30.4 43.9 5.6 0.1 0.0 0.0 0.0 0.0 0.0 0.0 0.0 0.0 0.0 0.1 2.6
    2.3 25.0 60.7 11.3 0.4 0.0 0.0 0.0 0.0 0.0 0.0 0.0 0.0 0.0 0.0 0.2
    0.0 0.0 0.0 0.0 0.0 0.0 0.0 0.0 0.0 0.0 0.0 0.0 0.0 0.0 0.0 100.0
    19.2 9.9 1.2 0.0 0.3 0.0 0.0 0.0 0.0 0.0 0.0 0.0 0.0 0.0 0.9 13.3
    Chumphon Weather Observing Station
    0.0 0.0 0.0 0.0 0.8 21.4 14.6 2.8 7.6 11.0 13.2 6.3 1.5 0.0 0.0 0.0
    0.0 0.0 0.0 0.0 0.5 17.6 13.9 3.5 0.9 1.5 26.5 18.1 0.3 0.0 0.0 0.0
    0.0 0.0 0.0 0.0 0.2 15.6 23.5 5.9 0.9 4.6 21.0 14.0 0.4 0.0 0.0 0.0
    0.0 0.0 0.0 0.0 0.0 11.5 25.2 7.9 0.6 1.9 16.1 29.2 0.3 0.0 0.0 0.0
    0.0 0.0 0.0 0.0 0.0 17.8 36.2 1.9 0.3 2.0 22.2 13.1 0.1 0.0 0.0 0.0
    0.0 0.0 0.0 0.0 0.0 8.7 26.6 6.2 1.0 2.9 22.6 24.2 0.2 0.0 0.0 0.0
    0.0 0.0 0.0 0.0 0.0 0.3 5.4 2.3 1.8 7.1 46.9 23.0 0.1 0.0 0.0 0.0
    Songkhla Weather Observing Station
    0.9 4.8 12.2 17.0 11.3 0.8 0.0 0.0 0.0 0.0 0.0 0.0 0.0 0.0 0.1 0.4
    0.3 5.8 19.2 16.9 7.2 1.5 0.0 0.0 0.0 0.0 0.0 0.0 0.0 0.0 0.0 0.0
    0.2 3.7 13.8 21.0 14.9 2.8 0.2 0.0 0.0 0.0 0.0 0.0 0.0 0.1 0.4 0.1
    0.1 1.4 6.9 17.6 16.3 5.3 0.3 0.0 0.0 0.0 0.0 0.0 0.0 0.0 0.0 0.0
    0.1 1.5 8.3 21.9 17.0 1.5 0.0 0.1 0.0 0.0 0.0 0.0 0.0 0.0 0.0 0.1
    0.4 1.8 9.4 22.1 14.6 2.1 0.0 0.0 0.0 0.1 0.0 0.0 0.0 0.0 0.3 0.1
    0.3 1.3 8.8 22.2 18.8 1.7 0.0 0.0 0.0 0.0 0.0 0.0 0.0 0.0 0.5 0.2

     | Show Table
    DownLoad: CSV
    Figure 4.  The histograms of wind speed data for each weather observing station.
    Table 6.  Summary statistics for the wind speed data.
    Data $ {m}_{i} $ $ {m}_{i\left(0\right)} $ $ {m}_{i\left(1\right)} $ $ {\widehat{\vartheta }}_{i} $ $ {\widehat{\alpha }}_{i} $ $ {\widehat{\beta }}_{i} $ $ {\widehat{\theta }}_{i} $
    Chanthaburi 112 55 57 0.4911 2.4263 2.5385 2.6799
    Chumphon 112 53 59 0.4732 2.1425 3.1567 2.5111
    Songkhla 112 56 56 0.5000 2.4389 1.6118 2.7118

     | Show Table
    DownLoad: CSV
    Table 7.  The AIC and BIC values of each distribution for the wind speed data.
    Distribution Chanthaburi Chumphon Songkhla
    AIC BIC AIC BIC AIC BIC
    Normal 490.51 494.60 450.80 454.96 388.26 392.31
    Lognormal 341.50 345.59 400.64 404.79 301.91 305.96
    Logistic 466.00 470.09 450.81 454.96 391.04 395.09
    Cauchy 418.12 422.20 467.59 471.75 390.09 394.14
    Exponential 378.61 380.66 396.35 398.43 322.00 324.02
    Gamma 350.13 354.22 390.40 394.55 299.53 303.58
    Birnbaum-Saunders 336.10 342.23 386.43 392.66 285.49 291.56
    Weibull 345.83 349.92 391.75 395.91 300.21 304.26

     | Show Table
    DownLoad: CSV
    Figure 5.  The CDF of the positive wind speed data and the estimated CDF from the Birnbaum-Saunders distribution.
    Table 8.  The 95% CIs for the common coefficients of variation for the wind speed data.
    Methods Interval [L, U] Width
    GCI [2.5001, 2.7224] 0.2224
    MOVER [2.5050, 2.7283] 0.2233
    LS [2.5077, 2.7690] 0.2613
    BCI [2.4880, 2.8142] 0.3262
    FGCI [2.4979, 2.7816] 0.2837

     | Show Table
    DownLoad: CSV

    Based on the study results, it is evident that the GCI demonstrates good performance in almost all scenarios, as the coverage probability is greater than or close to the nominal confidence level of 0.95, which is consistent with the previous research by Ye, Ma, and Wang [32], Thangjai, Niwitpong, and Niwitpong [33], Janthasuwan, Niwitpong, and Niwitpong [11]. When k is large, both LS and BCI perform well. In most scenarios, MOVER and FGCI have coverage probabilities below acceptable levels, indicating that these methods may not be suitable for many situations, which aligns with the previous research by Puggard, Niwitpong, and Niwitpong [17]. Considering the average width, all proposed methods tend to decrease as the sample size and shape parameters increase, which improves their efficiency. Conversely, when the proportion of zeros increases, all proposed methods tend to decrease, leading to reduced efficiency. In our case, the simulation results showed that the MOVER method provided the narrowest confidence intervals for most scenarios and performed well with small sample sizes combined with a low proportion of zeros. However, the MOVER method yielded coverage probabilities lower than the specified confidence level in almost all scenarios. Similarly, the FGCI method achieves a coverage probability close to the specified confidence level in scenarios with a low proportion of zeros. This could be attributed to certain weaknesses that affect the fiducial generalized pivotal quantities for the proportion of zeros. Additionally, the issues with both the MOVER and FGCI methods likely arise from the upper and lower bounds for zero values used in constructing the confidence intervals and the combined effect with other parameters; this results in insufficient coverage probability. Finally, wind energy is a vital, renewable source of power, primarily generated by capturing wind speed. However, fluctuations in wind speed can introduce uncertainty. According to Lee, Fields, and Lundquist [34], understanding these variations is crucial for assessing wind resource potential.

    This article presents an estimation of the common coefficient of variation of several ZIBS distributions. The methods proposed include GCI, MOVER, LS, BCI, and FGCI. The performance of each method was evaluated through Monte Carlo simulations, comparing their coverage probabilities and average widths. The simulation results for k = 3 recommend the GCI method due to its acceptable coverage probability and narrow confidence intervals in almost all scenarios, while the BCI method is another option for situations with large sample sizes. For k = 5, we recommend the GCI method when $ {\vartheta }_{i} $ is unequal, the LS method when $ {\vartheta }_{i} $ is small and the sample size is large, and the BCI method when $ {\vartheta }_{i} $ is large. For k = 10, the BCI and GCI methods are recommended: the BCI method (for small to medium sample sizes) and the GCI method for large sample sizes. Additionally, in all sample cases (k = 3, 5, and 10), the MOVER method has the narrowest confidence intervals but a coverage probability below the acceptable level in most situations, and the FGCI method has a coverage probability below the acceptable level in almost all situations. Therefore, these two methods are not recommended. Finally, all the proposed methods were applied to wind speed data in Thailand and yielded results consistent with the simulation findings. In future research, we will explore new methods for constructing confidence intervals, potentially using Bayesian and highest posterior density (HPD) approaches to enhance their effectiveness. Additionally, we will use other real-world data to conduct a more comprehensive study.

    Usanee Janthasuwan conducted the data analysis, drafted the initial manuscript, and contributed to the writing. Suparat Niwitpong developed the research framework, designed the experiment, and reviewed the manuscript. Sa-Aat Niwitpong provided analytical methodologies, validated the final version, and obtained funding.

    The authors declare that they have not used Artificial Intelligence (AI) tools in the creation of this article.

    The authors would like to express their sincere gratitude to the editor and reviewers for their valuable comments and suggestions, which have significantly improved the quality of the manuscript. This research was funded by the King Mongkut's University of Technology North Bangkok, contract no: KMUTNB-68-KNOW-17.

    The authors declare no conflict of interest.

    [1] Hadziyannis S, Gerber MA, Vissoulis C, et al. (1973) Cytoplasmic hepatitis B antigen in "ground-glass" hepatocytes of carriers. Arch Pathol 96: 327–330.
    [2] Pópper H (1975) The ground glass hepatocyte as a diagnostic hint. Hum Pathol 6: 517–520. doi: 10.1016/S0046-8177(75)80069-4
    [3] Shikata T (1973) Australia antigen in liver tissue-an immunofluorescent and immunoelectron microscopic study. Jpn J Exp Med 43: 231–245.
    [4] Shikata T, Uzawa T, Yoshiwara N, et al. (1974) Staining methods of Australia antigen in paraffin section-detection of cytoplasmic inclusion bodies. Jpn J Exp Med 44: 25–36.
    [5] Gudat F, Bianchi L, Sonnabend W, et al. (1975) Pattern of core and surface expression in liver tissue reflects state of specific immune response in hepatitis B. Lab Invest 32: 1–9.
    [6] Hsu H, Lai M, Su I, et al. (1988) Correlation of hepatocyte HBsAg expression with virus replication and liver pathology. Hepatology 8: 749–754. doi: 10.1002/hep.1840080408
    [7] 
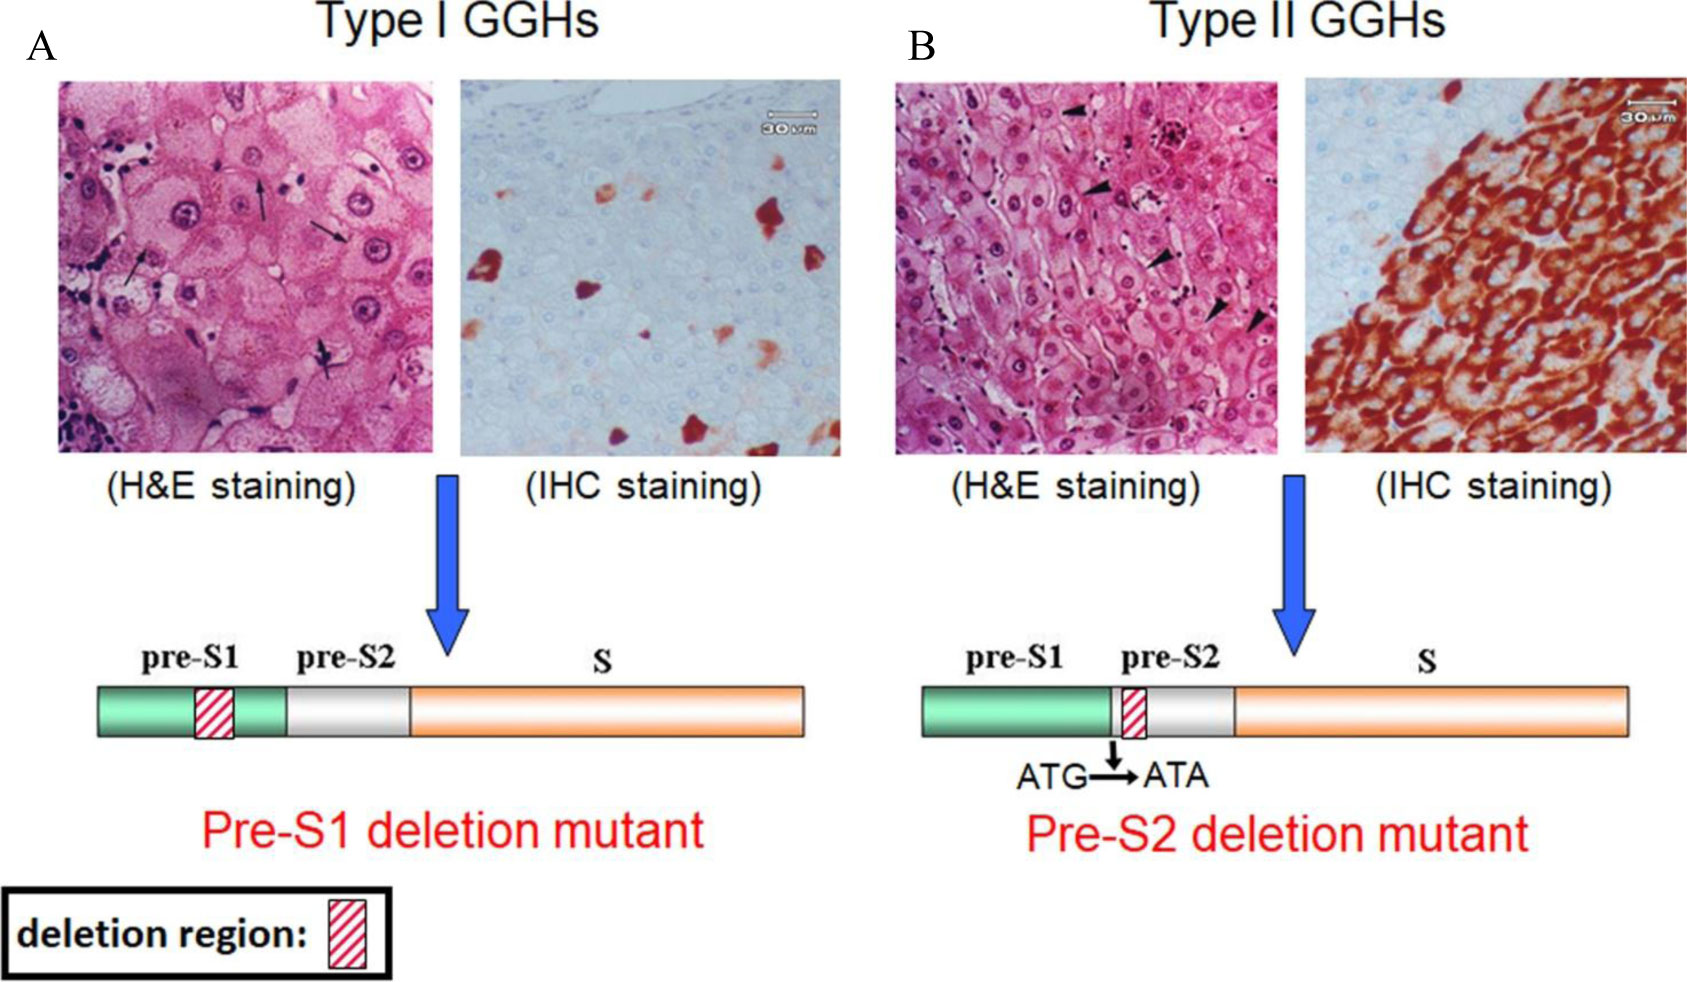
Wang HC, Wu HC, Chen CF, et al. (2003) Different types of ground glass hepatocytes in chronic hepatitis B virus infection contain specific pre-S mutants that may induce endoplasmic reticulum stress. Am J Pathol 163: 2441–2449. doi: 10.1016/S0002-9440(10)63599-7
    [8] Su IJ, Kuo TT, Liaw YF (1985) Hepatocyte hepatitis B surface antigen. Diagnostic evaluation of patients with clinically acute hepatitis B surface antigen-positive hepatitis. Arch Pathol Lab Med 109: 400–402.
    [9] Hsu HC, Lin YH, Chang MH, et al. (1988) Pathology of chronic hepatitis B virus infection in children: with special reference to the intrahepatic expression of hepatitis B virus antigens. Hepatology 8: 378–382. doi: 10.1002/hep.1840080232
    [10] Fan YF, Lu CC, Chang YC, et al. (2000) Identification of a pre-S2 mutant in hepatocytes expressing a novel marginal pattern of surface antigen in advanced diseases of chronic hepatitis B virus infection. J Gastroenterol Hepatol 15: 519–528. doi: 10.1046/j.1440-1746.2000.02187.x
    [11] Su IJ, Lai MY, Hsu HC, et al. (1986) Diverse virological, histopathological and prognostic implications of seroconversion from hepatitis B e antigen to anti-HBe in chronic hepatitis B virus infection. J Hepatol 3: 182–189. doi: 10.1016/S0168-8278(86)80024-1
    [12] Tai PC, Banik D, Lin GI, et al. (1997) Novel and frequent mutations of hepatitis B virus coincide with a major histocompatibility complex class I-restricted T-cell epitope of the surface antigen. J Virol 71: 4852–4856.
    [13] Hsu HC, Wu TT, Wu MZ, et al. (1988) Evolution of expression of hepatitis B surface and core antigens (HBsAg, HBcAg) in resected primary and recurrent hepatocellular carcinoma in HBsAg carriers in Taiwan. Correlation with local host immune response. Cancer 62: 915–921.
    [14] Mimms L (1995) Hepatitis B virus escape mutants: "Pushing the envelope" of chronic hepatitis B virus infection. Hepatology 21: 884–887.
    [15] Hsieh YH, Su IJ, Wang HC, et al. (2007) Hepatitis B virus pre-S2 mutant surface antigen induces degradation of cyclin-dependent kinase inhibitor p27Kip1 through c-Jun activation domain-binding protein 1. Mol Cancer Res 5: 1063–1072. doi: 10.1158/1541-7786.MCR-07-0098
    [16] Liu S, Zhang H, Gu C, et al. (2009) Associations between hepatitis B virus mutations and the risk of hepatocellular carcinoma: A meta-analysis. J Natl Cancer Inst 101: 1066–1082. doi: 10.1093/jnci/djp180
    [17] Santantonio T, Jung MC, Schneider R, et al. (1992) Hepatitis B virus genomes that cannot synthesize pre-S2 proteins occur frequently and as dominant virus populations in chronic carriers in Italy. Virology 188: 948–952. doi: 10.1016/0042-6822(92)90559-8
    [18] Fan YF, Lu CC, Chen WC, et al. (2001) Prevalence and significance of hepatitis B virus (HBV) pre-S mutants in serum and liver at different replicative stages of chronic HBV infection. Hepatology 33: 277–286. doi: 10.1053/jhep.2001.21163
    [19] Huy TT, Ushijima H, Win KM, et al. (2003) High prevalence of hepatitis B virus pre-S mutant in countries where it is endemic and its relationship with genotype and chronicity. J Clin Microbiol 41: 5449–5455. doi: 10.1128/JCM.41.12.5449-5455.2003
    [20] Fernholz D, Galle PR, Stemler M, et al. (1993) Infectious hepatitis B virus variant defective in pre-S2 protein expression in a chronic carrier. Virology 194: 137–148. doi: 10.1006/viro.1993.1243
    [21] Le SJ, Chouteau P, Cannie I, et al. (1998) Role of the pre-S2 domain of the large envelope protein in hepatitis B virus assembly and infectivity. J Virol 72: 5573–5578.
    [22] Su IJ, Wang HC, Wu HC, et al. (2008) Ground glass hepatocytes contain pre-S mutants and represent preneoplastic lesions in chronic hepatitis B virus infection. J Gastroenterol Hepatol 23: 1169–1174. doi: 10.1111/j.1440-1746.2008.05348.x
    [23] Wang M, Kaufman RJ (2014) The impact of the endoplasmic reticulum protein-folding environment on cancer development. Nat Rev Cancer 14: 581–597. doi: 10.1038/nrc3800
    [24] Hsieh YH, Su IH, Chang WW, et al. (2004) Pre-S mutant surface antigens in chronic hepatitis B virus infection induce oxidative stress and DNA damage. Carcinogenesis 25: 2023–2032. doi: 10.1093/carcin/bgh207
    [25] Hung JH, Su IJ, Lei HY, et al. (2004) Endoplasmic reticulum stress stimulates the expression of cyclooxygenase-2 through activation of NF-kappaB and pp38 mitogen-activated protein kinase. J Biol Chem 279: 46384–46392. doi: 10.1074/jbc.M403568200
    [26] Yen TT, Yang A, Chiu WT, et al. (2016) Hepatitis B virus PreS2-mutant large surface antigen activates store-operated calcium entry and promotes chromosome instability. Oncotarget 7: 23346–23360.
    [27] Smyth JT, Hwang SY, Tomita T, et al. (2010) Activation and regulation of store-operated calcium entry. J Cell Mol Med 14: 2337–2349. doi: 10.1111/j.1582-4934.2010.01168.x
    [28] Wang LH, Huang W, Lai MD, et al. (2012) Aberrant cyclin A expression and centrosome overduplication induced by hepatitis B virus pre-S2 mutants and its implication in hepatocarcinogenesis. Carcinogenesis 33: 466–472. doi: 10.1093/carcin/bgr296
    [29] Wang HC, Chang WT, Chang WW, et al. (2005) Hepatitis B virus pre-S2 mutant upregulates cyclin A expression and induces nodular proliferation of hepatocytes. Hepatology 41: 761–770. doi: 10.1002/hep.20615
    [30] Sunami Y, Ringelhan M, Kokai E, et al. (2016) Canonical NF-kappaB signaling in hepatocytes acts as a tumor-suppressor in hepatitis B virus surface antigen-driven hepatocellular carcinoma by controlling the unfolded protein response. Hepatology 63: 1592–1607. doi: 10.1002/hep.28435
    [31] Hsieh YH, Chang YY, Su IJ, et al. (2015) Hepatitis B virus pre-S2 mutant large surface protein inhibits DNA double-strand break repair and leads to genome instability in hepatocarcinogenesis. J Pathol 236: 337–347. doi: 10.1002/path.4531
    [32] Hsieh YH, Hsu JL, Su IJ, et al. (2011) Genomic instability caused by hepatitis B virus: Into the hepatoma inferno. Front Biosci 16: 2586–2597. doi: 10.2741/3874
    [33] Akbar SK, Onji M (1998) Hepatitis B virus (HBV)-transgenic mice as an investigative tool to study immunopathology during HBV infection. Int J Exp Pathol 79: 279–291.
    [34] Huang SN, Chisari FV (1995) Strong, sustained hepatocellular proliferation precedes hepatocarcinogenesis in hepatitis B surface antigen transgenic mice. Hepatology 21: 620–626.
    [35] Hagen TM, Huang S, Curnutte J, et al. (1994) Extensive oxidative DNA damage in hepatocytes of transgenic mice with chronic active hepatitis destined to develop hepatocellular carcinoma. Proc Natl Acad Sci U S A 91: 12808–12812. doi: 10.1073/pnas.91.26.12808
    [36] 
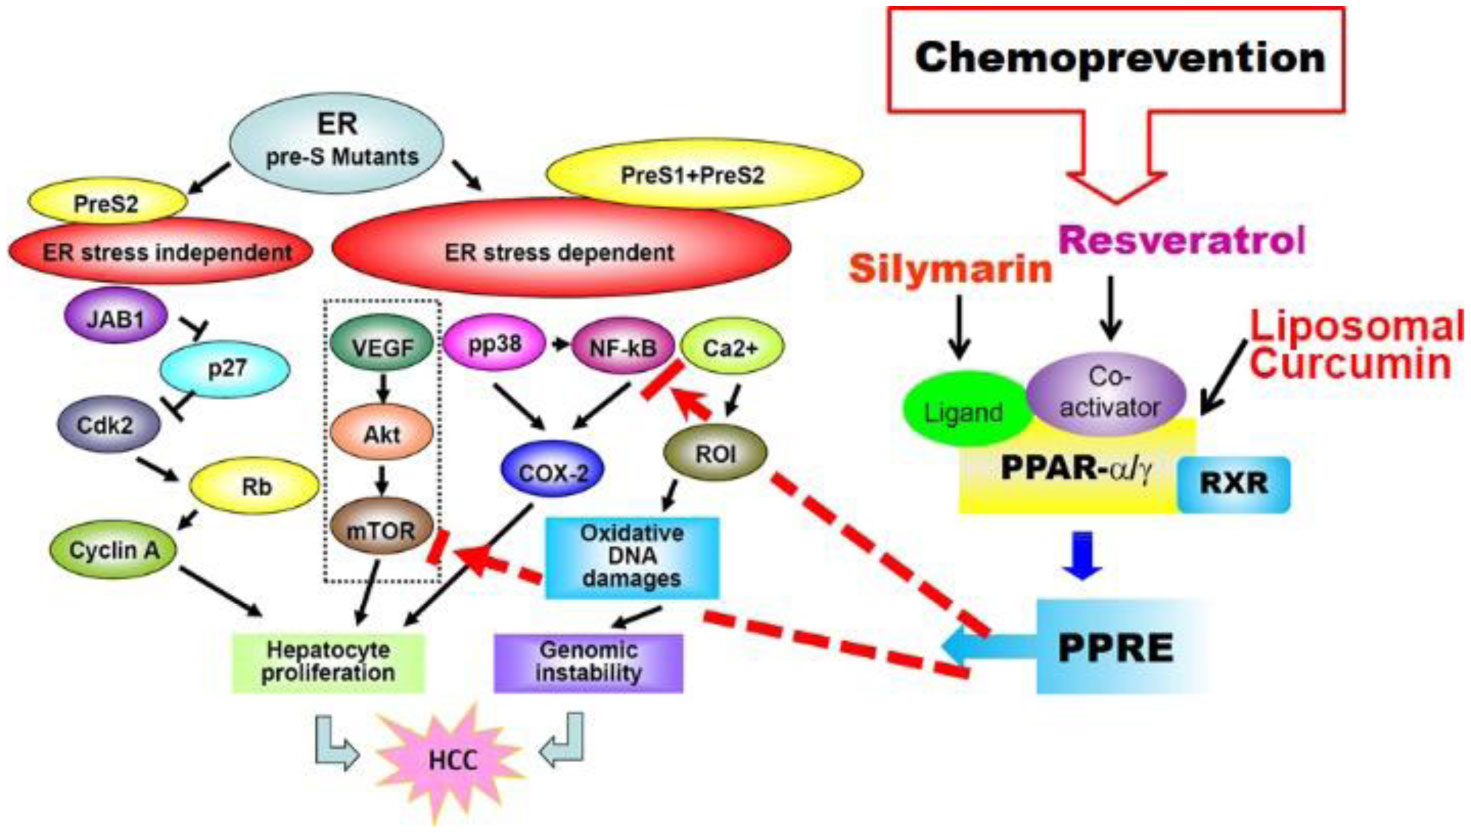
Wang HC, Huang W, Lai MD, et al. (2006) Hepatitis B virus pre-S mutants, endoplasmic reticulum stress and hepatocarcinogenesis. Cancer Sci 97: 683–688. doi: 10.1111/j.1349-7006.2006.00235.x
    [37] Zheng Y, Chen WL, Louie SG, et al. (2007) Hepatitis B virus promotes hepatocarcinogenesis in transgenic mice. Hepatology 45: 16–21. doi: 10.1002/hep.21445
    [38] Teng YC, Neo JC, Wu JC, et al. (2017) Expression of a hepatitis B virus pre-S2 deletion mutant in the liver results in hepatomegaly and hepatocellular carcinoma in mice. J Pathol 241: 463–474. doi: 10.1002/path.4850
    [39] Shen FC, Su IJ, Wu HC, et al. (2009) A pre-S gene chip to detect pre-S deletions in hepatitis B virus large surface antigen as a predictive marker for hepatoma risk in chronic hepatitis B virus carriers. J Biomed Sci 16: 84. doi: 10.1186/1423-0127-16-84
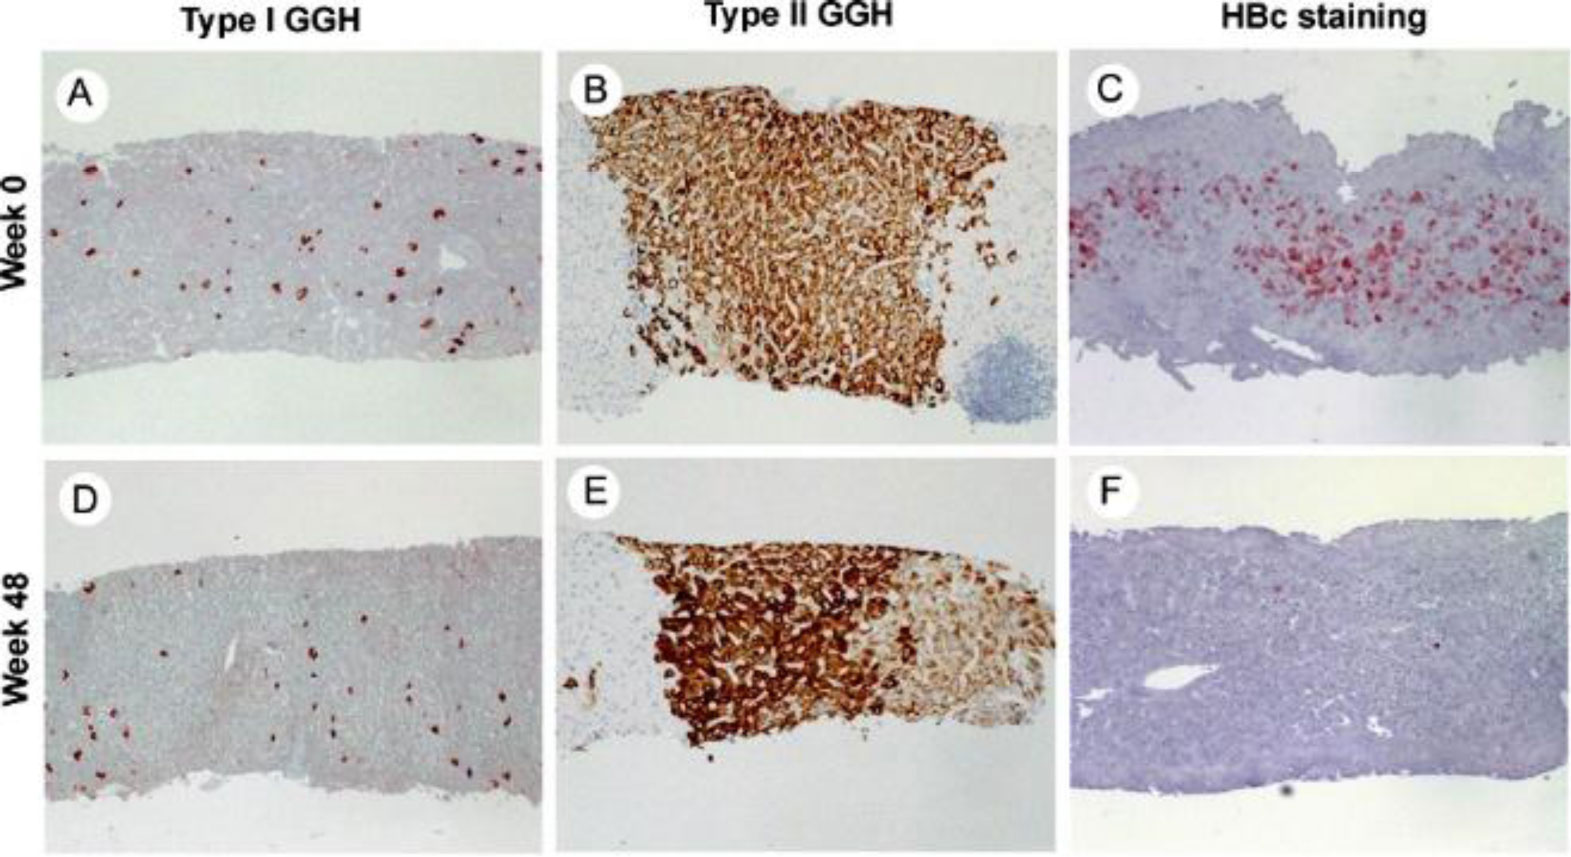
    [40] Tsai HW, Lin YJ, Wu HC, et al. (2016) Resistance of ground glass hepatocytes to oral antivirals in chronic hepatitis B patients and implication for the development of hepatocellular carcinoma. Oncotarget 7: 27724–27734.
    [41] Chang TT, Liaw YF, Wu SS, et al. (2010) Long-term entecavir therapy results in the reversal of fibrosis/cirrhosis and continued histological improvement in patients with chronic hepatitis B. Hepatology 52: 886–893. doi: 10.1002/hep.23785
    [42] Singal AK, Salameh H, Kuo YF, et al. (2013) Meta-analysis: The impact of oral anti-viral agents on the incidence of hepatocellular carcinoma in chronic hepatitis B. Aliment Pharmacol Ther 38: 98–106. doi: 10.1111/apt.12344
    [43] Wu CY, Chen YJ, Ho HJ, et al. (2012) Association between nucleoside analogues and risk of hepatitis B virus-related hepatocellular carcinoma recurrence following liver resection. JAMA 308: 1906–1914. doi: 10.1001/2012.jama.11975
    [44] 
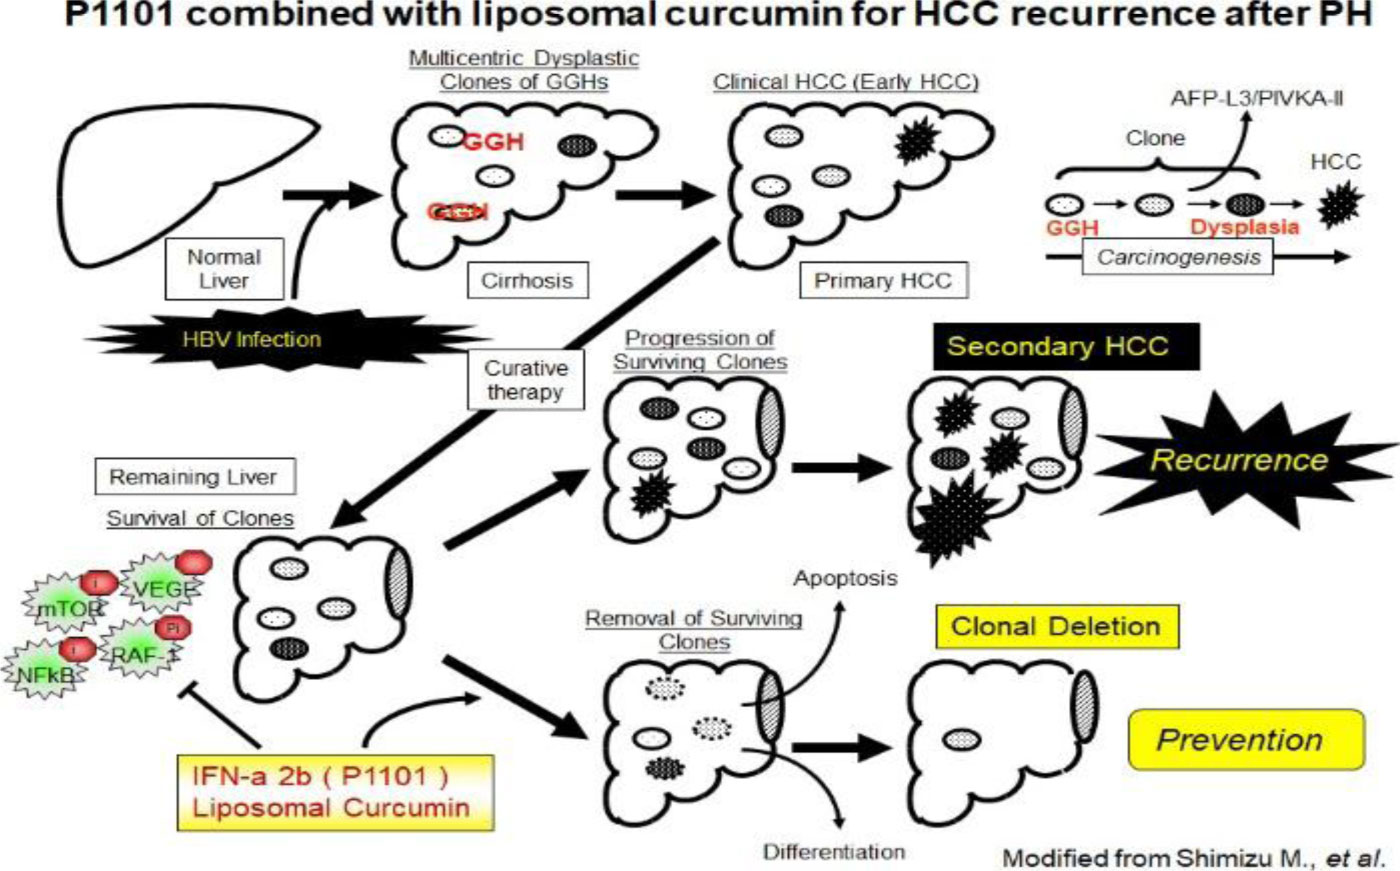
Tsai HW, Lin YJ, Lin PW, et al. (2011) A clustered ground-glass hepatocyte pattern represents a new prognostic marker for the recurrence of hepatocellular carcinoma after surgery. Cancer 117: 2951–2960. doi: 10.1002/cncr.25837
    [45] Manesis EK, Hadziyannis ES, Angelopoulou OP, et al. (2007) Prediction of treatment-related HBsAg loss in HBeAG-negative chronic hepatitis B: A clue from serum HBsAg levels. Antiviral Ther 12: 73–82.
    [46] Wong DK, Cheung AM, O'Rourke K, et al. (1993) Effect of alpha-interferon treatment in patients with hepatitis B e antigen-positive chronic hepatitis B. A meta-analysis. Ann Intern Med 119: 312–323. doi: 10.7326/0003-4819-119-4-199308150-00011
    [47] Teng CF, Wu HC, Hsieh WC, et al. (2015) Activation of ATP citrate lyase by mTOR signal induces disturbed lipid metabolism in hepatitis B virus pre-S2 mutant tumorigenesis. J Virol 89: 605–614. doi: 10.1128/JVI.02363-14
    [48] Loguercio C, Andreone P, Brisc C, et al. (2012) Silybin combined with phosphatidylcholine and vitamin E in patients with nonalcoholic fatty liver disease: A randomized controlled trial. Free Radical Biol Med 52: 1658–1665. doi: 10.1016/j.freeradbiomed.2012.02.008
    [49] Polyak SJ, Morishima C, Lohmann V, et al. (2010) Identification of hepatoprotective flavonolignans from silymarin. Proc Natl Acad Sci U S A 107: 5995–5999. doi: 10.1073/pnas.0914009107
    [50] Jang M, Cai L, Udeani GO, et al. (1997) Cancer chemopreventive activity of resveratrol, a natural product derived from grapes. Science 275: 218–220. doi: 10.1126/science.275.5297.218
    [51] Gusman J, Malonne H, Atassi G (2001) A reappraisal of the potential chemopreventive and chemotherapeutic properties of resveratrol. Carcinogenesis 22: 1111–1117. doi: 10.1093/carcin/22.8.1111
    [52] Fulda S (2010) Resveratrol and derivatives for the prevention and treatment of cancer. Drug Discovery Today 15: 757–765. doi: 10.1016/j.drudis.2010.07.005
    [53] Guarente L (2006) Sirtuins as potential targets for metabolic syndrome. Nature 444: 868–874. doi: 10.1038/nature05486
    [54] Lekli I, Ray D, Das DK (2010) Longevity nutrients resveratrol, wines and grapes. Genes Nutr 5: 55–60. doi: 10.1007/s12263-009-0145-2
    [55] Teng CF, Hsieh WC, Wu HC, et al. (2015) Hepatitis B Virus Pre-S2 Mutant Induces Aerobic Glycolysis through Mammalian Target of Rapamycin Signal Cascade. PLoS One 10: e0122373. doi: 10.1371/journal.pone.0122373
  • Reader Comments
  • © 2018 the Author(s), licensee AIMS Press. This is an open access article distributed under the terms of the Creative Commons Attribution License (http://creativecommons.org/licenses/by/4.0)
通讯作者: 陈斌, bchen63@163.com
  • 1. 

    沈阳化工大学材料科学与工程学院 沈阳 110142

  1. 本站搜索
  2. 百度学术搜索
  3. 万方数据库搜索
  4. CNKI搜索

Metrics

Article views(9224) PDF downloads(1079) Cited by(5)

/

DownLoad:  Full-Size Img  PowerPoint
Return
Return

Catalog