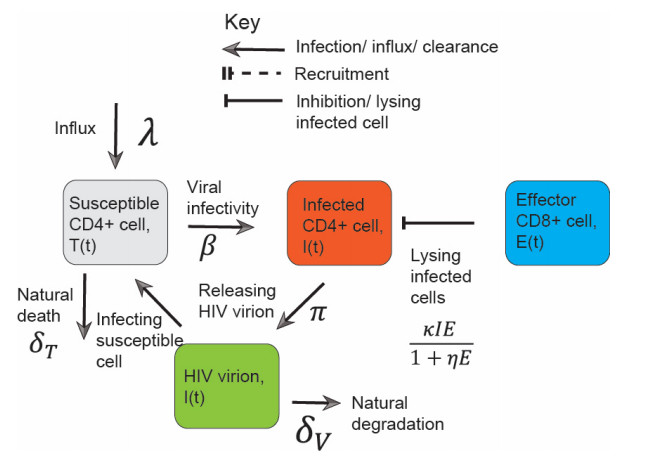
Effector CD8+ cells lyse human immunodeficiency viruses (HIV)-infected CD4+ cells by recognizing a viral peptide presented by human leukocyte antigens (HLA) on the CD4+ cell surface, which plays an irreplaceable role in within-host HIV clearance. Using a semi-saturated lysing efficiency of a CD8+ cell, we discuss a model that captures HIV dynamics with different magnitudes of lysing rate induced by different HLA alleles. With the aid of local stability analysis and bifurcation plots, exponential interactions among CD4+ cells, HIV, and CD8+ cells were investigated. The system exhibited unexpectedly complex behaviors that were both mathematically and biologically interesting, for example monostability, periodic oscillations, and bistability. The CD8+ cell lysing rate, the CD8+ cell count, and the saturation effect were combined to determine the HIV kinetics. For a given CD8+ cell count, a low CD8+ cell lysing rate and a high saturation effect led to monostability to a high viral titre, and a low CD8+ cell lysing rate and a low saturation effect triggered periodic oscillations; this explained why patients with a non-protective HLA allele were always associated with a high viral titer and exhibited bad infection control. On the other hand, a high CD8+ cell lysing rate led to bistability and monostability to a low viral titer; this explained why protective HLA alleles are not always associated with good HIV infection outcomes. These mathematical results explain how differences in HLA alleles determine the variability in viral infection.
Citation: Shilian Xu. Saturated lysing efficiency of CD8+ cells induced monostable, bistable and oscillatory HIV kinetics[J]. Mathematical Biosciences and Engineering, 2024, 21(10): 7373-7393. doi: 10.3934/mbe.2024324
Effector CD8+ cells lyse human immunodeficiency viruses (HIV)-infected CD4+ cells by recognizing a viral peptide presented by human leukocyte antigens (HLA) on the CD4+ cell surface, which plays an irreplaceable role in within-host HIV clearance. Using a semi-saturated lysing efficiency of a CD8+ cell, we discuss a model that captures HIV dynamics with different magnitudes of lysing rate induced by different HLA alleles. With the aid of local stability analysis and bifurcation plots, exponential interactions among CD4+ cells, HIV, and CD8+ cells were investigated. The system exhibited unexpectedly complex behaviors that were both mathematically and biologically interesting, for example monostability, periodic oscillations, and bistability. The CD8+ cell lysing rate, the CD8+ cell count, and the saturation effect were combined to determine the HIV kinetics. For a given CD8+ cell count, a low CD8+ cell lysing rate and a high saturation effect led to monostability to a high viral titre, and a low CD8+ cell lysing rate and a low saturation effect triggered periodic oscillations; this explained why patients with a non-protective HLA allele were always associated with a high viral titer and exhibited bad infection control. On the other hand, a high CD8+ cell lysing rate led to bistability and monostability to a low viral titer; this explained why protective HLA alleles are not always associated with good HIV infection outcomes. These mathematical results explain how differences in HLA alleles determine the variability in viral infection.

| [1] |
L. Bekker, C. Beyrer, N. Mgodi, S. R. Lewin, S. Delany-Moretlwe, B. Taiwo, et al., HIV infection, Nat. Rev. Dis. Primers, 9 (2023), 42. https://doi.org/10.1038/s41572-023-00452-3 doi: 10.1038/s41572-023-00452-3

|
| [2] |
S. G. Deeks, J. Overbaugh, A. Phillips, S. Buchbinder, HIV infection, Nat. Rev. Dis. Primers, 1 (2015), 15035. https://doi.org/10.1038/nrdp.2015.35 doi: 10.1038/nrdp.2015.35
|
| [3] |
R. T. Gandhi, R. Bedimo, J. F. Hoy, R. J. Landovitz, D. M. Smith, E. F. Eaton, et al., Antiretroviral drugs for treatment and prevention of HIV Infection in Adults: 2022 recommendations of the International Antiviral Society–USA Panel, JAMA, 329 (2023), 63–84. https://doi.org/10.1001/jama.2022.22246 doi: 10.1001/jama.2022.22246
|
| [4] | V. Montessori, N. Press, M. Harris, L. Akagi, J. S. G. Montaner, Adverse effects of antiretroviral therapy for HIV infection, CMAJ, 170 (2004), 229–238. |
| [5] |
C. A. Dendrou, J. Petersen, J. Rossjohn, L. Fugger, HLA variation and disease, Nat. Rev. Immunol., 18 (2018), 325–339. https://doi.org/10.1038/nri.2017.143 doi: 10.1038/nri.2017.143
|
| [6] |
S. Medhasi, N. Chantratita, Human leukocyte antigen (HLA) system: Genetics and association with bacterial and viral infections, J. Immunol. Res., 2022 (2022), 9710376. https://doi.org/10.1155/2022/9710376 doi: 10.1155/2022/9710376
|
| [7] |
Y. M. Mosaad, Clinical role of human leukocyte antigen in health and disease, Scand. J. Immunol., 82 (2015), 283–306. https://doi.org/10.1111/sji.12329 doi: 10.1111/sji.12329
|
| [8] |
M. Borrell, I. Fernández, F. Etcheverrry, A. Ugarte, M. Plana, L. Leal, et al., High rates of long-term progression in HIV-1-positive elite controllers, J. Int. AIDS Soc., 24 (2021), e25675. https://doi.org/10.1002/jia2.25675 doi: 10.1002/jia2.25675
|
| [9] |
B. A. Woldemeskel, A. K. Kwaa, J. N. Blankson, Viral reservoirs in elite controllers of HIV-1 infection: Implications for HIV cure strategies, eBioMedicine, 62 (2020), 103118. https://doi.org/10.1016/j.ebiom.2020.103118 doi: 10.1016/j.ebiom.2020.103118
|
| [10] |
D. R. Collins, G. D. Gaiha, B. D. Walker, CD8+ T cells in HIV control, cure and prevention, Nat. Rev. Immunol., 20 (2020), 471–482. https://doi.org/10.1038/s41577-020-0274-9 doi: 10.1038/s41577-020-0274-9
|
| [11] |
B. Monel, A. McKeon, P. Lamothe-Molina, P. Jani, J. Boucau, Y. Pacheco, et al., HIV controllers exhibit effective CD8(+) T cell recognition of HIV-1-infected non-activated CD4(+) T cells, Cell Rep., 27 (2019), 142–153. https://doi.org/10.1016/j.celrep.2019.03.016 doi: 10.1016/j.celrep.2019.03.016
|
| [12] |
S. A. Migueles, D. Mendozaa, M. G. Zimmermana, K. M. Martinsa, S. A. Toulmina, E. P. Kelly, et al., CD8+ T-cell cytotoxic capacity associated with human immunodeficiency virus-1 control can be mediated through various epitopes and human leukocyte antigen types, eBioMedicine, 2 (2015), 46–58. http://dx.doi.org/10.1016/j.ebiom.2014.12.009 doi: 10.1016/j.ebiom.2014.12.009
|
| [13] |
A. R. Hersperger, J. N. Martin, L. Y. Shin, P. M. Sheth, C. M. Kovacs, G. L. Cosma, et al., Increased HIV-specific CD8+ T-cell cytotoxic potential in HIV elite controllers is associated with T-bet expression, Blood, 117 (2011), 3799–3808. https://doi.org/10.1182/blood-2010-12-322727 doi: 10.1182/blood-2010-12-322727
|
| [14] | A. L. Hill, Mathematical models of HIV latency, in Current Topics in Microbiology and Immunology, Springer, 417 (2018), 131–156. https://doi.org/10.1007/82_2017_77 |
| [15] | S. Xu, Modelling the Interaction of Influenza Virus and its Antibody, Ph.D thesis, Monash University, 2022. |
| [16] |
P. Cao, Z. Wang, A. W. Yan, J. McVernon, J. Xu, J. M. Heffernan, et al., On the role of CD8+ T cells in determining recovery time from influenza virus infection, Front. Immunol., 7 (2016), 611. https://doi.org/10.3389/fimmu.2016.00611 doi: 10.3389/fimmu.2016.00611
|
| [17] |
S. M. Ciupe, R. M. Ribeiro, P. W. Nelson, A. S. Perelson, Modeling the mechanisms of acute hepatitis B virus infection, J. Theor. Biol., 247 (2007), 23–35. https://doi.org/10.1016/j.jtbi.2007.02.017 doi: 10.1016/j.jtbi.2007.02.017
|
| [18] |
A. Amoddeo, A mathematical model and numerical simulation for SARS-CoV-2 dynamics, Sci. Rep., 13 (2023), 4575. https://doi.org/10.1038/s41598-023-31733-2 doi: 10.1038/s41598-023-31733-2
|
| [19] |
V. V. Ganusov, D. L. Barber, R. J. De Boer, Killing of targets by CD8+ T cells in the mouse spleen follows the law of mass action, PLOS ONE, 6 (2011), e15959. https://doi.org/10.1371/journal.pone.0015959 doi: 10.1371/journal.pone.0015959
|
| [20] |
M. A. Myers, A. P. Smith, L. C. Lane, D. J. Moquin, R. Aogo, S. Woolard, et al., Dynamically linking influenza virus infection kinetics, lung injury, inflammation, and disease severity, eLife, 10 (2021), e68864. https://doi.org/10.7554/eLife.68864 doi: 10.7554/eLife.68864
|
| [21] |
S. Xu, Modelling role of protective and nonprotective HLA allele inducing different HIV infection outcomes, Bull. Math. Biol., 86 (2024), 107. https://doi.org/10.1007/s11538-024-01334-9 doi: 10.1007/s11538-024-01334-9
|
| [22] |
C. L. Althaus, R. J. De Boer, Implications of CTL-mediated killing of HIV-infected cells during the non-productive stage of infection, PLOS ONE, 6 (2011), e16468. https://doi.org/10.1371/journal.pone.0016468 doi: 10.1371/journal.pone.0016468
|
| [23] |
D. Burg, L. Rong, A. U. Neumann, H. Dahari, Mathematical modeling of viral kinetics under immune control during primary HIV-1 infection, J. Theor. Biol., 259 (2009), 751–759. https://doi.org/10.1016/j.jtbi.2009.04.010 doi: 10.1016/j.jtbi.2009.04.010
|
| [24] |
R. Malka, B. Wolach, R. Gavrieli, E. Shochat, V. Rom-Kedar, Evidence for bistable bacteria-neutrophil interaction and its clinical implications, J. Clin. Invest., 122 (2012), 3002–3011. https://doi.org/10.1172/JCI59832 doi: 10.1172/JCI59832
|
| [25] |
N. Frenkel, R. S. Dover, E. Titon, Y. Shai, V. Rom-Kedar, Bistable bacterial growth dynamics in the presence of antimicrobial agents, Antibiotics, 10 (2021), 87. https://doi.org/10.3390/antibiotics10010087 doi: 10.3390/antibiotics10010087
|
| [26] |
S. Xu, J. Yang, C. Yin, X. Zhao, The dominance of bacterial genotypes leads to susceptibility variations under sublethal antibiotic pressure, Future Microbiol., 13 (2018), 165–185. https://doi.org/10.2217/fmb-2017-0070 doi: 10.2217/fmb-2017-0070
|
| [27] |
S. Wang, H. Li, F. Xu, Monotonic and nonmonotonic immune responses in viral infection systems, Discrete Contin. Dyn. Syst. B, 27 (2022), 141–165. https://doi.org/10.3934/dcdsb.2021035 doi: 10.3934/dcdsb.2021035
|
| [28] |
Q. Song, S. Wang, F. Xu, Robustness and bistability in a cytokine-enhanced viral infection model, Appl. Math. Lett., 158 (2024), 109215. https://doi.org/10.1016/j.aml.2024.109215 doi: 10.1016/j.aml.2024.109215
|
| [29] |
S. Wang, T. Wang, F. Xu, L. Rong, Bistability of an HIV model with immune impairment, SIAM J. Appl. Dyn. Syst., 23 (2024), 1108–1132. https://doi.org/10.1137/23M1596004 doi: 10.1137/23M1596004
|
| [30] |
R. Luo, M. J. Piovoso, J. Martinez-Picado, R. Zurakowski, HIV model parameter estimates from interruption trial data including drug efficacy and reservoir dynamics, PLOS ONE, 7 (2012), e40198. https://doi.org/10.1371/journal.pone.0040198 doi: 10.1371/journal.pone.0040198
|
| [31] |
H. Mohri, A. S. Perelson, K. Tung, R. M. Ribeiro, B. Ramratnam, M. Markowitz, et al., Increased turnover of T lymphocytes in HIV-1 infection and its reduction by antiretroviral therapy, J. Exp. Med., 194 (2001), 1277–1288. https://doi.org/10.1084/jem.194.9.1277 doi: 10.1084/jem.194.9.1277
|
| [32] |
G. Doitsh, M. Cavrois, K. G. Lassen, O. Zepeda, Z. Yang, M. L. Santiago, et al., Abortive HIV infection mediates CD4 T cell depletion and inflammation in human lymphoid tissue, Cell, 143 (2010), 789–801. https://doi.org/10.1016/j.cell.2010.11.001 doi: 10.1016/j.cell.2010.11.001
|
| [33] |
M. Markowitz, M. Louie, A. Hurley, E. Sun, M. Di Mascio, A. S. Perelson, et al., A novel antiviral intervention results in more accurate assessment of human immunodeficiency virus type 1 replication dynamics and T-cell decay in vivo, J. Virol., 77 (2003), 5037–5038. https://doi.org/10.1128/jvi.77.8.5037-5038.2003 doi: 10.1128/jvi.77.8.5037-5038.2003
|
| [34] |
H. Y. Chen, M. Di Mascio, A. S. Perelson, D. D. Ho, L. Zhang, Determination of virus burst size in vivo using a single-cycle SIV in rhesus macaques, PNAS, 104 (2007), 19079–19084. https://doi.org/10.1073/pnas.0707449104 doi: 10.1073/pnas.0707449104
|
| [35] | B. Ramratnam, S. Bonhoeffer, J. Binley, A. Hurley, L. Zhang, J. E. Mittler, et al., Rapid production and clearance of HIV-1 and hepatitis C virus assessed by large volume plasma apheresis, Lancet, 354 (1999), 1782–1785. |
| [36] |
M. Helleberg, G. Kronborg, H. Ullum, L. P. Ryder, N. Obel, J. Gerstoft, Course and clinical significance of CD8+ T-cell counts in a large cohort of HIV-infected individuals, J. Infect. Dis., 211 (2015), 1726–1734. https://doi.org/10.1093/infdis/jiu669 doi: 10.1093/infdis/jiu669
|
| [37] | R. S. Sauls, C. McCausland, B. N. Taylor, Histology, T-Cell Lymphocyte, StatPearls Publishing, 2024. |
| [38] | S. Ruan, J. Wei, On the zeros of transcendental functions with applications to stability of delay differential equations with two delays, Dyn. Contin. Discrete and Impulsive Syst. Ser. A, 10 (2003), 863–874. |


Figures(10) / Tables(1)

Shilian Xu. Saturated lysing efficiency of CD8+ cells induced monostable, bistable and oscillatory HIV kinetics[J]. Mathematical Biosciences and Engineering, 2024, 21(10): 7373-7393. doi: 10.3934/mbe.2024324


 DownLoad: