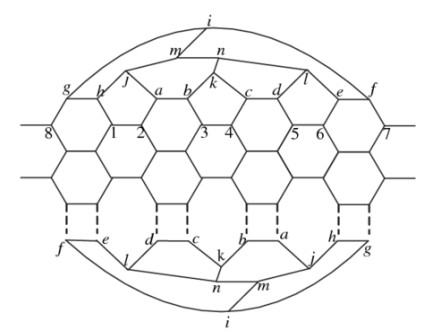
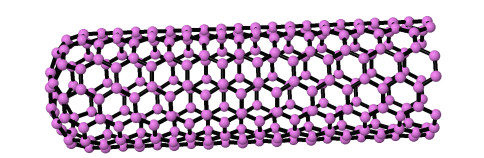
Manufacturing relatively inexpensive items in every area of engineering and science is the major focus of exploration resultant the world's contemporary economic setback. Making small-sized items that are inexpensive and lightweight while providing high quality is critical in today's and tomorrow's worlds. Nanotechnology has a significant role to play in this situation. Nano-objects or, in general, nanomaterials are especially preferred; nanotubes, especially those comprised of carbon, are one of the most popular types of nanostructures, and they are applied in a variety of chemical, biological and technical applications. This notion prompted us to investigate their many physical and chemical characteristics. We utilized topological descriptors to evaluate diverse nanotube structures such as armchair carbon and semi-capped nanotubes by using vertex-edge based indices to characterize distinct chemical structures via numerical quantitative analysis. Furthermore, we examined uncapped and semi-capped armchair carbon nanotubes and achieved adequate comparative findings.
Citation: Qingqun Huang, Ali Ahmad, Muhammad Kamran Jamil, Ricai Luo, Muhammad Azeem. Comparative study of vertex-edge based indices for semi-capped carbon nanotubes[J]. Mathematical Biosciences and Engineering, 2022, 19(12): 12303-12315. doi: 10.3934/mbe.2022573
Manufacturing relatively inexpensive items in every area of engineering and science is the major focus of exploration resultant the world's contemporary economic setback. Making small-sized items that are inexpensive and lightweight while providing high quality is critical in today's and tomorrow's worlds. Nanotechnology has a significant role to play in this situation. Nano-objects or, in general, nanomaterials are especially preferred; nanotubes, especially those comprised of carbon, are one of the most popular types of nanostructures, and they are applied in a variety of chemical, biological and technical applications. This notion prompted us to investigate their many physical and chemical characteristics. We utilized topological descriptors to evaluate diverse nanotube structures such as armchair carbon and semi-capped nanotubes by using vertex-edge based indices to characterize distinct chemical structures via numerical quantitative analysis. Furthermore, we examined uncapped and semi-capped armchair carbon nanotubes and achieved adequate comparative findings.

| [1] |
S. Iijima, Helical microtubules of graphitic carbon, Nature, 354 (1991), 56–58. https://doi.org/10.1038/354056a0 doi: 10.1038/354056a0

|
| [2] | M. F. Thorpe, D. Tománek, R. J. Enbody, Science and Application of Nanotubes, Springer, 2002. |
| [3] |
U. Kuhlmann, H. Jantoljak, N. Pfander, P. Bernier, C. Journet, C. Thomsen, Infrared active phonons in single-walled carbon nanotubes, Chem. Phys. Lett., 294 (1998), 237–240. https://doi.org/10.1016/S0009-2614(98)00845-8 doi: 10.1016/S0009-2614(98)00845-8
|
| [4] | P. Mlynarska, S. Tomczewski, A. Pakuła, G. Wróblewski, M. Sloma, L. Salbut, Detection of subsurface defects and measurement of thickness of screen layers made of graphene and carbon nanotubes with application of full-field optical coherence tomography in linnik configuration, in Optical Manufacturing and Testing XI, 9575 (2015), 246–251. https://doi.org/10.1117/12.2188640 |
| [5] | J. Tang, Y. Wang, S. Cheng, P. Yu, K. Huang, C. Yuan, Applications of single-walled carbon nanotubes and type-II quantum dots in photovoltaics and passive mode-locking saturable absorbers, in Carbon Nanotubes, Graphene, and Associated Devices V, 8462 (2012), 108–119. https://doi.org/10.1117/12.928211 |
| [6] | P. Li, W. Xue, Dielectrophoretic assembly of organized carbon nanotubes and thin films, in ASME International Mechanical Engineering Congress and Exposition, 44496 (2010), 49–54. https://doi.org/10.1115/IMECE2010-37441 |
| [7] | R. P. Raffaelle, B. Landi, T. Gennett, R. S. Morris, B. Dixon, P. Lamarre, Fuel cell applications of single wall carbon nanotubes, in International Conference on Fuel Cell Science, Engineering and Technology, 36681 (2003), 121–128. https://doi.org/10.1115/FUELCELL2003-1708 |
| [8] | S. A. Bakar, S. Muhamad, A. A. Aziz, N. A. Asli, M. Mohammad, M. S. Shamsudin, et al., CVD growth of carbon nanotubes from palm oil precursor, in 2012 IEEE Symposium on Business, Engineering and Industrial Applications, IEEE, (2012), 377–381. https://doi.org/10.1109/ISBEIA.2012.6422908 |
| [9] | E. V. Antoniadou, B. G. Cousins, A. M. Seifalian, Development of conductive polymer with carbon nanotubes for regenerative medicine applications, in 2010 Annual International Conference of the IEEE Engineering in Medicine and Biology, IEEE, (2010), 815–818. https://doi.org/10.1109/IEMBS.2010.5626760 |
| [10] | R. Sen, T. Kocab, J. Black, J. McDermott, S. K. Pal, S. Buffat, et al., Engineering nanomaterials and nanostructures for electronic applications: A case study of carbon nanotubes for memory devices, in 2020 4th IEEE Electron Devices Technology $ & $ Manufacturing Conference (EDTM), IEEE, (2020). https://doi.org/10.1109/EDTM47692.2020.9117911 |
| [11] | C. A. C. Abdullah, E. L. Albert, Carbon nanotubes as biological transporters and tissue-engineering scaffolds, in Synthesis, Technology and Applications of Carbon Nanomaterials, Elsevier, (2019), 135–156. https://doi.org/10.1016/B978-0-12-815757-2.00006-1 |
| [12] | N. Mamidi, Cytotoxicity evaluation of carbon nanotubes for biomedical and tissue engineering applications, in Perspective of Carbon Nanotubes, IntechOpen, 2019. |
| [13] | M. K. Assadi, H. Hanaei, Transparent carbon nanotubes (CNTs) as antireflection and self-cleaning solar cell coating, in Engineering Applications of Nanotechnology, Springer, Cham, (2017), 101–114. https://doi.org/10.1007/978-3-319-29761-3_4 |
| [14] |
P. J. Britto, K. S. V. Santhanam, A. Rubio, J. A. Alonso, P. M. Ajayan, Improved charge transfer at carbon nanotube electrodes, Adv. Mater., 11 (1999), 154–157. https://doi.org/10.1002/(SICI)1521-4095(199902)11:2<154::AID-ADMA154>3.0.CO;2-B doi: 10.1002/(SICI)1521-4095(199902)11:2<154::AID-ADMA154>3.0.CO;2-B
|
| [15] |
G. A. Rivas, M. D. Rubianes, M. C. Rodríguez, N. F. Ferreyra, G. L. Luque, M. L. Pedano, et al., Carbon nanotubes for electrochemical biosensing, Talanta, 74 (2007), 291–307. https://doi.org/10.1016/j.talanta.2007.10.013 doi: 10.1016/j.talanta.2007.10.013
|
| [16] |
A. J. S. Ahammad, J. J. Lee, Md. A. Rahman, Electrochemical sensors based on carbon nanotubes, Sensors, 9 (2009), 2289–2319. https://doi.org/10.3390/s90402289 doi: 10.3390/s90402289
|
| [17] |
A. N. Ribeiro, N. S. Ferreira. Systematic study of the physical origin of ferromagnetism in CeO2- nanoparticles, Phys. Rev. B, 95 (2017), 144430. https://doi.org/10.1103/PhysRevB.95.144430 doi: 10.1103/PhysRevB.95.144430
|
| [18] |
E. N. Tseng, Y. T. Hsiao, Y. C. Chen, S. Y. Chen, A. Gloter, J. M. Song, Magnetism and plasmonic performance of mesoscopic hollow ceria spheres decorated with silver nanoparticles, Nanoscale, 11 (2019), 3574–3582. https://doi.org/10.1039/C8NR09636H doi: 10.1039/C8NR09636H
|
| [19] | S. A. Holgate, Understanding Solid State Physics, CRC Press, 2009. |
| [20] |
H. W. Kroto, J. R. Heath, S. C. O'Brien, R. F. Curl, R. E. Smalley, C60: Buckminsterfullerene, Nature, 318 (1985), 162–163. https://doi.org/10.1038/318162a0 doi: 10.1038/318162a0
|
| [21] | A. Younis, D. Chu, S. Li, Cerium oxide nanostructures and their applications, in Functionalized Nanomaterials, InTech, 2016. |
| [22] |
S. T. R. Naqvi, B. Shirinfar, S. Majeed, M. N. Haq, D. Hussain, T. Iqbal, et al., Synthesis, design and sensing applications of nanostructured ceria-based materials, Analyst., 143 (2018), 5610–5628. https://doi.org/10.1039/c8an01268g doi: 10.1039/c8an01268g
|
| [23] |
A. Dhall, W. Self, Cerium oxide nanoparticles: A brief review of their synthesis methods and biomedical applications, Antioxidants, 7 (2018), 97. https://doi.org/10.3390/antiox7080097 doi: 10.3390/antiox7080097
|
| [24] | S. Borgmann, A. Schulte, S. Neugebauer, W. Schuhmann, Amperometric biosensors, in Advances in Electrochemical Sciences and Engineering, (2012), 1–83. |
| [25] | E. N. Primo, F. Gutiérrez, M. D. Rubianes, N. F. Ferreyra, M. C. Rodríguez, M. L. Pedano, et al., Electrochemistry in one dimension: Applications of carbon nanotubes, in Advances in Electrochemical Sciences and Engineering, 2015 (2015), 83–120. https://doi.org/10.1002/9783527697489.ch3 |
| [26] |
H. Wiener, Structural determination of paraffin boiling points, J. Am. Chem. Soc., 69 (1947), 17–20. https://doi.org/10.1021/ja01193a005 doi: 10.1021/ja01193a005
|
| [27] |
S. B. Chen, A. Rauf, M. Ishtiaq, M. Naeem, A. Aslam, On ve-degree- and ev-degree-based topological properties of crystallographic structure of cuprite Cu2o, Open Chem., 19 (2021), 576–5851. https://doi.org/10.1515/chem-2021-0051 doi: 10.1515/chem-2021-0051
|
| [28] |
S. Ediz, A new tool for QSPR researches: ev-degree randić index, Celal Bayar Univ. J. Sci., 13 (2017), 615–618. https://doi.org/10.1177/1559827617729634 doi: 10.1177/1559827617729634
|
| [29] | S. Ediz, On ve-degree molecular topological properties of silicate and oxygen networks, Int. J. Comput. Sci. Math., 9 (2018). https://doi.org/10.1504/ijcsm.2018.10011733 |
| [30] | B. Sahin, S. Ediz, On ev-degree and ve-degree topological indices, Iran. J. Math. Chem., 9 (2018). |
| [31] |
M. Chellali, T. W. Haynes, S. T. Hedetniemi, T. M. Lewis, On ve-degrees and ev-degrees in graphs, Discrete Math., 340 (2007), 31–38. https://doi.org/10.4028/www.scientific.net/KEM.340-341.31 doi: 10.4028/www.scientific.net/KEM.340-341.31
|
| [32] |
M. F. Nadeem, M. Azeem, I. Farman, Comparative study of topological indices for capped and uncapped carbon nanotubes, Polycyclic Aromat. Compd., 2021 (2021), 1–18. https://doi.org/10.1080/10406638.2021.1903952 doi: 10.1080/10406638.2021.1903952
|
| [33] |
M. F. Nadeem, M. Azeem, H. M. A.Siddiqui, Comparative study of zagreb indices for capped, semi-capped, and uncapped carbon nanotubes, Polycyclic Aromat. Compd., 2021 (2021), 1–18. https://doi.org/10.1080/10406638.2021.1890625 doi: 10.1080/10406638.2021.1890625
|
| [34] |
M. F. Nadeem, M. Imran, H. M. A. Siddiqui, M. Azeem, A. Khalil, Y. Ali, Topological aspects of metal-organic structure with the help of underlying networks, Arabian J. Chem., 14 (2021), 103157. https://doi.org/10.1016/j.arabjc.2021.103157 doi: 10.1016/j.arabjc.2021.103157
|
| [35] |
W. Gao, M. R. Farahani, Degree-based indices computation for special chemical molecular structures using edge dividing method, Appl. Math. Nonlinear Sci., 1 (2016), 99–122. https://doi.org/10.21042/AMNS.2016.1.00009 doi: 10.21042/AMNS.2016.1.00009
|
| [36] |
S. Hayat, M. A. Malik, M. Imran, Computing topological indices of honeycomb derived networks, Rom. J. Inf. Sci. Technol., 18 (2015), 144–165. https://doi.org/10.1525/nr.2015.18.3.144 doi: 10.1525/nr.2015.18.3.144
|
| [37] |
A. Ahmad, Computation of certain topological properties of para-line graph of honeycomb networks and graphene, Discrete Math. Algorithms Appl., 9 (2017), 1750064. https://doi.org/10.1142/S1793830917500641 doi: 10.1142/S1793830917500641
|
| [38] |
A. N. A. Koam, A. Ahmad, M. F. Nadeem, Comparative study of valency-based topological descriptor for hexagon star network, Comput. Syst. Sci. Eng., 36 (2021), 293–306. https://doi.org/10.32604/csse.2021.014896 doi: 10.32604/csse.2021.014896
|
| [39] | A. N. A. Koam, A. Ahmad, A. A. H. Ahmadini, Computation of vertex-edge degree based topological descriptors for hex-derived network, IEEE Access, 9 (2021), 82989–83001. https://doi.org/10.1109/ACCESS.2021.3086451 |
| [40] | A. Ahmad, R. Hasni, K. Elahi, M. A. Asim, Polynomials of degree-based indices for swapped networks modeled by optical transpose interconnection system, IEEE Access, 8 (2020), 214293–214299. https://doi.org/10.1109/ACCESS.2020.3039298 |
| [41] | A. Shabbir, M. F. Nadeem, S. Mukhtar, A. Raza, On edge version of some degree-based topological indices of HAC5c7 [p, q] and VC5c7[p, q] nanotubes, Polycyclic Aromat. Compd., (2020), 1–17. https://doi.org/10.1080/10406638.2020.1753220 |
| [42] | N. Zahra, M. Ibrahim, M. K. Siddiqui, On topological indices for swapped networks modeled by optical transpose interconnection system, IEEE Access, 8 (2020), 200091–200099. https://doi.org/10.1109/ACCESS.2020.3034439 |
| [43] |
B. Horoldagva, K. C. Das, T. A. Selenge, On ve-degree and ev-degree of graphs, Discrete Optim., 31 (2019), 1–7. https://doi.org/10.1016/j.disopt.2018.07.002 doi: 10.1016/j.disopt.2018.07.002
|
| [44] |
J. Zhang, M. K. Siddiqui, A. Rauf, M. Ishtiaq, On ve-degree and ev-degree based topological properties of single walled titanium dioxide nanotube, J. Cluster Sci., 32 (2020), 821–832. https://doi.org/10.1007/s10876-020-01842-3 doi: 10.1007/s10876-020-01842-3
|
| [45] | F. A. Abolaban, A. Ahmad, M. A. Asim, Computation of vertex-edge degree based topological descriptors for metal trihalides network, IEEE Access, 9 (2021), 65330–65339. https://doi.org/10.1109/ACCESS.2021.3076036 |
| [46] |
E. A. Refaee, A. Ahmad, A study of hexagon star network with vertex-edge-based topological descriptors, Complexity, 2021 (2021), 9911308. https://doi.org/10.1155/2021/9911308 doi: 10.1155/2021/9911308
|
| [47] |
H. Raza, M. Waheed, M. K. Jamil, M. Azeem, Structures devised by the generalizations of two graph operations and their topological descriptors, Main Group Met. Chem., 45 (2022), 44–56. https://doi.org/10.1515/mgmc-2022-0006 doi: 10.1515/mgmc-2022-0006
|
| [48] |
A. N. A. H. Ahmad, A. Ahmad, M. Azeem, Computation of edge- and vertex-degree-based topological indices for tetrahedral sheets of clay minerals, Main Group Met. Chem., 45 (2022), 26–34. https://doi.org/10.1515/mgmc-2022-0007 doi: 10.1515/mgmc-2022-0007
|
| [49] | A. Ahmad, Vertex-degree based eccentric topological descriptors of zero divisor graph of commutative rings, Online J. Anal. Comb., 15 (2020), 1–10. |
| [50] | A. Ahmad, On the degree based topological indices of benzene ring embedded in p-type-surface in 2d network, Hacettepe J. Math. Stat., 47 (2018), 9–18. |
| [51] |
A. Ahmad, K. Elahi, R. Hasni, M. F. Nadeem, Computing the degree based topological indices of line graph of benzene ring embedded in p-type-surface in 2d network, J. Inf. Optim. Sci., 40 (2019), 1511–1528. https://doi.org/10.1017/S0144686X19000138 doi: 10.1017/S0144686X19000138
|
| [52] |
A. N. A. Koam, A. Ahmad, M. A. Asim, M. Azeem, Computation of vertex and edge resolvability of benzenoid tripod structure, J. King Saud Univ. Sci., 34 (2022), 102208. https://doi.org/10.1016/j.jksus.2022.102208 doi: 10.1016/j.jksus.2022.102208
|
| [53] |
A. N. A. Koam, A. Ahmad, M. Azeem, A. Khalil, M. F. Nadeem, On adjacency metric dimension of some families of graph, J. Funct. Spaces, 2022 (2022), 6906316. https://doi.org/10.1155/2022/6906316 doi: 10.1155/2022/6906316
|
| [54] |
S. Hameed, M. K. Jamil, M. Waheed, M. Azeem, S. Swaray, Two complex graph operations and their exact formulations on topological properties, Complexity, 2022 (2022), 1–15. https://doi.org/10.1155/2022/6331366 doi: 10.1155/2022/6331366
|
| [55] |
M. Azeem, M. Imran, M. F. Nadeem, Sharp bounds on partition dimension of hexagonal möbius ladder, J. King Saud Univ. Sci., 34 (2022), 101779. https://doi.org/10.1016/j.jksus.2021.101779 doi: 10.1016/j.jksus.2021.101779
|
| [56] | W. Wu, C. Zhang, W. Lin, Q. Chen, X. Guo, Y. Qian, et al., Quantitative structure-property relationship (QSPR) modeling of drug-loaded polymeric micelles via genetic function approximation, PLOS One, 10 (2015), e0119575. https://doi.org/10.1371/journal.pone.0119575 |
| [57] |
X. Zhang, A. Raza, A. Fahad, M. K. Jamil, M. A. Chaudhry, Z. Iqbal, On face index of silicon carbides, Discrete Dyn. Nat. Soc., 2020 (2020), 6048438. https://doi.org/10.1155/2020/6048438 doi: 10.1155/2020/6048438
|
Figures(4) / Tables(5)

Qingqun Huang, Ali Ahmad, Muhammad Kamran Jamil, Ricai Luo, Muhammad Azeem. Comparative study of vertex-edge based indices for semi-capped carbon nanotubes[J]. Mathematical Biosciences and Engineering, 2022, 19(12): 12303-12315. doi: 10.3934/mbe.2022573


 DownLoad: