Purpose: Due to the complex distribution of liver tumors in the abdomen, the accuracy of liver tumor segmentation cannot meet the needs of clinical assistance yet. This paper aims to propose a new end-to-end network to improve the segmentation accuracy of liver tumors from CT. Method: We proposed a hybrid network, leveraging the residual block, the context encoder (CE), and the Attention-Unet, called ResCEAttUnet. The CE comprises a dense atrous convolution (DAC) module and a residual multi-kernel pooling (RMP) module. The DAC module ensures the network derives high-level semantic information and minimizes detailed information loss. The RMP module improves the ability of the network to extract multi-scale features. Moreover, a hybrid loss function based on cross-entropy and Tversky loss function is employed to distribute the weights of the two-loss parts through training iterations. Results: We evaluated the proposed method in LiTS17 and 3DIRCADb databases. It significantly improved the segmentation accuracy compared to state-of-the-art methods. Conclusions: Experimental results demonstrate the satisfying effects of the proposed method through both quantitative and qualitative analyses, thus proving a promising tool in liver tumor segmentation.
Citation: Rongrong Bi, Chunlei Ji, Zhipeng Yang, Meixia Qiao, Peiqing Lv, Haiying Wang. Residual based attention-Unet combing DAC and RMP modules for automatic liver tumor segmentation in CT[J]. Mathematical Biosciences and Engineering, 2022, 19(5): 4703-4718. doi: 10.3934/mbe.2022219
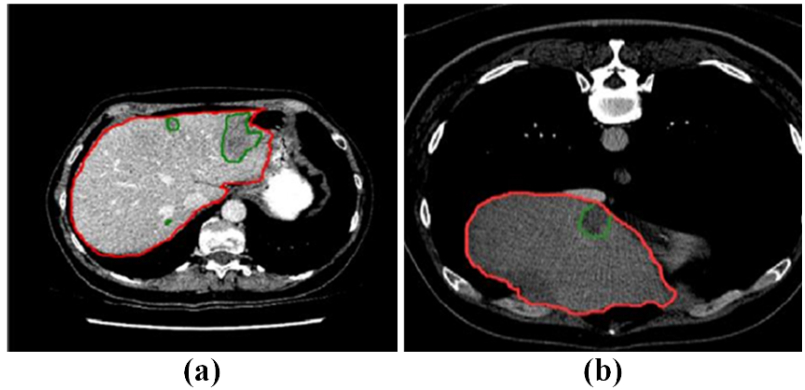
Purpose: Due to the complex distribution of liver tumors in the abdomen, the accuracy of liver tumor segmentation cannot meet the needs of clinical assistance yet. This paper aims to propose a new end-to-end network to improve the segmentation accuracy of liver tumors from CT. Method: We proposed a hybrid network, leveraging the residual block, the context encoder (CE), and the Attention-Unet, called ResCEAttUnet. The CE comprises a dense atrous convolution (DAC) module and a residual multi-kernel pooling (RMP) module. The DAC module ensures the network derives high-level semantic information and minimizes detailed information loss. The RMP module improves the ability of the network to extract multi-scale features. Moreover, a hybrid loss function based on cross-entropy and Tversky loss function is employed to distribute the weights of the two-loss parts through training iterations. Results: We evaluated the proposed method in LiTS17 and 3DIRCADb databases. It significantly improved the segmentation accuracy compared to state-of-the-art methods. Conclusions: Experimental results demonstrate the satisfying effects of the proposed method through both quantitative and qualitative analyses, thus proving a promising tool in liver tumor segmentation.

| [1] |
J. Ferlay, H. R. Shin, F. Bray, D. Forman, C Mathers, D. M. Parkin, Estimates of worldwide burden of cancer in 2008: Globocan 2008, Int. J. Cancer, 27 (2010), 2893–2917. https://doi.org/10.1002/ijc.25516 doi: 10.1002/ijc.25516

|
| [2] |
K. M. Ratheesh, L. K. Seah, V. M. Murukeshan, Spectral phase-based automatic calibration scheme for swept source-based optical coherence tomography systems, Phy. Med. Biol., 21 (2016), 7652. https://doi.org/10.1088/0031-9155/61/21/7652 doi: 10.1088/0031-9155/61/21/7652
|
| [3] |
R. K. Meleppat, M. V. Matham, L. K. Seah, An efficient phase analysis-based wavenumber linearization scheme for swept source optical coherence tomography systems, Laser Phys. Lett., 5 (2015), 055601. https://doi.org/10.1088/1612-2011/12/5/055601 doi: 10.1088/1612-2011/12/5/055601
|
| [4] | R. K. Meleppat, M. V. Matham, L. K. Seah, Optical frequency domain imaging with a rapidly swept laser in the 1300nm bio-imaging window, in International Conference on Optical and Photonic Engineering (ICOPEN 2015), International Society for Optics and Photonics, (2015), 9524: 95242R. https://doi.org/10.1117/12.2190530 |
| [5] |
N. Mu, H. Wang, Y. Zhang, J. Jiang, J. Tang, Progressive global perception and local polishing network for lung infection segmentation of COVID-19 CT images, Pattern Recognit., 120 (2021), 108168. https://doi.org/10.1016/j.patcog.2021.108168 doi: 10.1016/j.patcog.2021.108168
|
| [6] |
F. Zhu, Z. Gao, C. Zhao, Z. Zhu, J. Tang, Y. Liu, et al., Semantic segmentation using deep learning to extract total extraocular muscles and optic nerve from orbital computed tomography images, Optik, 244 (2021), 167551. https://doi.org/10.1016/j.ijleo.2021.167551 doi: 10.1016/j.ijleo.2021.167551
|
| [7] |
C. Zhao, Y. Xu, Z. He, J. Tang, Y. Zhang, J Han, et al., Lung segmentation and automatic detection of COVID-19 using radiomic features from chest CT images, Pattern Recognit., 119 (2021), 108071. https://doi.org/10.1016/j.patcog.2021.108071 doi: 10.1016/j.patcog.2021.108071
|
| [8] | O. Ronneberger, P. Fischer T. Brox, U-net: convolutional networks for biomedical image segmentation, in International Conference on Medical image computing and computer assisted intervention, (2015), 234–241. https://doi.org/10.1007/978-3-319-24574-4_28 |
| [9] | O. Oktay, J. Schlemper, L. L. Folgoc, M. Lee, M. Heinrich, K. Misawa, et al., Attention u-net: learning where to look for the pancreas, preprint, arXiv: 1804.03999. |
| [10] |
L. C. Chen, G. Papandreou, I. Kokkinos, K. Murphy, A. L Yuille, Deep lab: semantic image segmentation with deep convolutional nets, atrous convolution, and fully connected CRFs, IEEE Trans. Pattern Anal. Mach. Intell., 40 (2017), 834–848. https://doi.org/10.1109/TPAMI.2017.2699184 doi: 10.1109/TPAMI.2017.2699184
|
| [11] |
E. Shelhamer, J. Long, T. Darrell, Fully convolutional networks for semantic segmentation, IEEE Trans. Pattern Anal. Mach. Intell, 39 (2016), 640–651. https://doi.org/10.1109/TPAMI.2016.2572683 doi: 10.1109/TPAMI.2016.2572683
|
| [12] | L. C. Chen, G. Papandreou, I. Kokkinos, K. Murphy, A. L. Yuille, Semantic image segmentation with deep convolutional nets and fully connected crfs, preprint, arXiv: 1412.7062. |
| [13] | M. Z. Alom, M. Hasan, C. Yakopcic1, T. M. Taha, V. K. Asari1, Recurrent residual convolutional neural network based on U-Net (R2U-Net) for nedical image segmentation, preprint, arXiv: 1802.06955. |
| [14] |
J. Wang, P. Lv, H. Wang, C. Shi, SAR-U-Net: squeeze-and-excitation block and atrous spatial pyramid pooling based residual U-Net for automatic liver segmentation in Computed Tomography, Comput. Methods Programs Biomed., 208 (2021), 106268. https://doi.org/10.1016/j.cmpb.2021.106268 doi: 10.1016/j.cmpb.2021.106268
|
| [15] | Z. Zhou, M. M. Rahman Siddiquee, N. Tajbakhsh, J. Liang, Unet++: a nested u-net architecture for medical image segmentation, in Deep Learning in Medical Image Analysis and Multimodal Learning for Clinical Decision Support, Springer, Cham, (2018), 3–11. |
| [16] | F. Milletari, N. Navab, S. A. Ahmadi, V-net: fully convolutional neural networks for volumetric medical image segmentation, in 2016 IEEE Fourth International Conference on 3D Vision (3DV), (2016), 565–571. https://doi.org/10.1109/3DV.2016.79 |
| [17] |
X. Li, H. Chen, X. Qi, Q. Dou, C. W. Fu, P. A. Heng, H-DenseUNet: hybrid densely connected UNet for liver and tumor segmentation from CT volumes, IEEE Trans. Med. Imaging, 37 (2018), 2663–2674. https://doi.org/10.1109/TMI.2018.2845918 doi: 10.1109/TMI.2018.2845918
|
| [18] | R. Mehta, J. Sivaswamy, M-net: A convolutional neural network for deep brain structure segmentation, in 2017 IEEE 14th International Symposium on Biomedical Imaging (ISBI 2017), (2017), 437–440. https://doi.org/10.1109/ISBI.2017.7950555 |
| [19] | C. Yu, J. Wang, C. Peng, C. Gao, G. Yu, N. Sang, Bisenet: bilateral segmentation network for real-time semantic segmentation, in Proceedings of the European Conference on Computer Vision (ECCV), (2018), 325–341. https://doi.org/10.1007/978-3-030-01261-8_20 |
| [20] |
Z. Gu, J. Cheng, H. Fu, K. Zhou, H. Hao, Y. Zhao, et al., Ce-net: Context encoder network for 2d medical image segmentation, IEEE Trans. Med. Imaging, 38 (2019), 2281–2292. https://doi.org/10.1109/TMI.2019.2903562 doi: 10.1109/TMI.2019.2903562
|
| [21] | S. Wiesler, H. Ney, A convergence analysis of log-linear training, Adv. Neural Inf. Process. Syst., 24 (2011), 657–665. |
| [22] | E. Vorontsov, A. Tang, C. Pal, S Kadoury, Liver lesion segmentation informed by joint liver segmentation, in 2018 IEEE 15th International Symposium on Biomedical Imaging (ISBI 2018). IEEE, (2018), 1332–1335. https://doi.org/10.1109/ISBI.2018.8363817 |
| [23] | L. Zhou, C. Zhang, M. Wu, D-LinkNet: LinkNet with pretrained encoder and dilated convolution for high resolution satellite imagery road extraction, in Proceedings of the IEEE Conference on Computer Vision and Pattern Recognition Workshops, (2018), 182–186. https://doi.org/10.1109/CVPRW.2018.00034 |


Figures(8) / Tables(4)

Rongrong Bi, Chunlei Ji, Zhipeng Yang, Meixia Qiao, Peiqing Lv, Haiying Wang. Residual based attention-Unet combing DAC and RMP modules for automatic liver tumor segmentation in CT[J]. Mathematical Biosciences and Engineering, 2022, 19(5): 4703-4718. doi: 10.3934/mbe.2022219


 DownLoad: