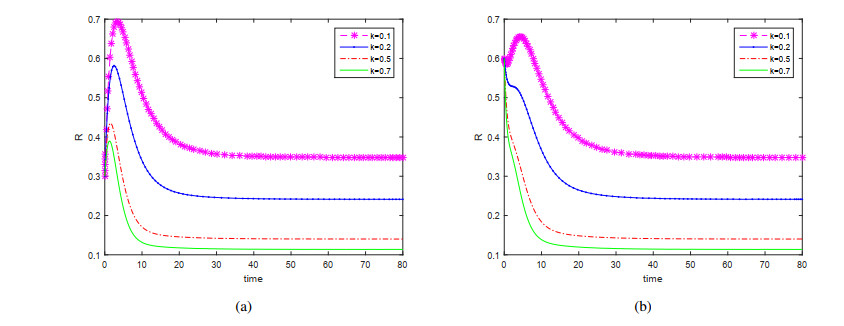
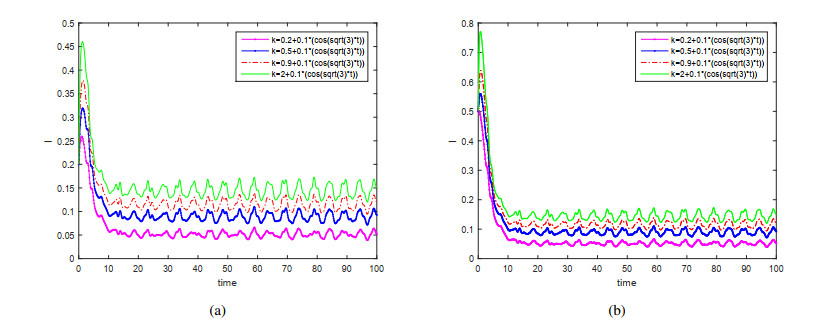
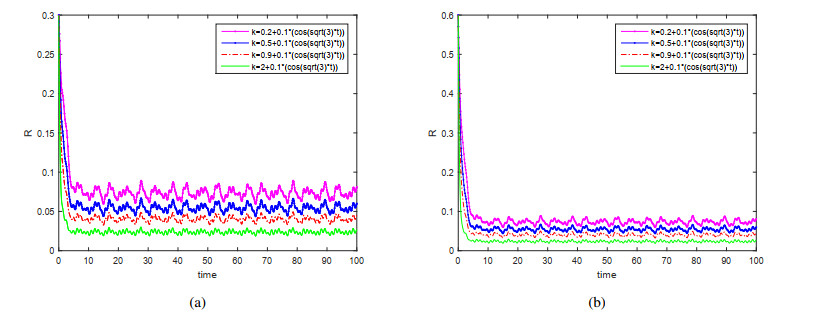
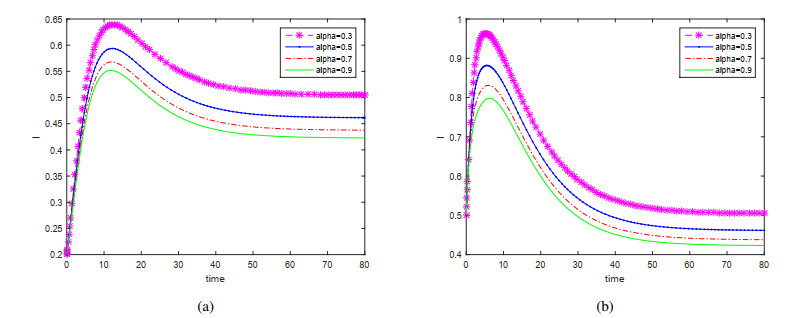
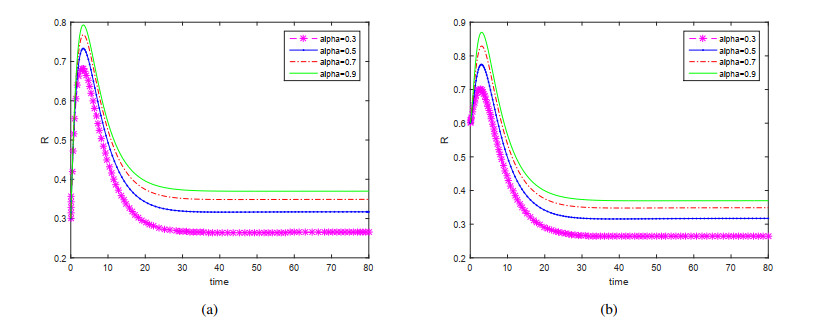
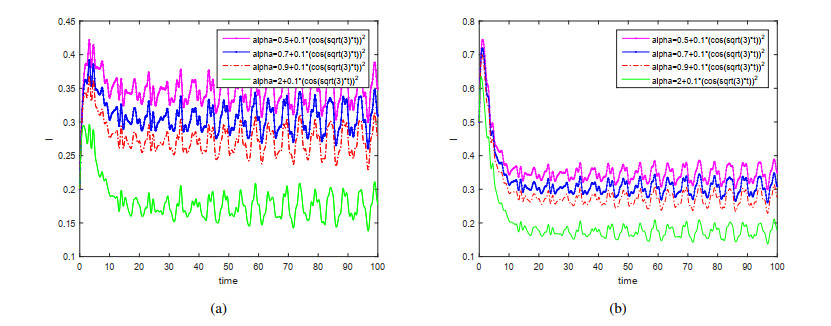
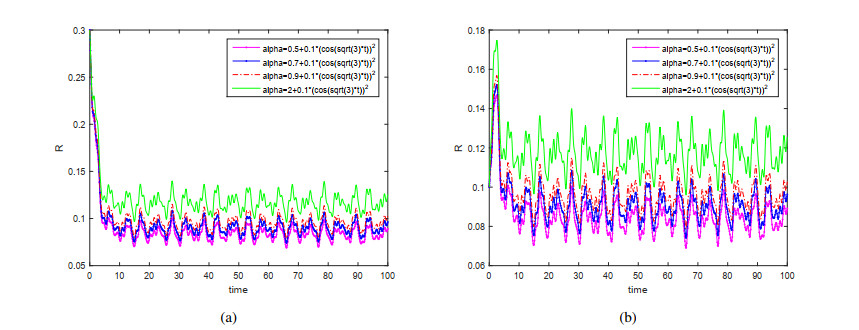
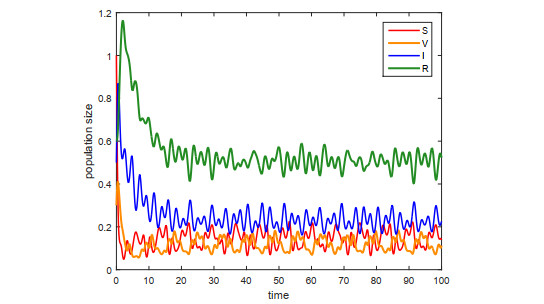
1.
Introduction
As early as the 2nd century AD, the Antonine plague was prevalent in the Roman Empire, causing a rapid population decline and economic deterioration, allowing invaders to take advantage of it and leading to the collapse of the Roman Empire. Between 1519-1530 AD, an epidemic of measles and other infectious diseases reduced Mexico's Indian population from 30 million to 3 million. Since the outbreak of COVID-19, the number of infected people worldwide has reached more than 140 million, many countries have prevented the spread of the virus by reducing people's contact, but these measures have had a huge impact on the economy. These shows that infectious diseases have always been the primary factor affecting human death. Therefore, it is necessary to study the transmission mechanism and the dynamic behavior of epidemics.
Inspired by the Kermack and Mckendricks' original epidemic model [1], the study of mathematical epidemiology has grown rapidly, with a large variety of models having been formulated and applied to infectious diseases. For example, we can see SIS (susceptible-infectious-susceptible) models in [2], the authors considered the global dynamics of the SIS model with delays denoting an incubation time. By constructing a Lyapunov function, they prove stability of a disease-free equilibrium E0 under a condition different from other paper. There are some other SIS models, we can refer to [3,4] and the references cited therein. Kuniya etc. [5] formulated a SIR (susceptible-infectious-recovered) model with nonlocal diffusion. They prove the global asymptotic stability of the disease-free equilibrium when the basic reproduction number R0<1 and also prove the uniform persistence of the system when R0>1 by using the persistent theory for dynamical systems. In 2020, Naik ect [6] established a new SIR model with Crowley-Martin type functional response and Holling type II treatment rate. The authors proved that the model has a disease-free equilibrium point and an endemic equilibrium point, and studied the existence and stability of the equilibrium point by using the La-Salle invariance principle and the Lyapunov function. The author also established a similar model in the same year, please refer to [7]. There are some other SIR models, we can refer to [8] and the references cited therein. In addition to these, the application of fractional-order models in infectious diseases has become more and more widespread. Naik ect [9] established a nonlinear fractional infectious disease model for HIV transmission. In the analysis process, the authors introduced Caputo-type fractional derivatives, applied the generalized Adams-Bashforth-Moulton method to find the numerical solution of the model. And by using the fractional Routh-Hurwitz stability criterion and the fractional La-Salle invariance principle, the equilibrium state of the model is determined and its stability is analyzed. Similar models can also refer to [10,11,12] and the references cited therein. In addition, some scholars have considered treatment items in the model, such as the SEIR (susceptible-exposed-infectious-recovered) model in [13,14]. In addition to these, there are other models that take into account more factors, as in [15,16,17,18,19]. From the work of S.A. Boone, et al. [20] and A. Gabbuti, et al. [21], we know that vaccination is the most effective measure to control the spread of hepatitis B due to prevention and management of viral disease heavily relies upon vaccines and antiviral medications. In 2014, Xu ect [22] studied vaccination decisions based on game theory and its impact on the spread of infectious diseases. In 2016, they studied the importance of vaccination for sexually transmitted diseases. It is concluded that with the establishment of herd immunity after vaccination, the mortality rate caused by infectious diseases will decrease [23]. In 2021, scholars have also analyzed the impact of vaccination on the spread of COVID-19 [24,25]. There are many similar models, see [26,27,28]. Considering a continuous vaccination strategy, Liu et al. [28] formulated the following system of ordinary differential equations:
where S(t),V(t),I(t) and R(t) denote the susceptible, vaccinated, infectious and recovered populations as time t, respectively. The parameters μ,β,α,β1,γ1,γ are all positive constants, here, μ is the recruitment rate and natural death rate, β is the rate of disease transmission between susceptible and infectious individuals, β1 is the rate of disease transmission between vaccinated and infected individuals, γ is the recovery rate, α is the vaccination rate, γ1 is the rate at which a vaccinated individual obtains immunity. It was shown that the global dynamics of model (1.1) is completely determined by the basic reproduction number R0. That is, if R0<1, the disease-free equilibrium is globally asymptotically stable, while if R0>1, a positive endemic equilibrium exists and it is globally asymptotically stable. It was observed in [28] that vaccination has an effect of decreasing the basic reproduction number.
We all know that some infectious diseases, such as measles and mumps, will be immune to life after being caught once, but not all infectious diseases will remain immune to death after being acquired once. Neglecting to monitor those who have recovered may lead to a resurgence of the disease. Therefore, it is necessary to consider the recurrence rate of the disease in the model.
Many previous models such as model (1.1) have constant coefficients. Assuming that the coefficient is independent of the environment is not consistent with the actual situation. Parameters (death rate, birth rate, etc.) are subject to changes in season, weather, food supply, etc. Incidence rates of many infectious diseases, such as measles, chicken-pox, rubella, diphtheria and influenza, are periodic or almost periodic in nature [29], therefore, nonautonomous systems are more realistic to reflect actual problems. Recently, researchers have worked on the nonautonomous epidemic dynamical systems with almost periodic parameters [30,31,32,33,34,35,36,37], the concept of almost periodicity was introduced by Bohr [38].
Motivated by the above work, in this paper, we consider the following nonautonomous SVIR epidemic model with relapse:
for t∈R+=[0,+∞), with initial conditions:
where μ(t),α(t),β(t),β1(t),γ(t),γ1(t),k(t) are positive almost periodic functions for t∈R, the ecological meaning of the almost functions are described in Table 1.
The paper is organized as follows: In section 2, some definitions and lemmas is presented. Section 3 is devoted to the permanence of the system (1.2). Section 4 is mainly to get the uniqueness and global attractivity of almost periodic solution of the system (1.2). Section 5 mainly analyzes the necessity of adding the recurrence rate k in this model and discusses the relationship between the recurrence rate k and the basic reproduction number R0. Some numerical simulations in Section 6 and discussions in Section 7 are given to illustrate our analytical result.
2.
Preliminaries
In this section, some definitions and lemmas will be presented.
Definition 1. [38,39] A continuous function f:R→R is said to be almost periodic on R if for any ϵ>0, the set
is relatively dense in R. i.e., for any ϵ>0, it is possible to find a real number l=l(ϵ)>0 with the property that for any interval L with length l(ϵ) such that L∩T(f,ϵ)≠∅.
Definition 2. [38,39] A continuous function f:R+→R is said to be asymptotically almost periodic function if there exist an almost periodic function h(t) and a continuous function φ(t) defined on R+ with limt→∞φ(t)=0 such that
Similar to almost periodic functions, asymptotic almost periodic functions also have several equivalent definitions:
Proposition 1. [38,39] Let f:R+→R be a continuous function, f is asymptotically almost periodic if and only if for any ϵ>0,T(ϵ)≥0, the set
is relatively dense in R+. i.e., for any ϵ>0, it is possible to find a real number l=l(ϵ)>0 with the property that for any interval L⊂R+ with length l(ϵ)>0 and T(ϵ)≥0 such that L∩T+(f,ϵ)≠∅.
Lemma 1. [40] If a>0,b>0 and dx(t)dt≥b−ax (dx(t)dt≤b−ax), where t≥t0 and x(t0)>0, we have
Lemma 2. [41,42] If function f is nonnegative, integrable and uniformly continuous on [0,+∞], then limt→∞f(t)=0.
3.
Permanence
For convenience, we introduce some notations, in the following part of this paper, let g:R→R be a continuous bounded function, then ¯g and g_ will be defined as
It is well known that an almost periodic function is bounded and uniformly continuous, thus we have
Moreover, we always assume that
Theorem 1. The system (1.2) is permanent, it means that any solution (S(t),V(t),I(t),R(t)) of system (1.2) satisfies
where M1=¯μμ_+α_,M2=¯αM1μ_+γ_1,M3=¯μμ_,M4=¯γ1M2+¯γM3μ_+k_,m1=μ_¯βM2+¯μ+¯α,m2=α_m1¯β1M3+¯μ+¯γ1,m3=k_m4¯μ+¯γ,m4=γ_1m2¯μ+¯k.
Proof. The first equation of system (1.2) gives that
where S(0)>0. This implies that S(t)>0 for all t>0, similar results also hold for V(t), I(t) and R(t).
From the first equation of system (1.2), we have
By applying Lemma 1 to (3.2), we get
Thus, there exists a sufficiently small \epsilon_1 > 0 and T_1 > 0 such that
According to the second equation of system (1.2), we get
By applying Lemma 1 to (3.3), we get
So as \epsilon_1\to0 there exists a sufficiently small \epsilon_2 > 0 and T_2 > T_1 such that
Let N(t) = S(t)+V(t)+I(t)+R(t) , then we get
By applying Lemma 1 to (3.4), we get
Then we have
Thus, there exists a sufficiently small \epsilon_3 > 0 and T_3 > T_2 such that
From the last equation of the system (1.2), we get
By applying Lemma 1 to (3.5), we get
So as \epsilon_2\, , \epsilon_3\to0 , there exists a sufficiently small \epsilon_4 > 0 and T_4 > T_3 such that
Similarly, we can get the following inequation by using the above conclusions,
By applying Lemma 1 to (3.6), we get
So as \epsilon_2\to0 , there exists a sufficiently small \epsilon_5 > 0 and T_5 > T_4 such that
According to the second equation of system (1.2), we get
By applying Lemma 1 to (3.7), as \epsilon_5\to 0 , we get
So as \epsilon_3\, , \epsilon_5\to0 , there exists a sufficiently small \epsilon_6 > 0 and T_6 > T_5 such that
From the last equation of the system (1.2), we get
By applying Lemma 1 to (3.8), we get
Thus, there exists a sufficiently small \epsilon_7 > 0 and T_7 > T_6 such that
From the third equation of the system (1.2), we get
By applying Lemma 1 to (3.9), we get
Thus, there exists a sufficiently small \epsilon_8 > 0 and T_8 > T_7 such that
4.
Almost periodic solution
Theorem 2. Suppose that the system satisfies the following conditions:
where M_1, M_2, M_3 is given in (3.1), then let X(t) = (S_1(t), V_1(t), I_1(t), R_1(t)) and Y(t) = (S_2(t), V_2(t), I_2(t), R_2(t)) are any two positive solutions of the system (1.2), we have
Proof. From Theorem 1, it follows that for \epsilon = \max\epsilon_i \, (i = 1, 2, ...8) and T\geq T_8 such that
for all t\geq T and j = 1, 2 , consider the following Lyapunov function
where
We define a function \sigma(\varphi(t)) in the following way, the function \varphi(t) is supposed to be a real valued scalar function,
Then, it can be obtained that |\varphi(t)| = \varphi(t)\sigma(\varphi(t)) and D^+|\varphi(t)| = \varphi^\prime(t)\sigma(\varphi(t)) where D^+ denotes a right hand Dini derivative, it follows that
Similarly,
For t > T , we have
When we choose \epsilon \to 0 , the above relation still holds. Define \phi = \min\{\underline{\mu}-2\overline{\beta}M_3, \, \underline{\mu}, \underline{\mu}-2\overline{\beta}_1M_3, \, \underline{\mu}-2\overline{\beta}M_1-2\overline{\beta}_1M_2\} . The above inequation takes the following form
Integrating the above inequation from T to t , we have
It can be obtained from (1.2), (4.2), (4.3) that \tilde{V}(t) is uniformly continuous on (T, +\infty) . Then it can be obtained by Lemma 2 that \tilde{V}(t)\to 0 as t\to +\infty . Otherwise, \phi\int_T^t\tilde{V}(y)dy \to +\infty when t\to \infty which is in contradiction with (4.4), then we get that
Theorem 3. Suppose all the conditions of Theorem 4.1 hold, then system (1.2) admits a unique almost periodic solution, which is global attractive. As a result, any solution of (1.2) is asymptotically almost periodic.
Proof. For convenience, let \mathfrak{F} = \{\mu(t), \, \alpha(t), \, \beta(t), \, \beta_1(t), \, \gamma(t), \gamma_1(t), \, k(t)\} and
where T(f, \epsilon) is the set of \epsilon -almost periods for f . Since \mu(t), \, \alpha(t), \, \beta(t), \, \beta_1(t), \, \gamma(t), \gamma_1(t), \, k(t) are almost periodic functions, there exists a sequence \{t_n\} with t_n\to \infty as n\to\infty , such that
Let
be a bounded positive solution of the model (1.2). Then from (4.5), we can obtain that Q(t+t_n) is the solution of the following system for t\in \mathbb{R}^+ :
Let \tau^*\in \mathbb{R}^+ \cap T(\mathfrak{F}, \varepsilon) , thus
Define W(t) as follows
where
Since the Q(t) is the solution of system (1.2), it can be obtained that
Then, let M = \max\{M_i\}(i = 1, 2, 3, 4) , we obtain
Integrating both sides of (4.9) from t to T\, (T > T_8) , and let \tilde{\varepsilon} = \frac{24\varepsilon M+8\varepsilon M^2+2\varepsilon}{\underline{\mu}} we get
It can be obtained that \lim\limits_{t \to \infty}\left(W(T)-\frac{12\varepsilon M+4\varepsilon M^2+\varepsilon}{\underline{\mu}}\right)e^{-\underline{\mu}t} = 0 . Then there exists \tilde{T} > T such that for all t > \tilde{T} ,
Thus, we get that
Then, in view of (4.8), for all t > \tilde{T} ,
Therefore, \tau^*\in T^+(q_i, \tilde{\varepsilon}) , which means
Thus, according to the Proposition 1, T^+(q_i, \tilde{\varepsilon}) is relatively dense in \mathbb{R}^+ and q_i(t) is the asymptotically almost periodic solution of (1.2). Then there is an almost periodic function q_{i1}(t) defined on \mathbb{R} and a continuous function q_{i2}(t) defined on \mathbb{R}^+ with \lim\limits_{t \to \infty}q_{i2}(t) = 0 , such that
We denote
where Q^{ap}(t) = (q_{11}(t), q_{21}(t), q_{31}(t), q_{41}(t)), \, Q^{e}(t) = (q_{12}(t), q_{22}(t), q_{32}(t), q_{42}(t)).
Now we prove that Q^{ap}(t) is an almost periodic solution of the system (1.2) for t\in \mathbb{R} . Since q_{i_1}(t) is almost periodic function, there exist a sequence \{t_n\} with t_n\to \infty as n\to\infty such that
and
Then we get \lim\limits_{n \to \infty}q_i(t+t_n) = q_{i1}(t) for t\in\mathbb{R}^+ , i = 1, 2, 3, 4. Moreover,
From (4.5), for t\in \mathbb{R} , we get
Similarly, for t\in \mathbb{R} ,
Thus, we get that Q^{ap}(t) is an almost periodic solution of system (1.2) for t\in \mathbb{R} .
Let H(t) = (S^*(t), V^*(t), I^*(t), R^*(t)) be another solution of system (1.2). By Theorem 2, we get
which implies that the unique almost periodic solution Q^{ap}(t) is global attractive.
5.
Analysis of the recurrence rate k
In this section, we discuss the necessity of adding the recurrence rate k in this model. It is well known that the basic reproduction number R_0 is the threshold value of the model, which shows that the disease persists or extinct in the population. Therefore, the relationship between R_0 and k can be used to reflect the influence of k on this system. We consider the following autonomous model corresponding to model (1.2):
for t\in \mathbb{R}^+ , where the parameters are all positive constants. It's easy to get the disease free equilibrium of the system (5.1),
Then let x = (I, V, R, S)^T , thus the system can be written as:
where
The Jacobian matrices of \mathscr{F}(x) and \mathscr{V}(x) at the disease free equilibrium E_0 are respectively,
where,
the non-negative matrix F for the appearance of the new disease and the matrix V for the transition terms are given by
By the next-generation operator method [43], the basic reproduction number of model (5.1) is calculated
To get the sensitivity of R_0 to k , following Chitnis and Hyman [44], the normalised forward sensitivity index with respect to k is given by
Remark 1. The sensitivity index is to assess the relative change in state variables when a parameter of the model changes. If A_k is positive, the value of the reproduction number will increase as k increases. Similarly, if A_k is negative, the value of the reproduction number will decrease as k increases. In next section, we will give some parameter values to calculate A_k , and verify our analysis by numerical simulations, see Figures 4 and 5.
For non-autonomous model (1.2), due to the complexity of the model, we use numerical simulation to reflect the impact of the recurrence rate on the model. See Figures 6 and 7 in the next chapter.
6.
Numerical simulation
In this section, to illustrate the analytic results obtained above, we have presented some simulations of system ({1.2}) and system (5.1).
6.1. Almost periodic solutions of system (1.2)
Example 1. We choose parameter values as follows:
Then we get that \underline{\mu} = \overline{\mu} = 0.1, \, \underline{\beta} = \overline{\beta} = 0.02, \, \underline{\alpha} = \overline{\alpha} = 0.3, \, \underline{\gamma} = \overline{\gamma} = 0.03, \, \underline{\gamma}_1 = \overline{\gamma}_1 = 0.49, \, \underline{\beta}_1 = \overline{\beta}_1 = 0.01, \, \underline{k} = \overline{k} = 0.1. All the sufficient conditions given in Theorem 4.1 for system (1.2) are well satisfied as
Using the parameter values in (6.1) to draw figures of the solution of model (1.2), we get Figure 1(a) and 1(b), and their corresponding initial values are (0.5, 0.8, 0.2, 0.3) and (1, 0.3, 0.5, 0.6) , respectively. It can be seen from 1 that as time goes by, all solutions tend to be a constant, which reflects the the model has a unique globally attractive positive almost periodic solution.
Example 2. We choose parameter values as follows:
Then we get that \underline{\mu} = 0.5, \overline{\mu} = 0.9, \underline{\beta} = 0.02, \, \overline{\beta} = 0.12, \, \underline{\alpha} = 0.5, \, \overline{\alpha} = 0.6, \, \underline{\gamma} = 0.09, \, \overline{\gamma} = 0.11, \, \underline{\gamma}_1 = 0.1, \, \overline{\gamma}_1 = 0.5, \, \underline{\beta}_1 = 0.01, \, \overline{\beta}_1 = 0.1, \, \underline{k} = 0.1, \, \overline{k} = 0.3. All the sufficient conditions given in Theorem 4.1 for system (1.2) are well satisfied as
Then the model has a unique globally attractive positive almost periodic solution. Next, we use numerical simulations to verify our conclusion. The parameter values are shown in (6.2). For the convenience of observation, we have drawn 4 figures to reflect the curves of each solution when the initial values are different. It can be seen from Figure 2 that the solution is globally attractive. It can also be seen that for different initial values, as time goes by, S_1, S_2, S_3 ; V_1, V_2, V_3 ; I_1, I_2, I_3 ; R_1, R_2, R_3 tends to the same curve, respectively. The numerical simulation in Figures 2 and 3 strongly support the consequence.
6.2. Simulation related to the recurrence rate k
For the autonomous system (5.1), from (5.3), take the parameter values as in (6.1), we get
By Remark 1 in Section 5, we know that R_0 will decrease as k decreases, which implies that reducing the recurrence rate k is very helpful to control the spread of infectious diseases.
Next, we give numerical simulations to verify our views. Change the parameter k while keeping other parameters fixed as in (6.1). Figure 4 shows the effect of recurrence rate on the number of infectious people. It is easy to see that the values of k have a significant effect on the number of infectious people. As the value of k decrease, the value of I decrease. Figure 5 shows the effect of recurrence rate on the number of recovered people. It is easy to see that as the value of k decrease, the value of R increase. If we want to control an infectious disease, we certainly hope that the number of infectious people will decrease and the number of recovered people will increase. These two figures tell us that when k decreases, the disease can be well controlled, which is very consistent with our analysis.
For the nonautonomous system (1.2), we change the parameter k(t) while keeping other parameters fixed as in (6.2). It has similar conclusions with the autonomous model. Figures 6 and 7 show that when k decreases, the number of infectious people decreases, the number of recovered people increases, respectively. This also verifies that it is necessary to consider the recurrence rate in the model.
6.3. Simulation related to the vaccination rate \alpha
For the autonomous system (5.1), let \beta = 0.5 , change the parameter \alpha while keeping other parameters fixed as in (6.1). Figure 8 shows the effect of vaccination rate on the number of infectious people. It is easy to see that the values of \alpha have a significant effect on the number of infectious people. As the value of \alpha increase, the value of I decrease. Figure 9 shows the effect of vaccination rate on the number of recovered people. It is easy to see that as the value of \alpha increase, the value of R increase. These two figures tell us that increasing the vaccination rate of the disease can control the spread of the disease.
For the nonautonomous system (1.2), let \beta(t) = 1.5+\frac{1}{40}(sin\sqrt{2}t+cos\sqrt{7}t)^2 , change the parameter \alpha(t) while keeping other parameters fixed as in (6.2). It has similar conclusions with the autonomous model. Figures 10 and 11 show that when \alpha(t) increases, the number of infectious people decreases, the number of recovered people increases, respectively. This shows that it is very meaningful to consider the vaccination rate in the model.
7.
Discussion
In this paper, we have formulated a nonautonomous SVIR epidemic model with relapse. As is known to us all, there are many disease shows seasonal behavior, taking account of seasonality in epidemic model is so important. Therefore, all the parameters in this paper are almost periodic functions. Firstly, we have proved the model (1.2) is permanence. Secondly, we have derived sufficient conditions required for existence, uniqueness and globally attractive of almost periodic solution of this system. Moreover, we have deduced that the almost periodicity of time evolution for all the populations is ensured when model parameters satisfy the conditions of Theorem 4.1.
From Figures 1-3, it is easily observed that as long as the parameter satisfies the condition of Theorem 4.1, the equation has a globally attractive almost periodic solution, and this solution is unique.
From Figures 4-7, it is easily observed that the number of infectious people and the number of recovered people are significant affected by k . The larger k is, the greater number of infectious people in equilibrium. This tells us that we should not only pay attention to susceptible people but also pay more attention to those who have recovered.
From Figures 9-11, it is easily observed that when the vaccination rate increases, the number of infectious people will decrease and at the same time the number of recovered patients will increase. This tells us that the government should increase publicity to strengthen people's awareness of vaccination, thereby increasing the vaccination rate.
Then, we choose parameter values as follows:
Obviously, \underline{\mu} = 0.1, \, \overline{\mu} = 0.3, \underline{\beta} = 1.9, \, \overline{\beta} = 2.1, \, \underline{\alpha} = 0.3, \, \overline{\alpha} = 2.3, \, \underline{\gamma} = 0.1, \, \overline{\gamma} = 1.1, \, \underline{\gamma}_1 = 0.3, \, \overline{\gamma}_1 = 0.8, \, \underline{\beta}_1 = 0.49, \, \overline{\beta}_1 = 0.51, \, \underline{k} = 0.1, \, \overline{k} = 0.3. All the sufficient conditions given in Theorem 4.1 for system (1.2) are well satisfied as
Parameter values in this example fail to satisfy condition (4.1) which we have mentioned in Theorem 2. But Figure 12 shows that the model has a unique globally attractive positive almost periodic solution, which means condition (4.1) is sufficient but not necessary for Theorems 2 and 3. This problem cannot be solved at present, we shall conduct further research on this issue in the future.
Acknowledgments
This paper is supported by the National Natural Science Foundation of China (Nos.11971329).
Conflict of interest
The authors declare there is no conflict of interest.