| Household medical device enterprises | |||
| recycling | non-recycling | ||
| Government | supervision | (−m−w,b+r+w−a) | (−m+p−e,−p) |
| non-supervision | (0,b−a+r) | (−e,0) | |


Under the background of the aging population and the improvement of people's quality of life, the demand for household medical devices is expanding, which has huge market potential. However, the recycling of waste household medical devices has become a problem that must be faced by the market expansion. In order to reduce the environmental pollution caused by abandoned household medical devices, based on the dynamic punishment and dynamic subsidy measures adopted by the government, the evolutionary game model between the government and the household medical device enterprises is constructed. The strategic choice of the government and the domestic medical equipment enterprises is studied from the perspective of system dynamics. It is found that when the government adopts static measures, there is no stable equilibrium point in the game between the government and enterprises, while when the government adopts dynamic punishment or subsidies, there is a stable equilibrium point in the evolutionary game. In addition, the government can increase the penalty or reduce the subsidy to promote the probability of household medical device enterprises to choose recycling strategy and reduce environmental pollution.
Citation: Zheng Liu, Lingling Lang, Lingling Li, Yuanjun Zhao, Lihua Shi. Evolutionary game analysis on the recycling strategy of household medical device enterprises under government dynamic rewards and punishments[J]. Mathematical Biosciences and Engineering, 2021, 18(5): 6434-6451. doi: 10.3934/mbe.2021320
| [1] | Liurong Zhao, Xiaoxi Yu, Xinyu Zhou . The impact of regulatory mechanisms on vulnerability disclosure behavior during crowdsourcing cybersecurity testing. Mathematical Biosciences and Engineering, 2023, 20(11): 19012-19039. doi: 10.3934/mbe.2023841 |
| [2] | Jialing Li, Guiju Zhu, Xinya Hu, Ruqian Fei, Dan Yu, Dong Wang . Study on the evolutionary strategy of upward patient transfer in the loose medical consortia. Mathematical Biosciences and Engineering, 2023, 20(9): 16846-16865. doi: 10.3934/mbe.2023751 |
| [3] | Jingyu Liu, Weidong Meng, Yuyu Li, Bo Huang, Bixi Zhang . Effective guide for behaviour of farmers in the withdrawal of rural homesteads: An evolutionary game-based study. Mathematical Biosciences and Engineering, 2022, 19(8): 7805-7825. doi: 10.3934/mbe.2022365 |
| [4] | Yuanyuan Huang, Yiping Hao, Min Wang, Wen Zhou, Zhijun Wu . Optimality and stability of symmetric evolutionary games with applications in genetic selection. Mathematical Biosciences and Engineering, 2015, 12(3): 503-523. doi: 10.3934/mbe.2015.12.503 |
| [5] | Jianquan Guo, Guanlan Wang, Mitsuo Gen . Green closed-loop supply chain optimization strategy considering CER and incentive-compatibility theory under uncertainty. Mathematical Biosciences and Engineering, 2022, 19(9): 9520-9549. doi: 10.3934/mbe.2022443 |
| [6] | Dario Madeo, Chiara Mocenni, Jean Carlo Moraes, Jorge P. Zubelli . The role of self-loops and link removal in evolutionary games on networks. Mathematical Biosciences and Engineering, 2019, 16(5): 5287-5306. doi: 10.3934/mbe.2019264 |
| [7] | Xiaochun Chen, Jie Zhao, Yingying Ma, Bo Lv, Xuanjin Du . Tripartite evolutionary game study on coordination information security in prescription circulation. Mathematical Biosciences and Engineering, 2023, 20(12): 21120-21146. doi: 10.3934/mbe.2023934 |
| [8] | Bo Lan, Lei Zhuang, Qin Zhou . An evolutionary game analysis of digital currency innovation and regulatory coordination. Mathematical Biosciences and Engineering, 2023, 20(5): 9018-9040. doi: 10.3934/mbe.2023396 |
| [9] | Wei Wu, Zhiyi Lin, Ming Wei . Research on a collaborative evolution model of multi-airport route network considering subsidy strategies. Mathematical Biosciences and Engineering, 2023, 20(11): 19808-19838. doi: 10.3934/mbe.2023877 |
| [10] | A. Swierniak, M. Krzeslak, D. Borys, M. Kimmel . The role of interventions in the cancer evolution–an evolutionary games approach. Mathematical Biosciences and Engineering, 2019, 16(1): 265-291. doi: 10.3934/mbe.2019014 |
Under the background of the aging population and the improvement of people's quality of life, the demand for household medical devices is expanding, which has huge market potential. However, the recycling of waste household medical devices has become a problem that must be faced by the market expansion. In order to reduce the environmental pollution caused by abandoned household medical devices, based on the dynamic punishment and dynamic subsidy measures adopted by the government, the evolutionary game model between the government and the household medical device enterprises is constructed. The strategic choice of the government and the domestic medical equipment enterprises is studied from the perspective of system dynamics. It is found that when the government adopts static measures, there is no stable equilibrium point in the game between the government and enterprises, while when the government adopts dynamic punishment or subsidies, there is a stable equilibrium point in the evolutionary game. In addition, the government can increase the penalty or reduce the subsidy to promote the probability of household medical device enterprises to choose recycling strategy and reduce environmental pollution.
With the improvement of the economic level, people pay more and more attention to the improvement of the quality of life, and household medical devices are favored by most families. As a subdivision of the medical device industry, the household medical device industry has many sales channels, such as network platform, supermarket, drugstore and so on. The industry is mainly small batch and variety production, and has high requirements for after-sales service. Under the background of the aging population, residents pay more attention to their own physical condition. Therefore, household medical devices, which tend to prevention and health care products, has a broad market development space. In 2016, the blue book on the development of China Medical Equipment Industry issued by China Medical Materials Association showed that the market scale of domestic medical devices exceeded 100billion, accounting for 27% of the whole medical equipment market. At present, there are some standardized treatment methods for waste medical devices such as The Management Rules of Medical Waste. However, the recycling of waste household medical devices is rarely involved in academic research, government policies or related industries. If these products such as thermometer and blood glucose meter are discarded at will, the heavy metals contained in the manufacturing materials will cause great pollution to the soil and rivers, and may even pose a threat to human health. No matter the government, enterprises or consumers should pay attention to the environmental pollution caused by the waste of household medical devices. The terminal recycling of waste household medical devices is an effective way to solve the problem of environmental pollution in a short time, and can bring certain economic benefits. The terminal recycling of household medical devices mainly depends on the autonomy of consumers, but the behavior of consumers is difficult to control. Therefore, considering that the enterprise is the executive body of the recycling behavior, the government can adopt punishment or subsidy measures to encourage the household medical device enterprises to provide high-quality recycling after-sales service and appropriate recycling price, so as to improve the enthusiasm of consumers for the disposal of waste household medical device products. Therefore, it is of practical significance to consider the recovery strategy of domestic medical equipment enterprises under the dynamic rewards and punishments of the government.
At present, domestic and foreign scholars have carried out a variety of research on medical devices recycling. Cao et al. believe that biodegradable materials can be used to solve the problem of recycling pollution of these electronic wastes when making medical devices [1]. Hughey et al. believe that the use process of valuable medical devices can be supervised, and the products can be recycled when consumers no longer need the products [2]. Cole et al. took hearing aids as the case study object to explore the possibility of benefit in the process of medical device recycling [3]. However, there are few researches on the recovery of domestic medical devices at home and abroad. BM Weick et al. believe that the use of household medical devices must undergo prior training to ensure the safety of users [4]. Zhang et al. think there is still a great room for development and progress in the treatment of waste medical devices [5]. It is a common phenomenon to apply evolutionary game and system dynamics to the study of economic management. Gluzman et al. applied evolutionary game to cancer treatment, and used system dynamics to solve the optimal treatment method [6]. Krishnamoorthy et al. applied system dynamics to the evolutionary game process of monopoly advertising companies to seek the optimal advertising pricing [7]. Beliavsky et al. take specific cases as the object to study the evolutionary game between various agents in the process of organizational resource allocation, and use system dynamics to simulate and solve it [8]. Barreiro-Gomez et al. analyzed the system dynamics under constraints, and used evolutionary game method to solve the stability strategy [9]. Villani et al. used the dynamic evolution mechanism to describe the change of national population, and used the evolutionary game model to analyze the green R & D decisions of various countries [10]. Yuan used evolutionary game theory to analyze the logistics information competition among members of the supply chain, and established a system dynamics model to study the influence of several factors on the enterprise's choice of information sharing strategy [11]. By establishing a game model, Liu et al. studied the optimal decision-making of enterprises [12]. Many existing problems need the participation of the government, so it is very necessary to study the impact of government measures on decision-making. Kim et al. used four kinds of game models to consider the product recovery rate of closed-loop supply chain in the case of government rewards and punishment measures and manufacturer subsidies [13]. In the context of consumers' green preference, Ghosh et al. considered the impact of government taxes and subsidies on enterprise pricing decisions [14]. From the perspective of consumer demand, Liu et al. discussed the optimal pricing strategy of the main body of the supply chain [15]. Ramandi et al. constructed a two-level supply chain composed of suppliers and retailers, and analyzed the impact of government rewards and punishments on supply chain profits and environmental pollution under centralized and decentralized decisions [16]. On the basis of analyzing the influencing factors of online shopping product quality, Li et al. discussed the government's product quality supervision strategy for online shopping platform [17].
To sum up, although there are many researches on the recycling system of medical devices, dynamic evolutionary game model, game relationship between government and enterprises, and optimal decision-making under government measures. There are few researches have applied evolutionary game to the government's dynamic reward and punishment measures for household medical devices. Therefore, based on the dynamic punishment and subsidy measures taken by the government after supervision, the evolutionary game model between the government and the domestic medical device enterprises is constructed to analyze the evolution process of the recovery strategy of the domestic medical device enterprises, which has practical significance for the research on the recycling strategy selection of household medical device enterprises under the government's dynamic rewards and punishments.
The remainder of this paper is organized as follows: the problem description, evolutionary game model and stability analysis will be introduced in section 2 and section 3. The system dynamics model and its simulation will be presented in section 4 and Conclusions will be drawn in the last section.
In the process of stimulating the recycling behavior of household medical device enterprises, the government should not only reduce the impact of waste products on the environment, but also ensure economic benefits. The evolutionary game model can not only describe the game relationship between the government and the enterprise, but also simulate the dynamic evolution process of the two sides in the case of incomplete rationality and incomplete information. Therefore, through the establishment of the evolutionary game model between the government and the household medical device enterprises, the strategic choice of the government and the household medical device enterprises is studied. Assuming that both sides of the game are bounded rational, the government has two choices of supervision and non-supervision. "Supervision" refers to the government's punitive measures when the household medical device enterprises do not recycle waste, and the government's subsidy support when the household medical device enterprises recycle waste. On the one hand, it is to reduce environmental pollution, on the other hand, it is to create a better market environment for recycling enterprises. Domestic medical device enterprises have two choices of recycling and non-recycling. If enterprises adopt "recycling", they can obtain financial support of low-carbon projects and reduce environmental pollution, but the cost is high and the profit is low. If enterprises adopt "non-recycling", they can get higher profits, but it will cause damage to the environment [18,19].
In the game between the government and household medical device enterprises, it is assumed that the probability of the government taking "supervision" is x(0≤x≤1), and the probability of taking "non supervision" is 1−x. The probability of the household medical device enterprises choosing "recycling" strategy is y(0⩽y⩽1), and the probability of choosing "non-recycling" strategy is 1−y. When the household medical device enterprises choose the "recycling" strategy, the required recovery cost is a, and the income is b. However, the recovery mechanism of domestic medical device is not yet mature, so the recovery needs more human and material resources. Therefore, assuming a>b, the financial support of environmental protection projects is r. When the domestic medical device enterprises choose the "non-recycling" strategy, there will be no cost. When the government takes "supervision" measures, it will produce regulatory costs m. After the supervision, it will give subsidies w to enterprises that recycle waste medical devices, and give punishment p to enterprises that do not recycle waste medical devices. When the government adopts the "non-supervision" strategy, although there will be no supervision cost, when the domestic medical device enterprises do not recycle products, there will be environmental governance cost e. Table 1 shows the game benefit matrix between the government and household medical device enterprises.
| Household medical device enterprises | |||
| recycling | non-recycling | ||
| Government | supervision | (−m−w,b+r+w−a) | (−m+p−e,−p) |
| non-supervision | (0,b−a+r) | (−e,0) | |
 DownLoad:
CSV
DownLoad:
CSV
Assuming that the government's expected revenue under the "supervision" and "non-supervision" strategies is uy and un, and the government's comprehensive revenue is ˉu. According to the assumptions and symbols in section 2.1, it can be concluded that:
| uy=(−m−w)y+(−m+p−e)(1−y) | (1) |
| un=−(1−y)e | (2) |
| ¯u=xuy+(1−x)un=−xy(w+p)+x(p−m)+(y−1)e | (3) |
Therefore, the dynamic equation of government replication can be obtained as follows:
| F(x)=dxdt=x(uy−¯u)=x(x−1)(m−p+yp+yw) | (4) |
Suppose that the expected revenue of the "recycling" and "non-recycling" strategies of the household medical device enterprises is vY and vN, and the comprehensive revenue of the government is ˉv. According to the hypothesis and symbol description in section 2.1, it can be concluded that:
| vy=(b−a+r+w)x+(b−a+r)(1−x) | (5) |
| vn=−px | (6) |
| ¯v=yvy+(1−y)vn=(p+w)xy+(b−a+r)y−px | (7) |
Therefore, the replication dynamic equation of household medical device enterprises can be obtained as follows:
| F(y)=dydt=y(vY−ˉv)=y(y−1)(a−b−r−xp−xw) | (8) |
According to the replication dynamic equation of the government and household medical device enterprises in section 2.2, the replication dynamic equations of the government and household medical device enterprises under the mixed strategy are as follows:
| {F(x)=dxdt=x(x−1)(m−p+yp+yw)F(y)=dydt=y(y−1)(a−b−r−xp−xw) | (9) |
Theorem 1: under the government's static measures, if 0<a−b−rp+w<1, 0<p−mp+w<1, then there are five replication dynamic equilibrium points in the system, but there is no stable equilibrium point.
Proof: first of all, {x(x−1)(m−p+yp+yw)=0y(y−1)(a−b−r−xp−xw)=0 can be obtained by assigning values to the duplicated dynamic equations of formula (9), and four equilibrium points O1(0,0), O2(0,1), O3(1,0), O4(1,1) can be obtained by solving the equations. Let x0=a−b−rp+w, y0=p−mp+w, if 0⩽x0⩽1 and 0⩽y0⩽1 are satisfied, then there is a fifth equilibrium point.
In order to analyze the stability of each point, Friedman's method is used to obtain the stability of the equilibrium point of the evolutionary system through the local stability of Jacobian matrix [20]. Therefore, the Jacobian matrix is obtained as follows:
| J=[∂F(x)∂x∂F(x)∂y∂F(y)∂x∂F(y)∂y]=[(2x−1)(m−p+yp+yw)x(x−1)(p+w)y(1−y)(p+w)(2y−1)(a−b−r−xp−xw)] | (10) |
The five equilibrium points are substituted into the Jacobian matrix (10). When there are detJ>0 (determinant of J is greater than 0) and trJ<0 (trace of matrix of J is less than 0) in local equilibrium points, the system is in a stable state. According to this, the stability analysis of five equilibrium points can be obtained, and Table 2 can be obtained as follows:
| equilibrium point | detJ | trJ | result |
| O1(0,0) | negative | uncertain | saddle point |
| O2(0,1) | negative | uncertain | saddle point |
| O3(1,0) | negative | uncertain | saddle point |
| O4(1,1) | negative | uncertain | saddle point |
| O5(x0,y0) | positive | 0 | central point |
DownLoad:
CSV
From the above table, it is found that O1(0,0), O2(0,1), O3(1,0), O4(1,1) belong to saddle point. O5(x0,y0) belongs to central point, but it is not asymptotically stable, so there is no evolutionary stability strategy in the system.
The government usually increases the punishment to restrict the non-recycling behavior of household medical device enterprises. In order to reduce the environmental pollution caused by the random disposal of waste household medical devices, it is assumed that the government's punishment to enterprises is directly proportional to the probability of enterprises choosing the " non-recycling" strategy. That is to say, when the domestic medical device enterprises choose the "non-recycling" strategy, the government's punishment changes from p to h(y)=(1−y)ε, and ε>A>0, where ε represents the highest punishment.
Theorem 2: when the government adopts dynamic punishment measures, if there are 0<a−b−rh(y∗)+w<1, 0<h(y∗)−mh(y∗)+w<1, then the system has five dynamic equilibrium points, and the system has a stable equilibrium point O5′(x∗,y∗).
Proof: When the government adopts the dynamic punishment measures, the profit matrix of the government and the enterprise changes correspondingly, and the changed replicator dynamics function are as follows:
| {F(x)=dxdt=x(x−1)(m−h(y)+yh(y)+yw)F(y)=dydt=y(y−1)(a−b+b−r−xh(y)−xw) | (11) |
Similarly, equilibrium points O1′(0,0), O2′(0,1), O3′(1,0), O4′(1,1) and O5′(a−b−rh(y∗)+w,h(y∗)−mh(y∗)+w) are obtained by solving the equation. The Jacobian matrix is obtained as follows:
| J′=[∂F(x)∂x∂F(x)∂y∂F(y)∂x∂F(y)∂y]=[(2x−1)[m−h(y)+yh(y)+yw]x(x−1)[h(y)+w−(1−y)h′(y)]y(1−y)(w+h(y))(2y−1)(a−b−r−xh(y)−xw)−xy(y−1)h′(y)] | (12) |
By substituting five equilibrium points into Jacobian matrix, the detJ and trJ values of equilibrium points are calculated. It is found that, similar to the results in the previous section, detJ values of equilibrium points O1′−O4′ are all negative, and they are all saddle points. Substituting O5′(a−b−rh(y∗)+w,h(y∗)−mh(y∗)+w) into Jacobian matrix J′(O5′(x∗,y∗)), where x∗=a−b−r(1−y∗)ε+w and y∗=(1−y∗)ε−m(1−y∗)ε+w, then J′(O5′)=[0(−a+b+r)[−a+w+b+r+ε(1−y∗)][2ε(1−y∗)+w](w+ε−εy∗)2[ε(1−y∗)−m](w+m)w+ε−εy∗ε(m+w)[m−ε(1−y∗)](a−b−r)(w+ε−εy∗)3] can be obtained. By solving the characteristic root of the equilibrium point O5′, |λE−J′(O5′)|=|λ−(−A+B+R)[−a+w+b+r+ε(1−y∗)][2ε(1−y∗)+w](W+ε−εy∗)2−[ε(1−y∗)−m](w+m)w+ε−εy∗λ−ε(m+w)[m−ε(1−y∗)](a−b−r)(w+ε−εy∗)3| can be obtained. Finally, the characteristic root λ1,λ2=ε(m+w)[ε(1−y∗)−m](−a+b+r)±√Δ2(w+ε−εy∗)3 can be obtained, and because Δ<0, and y∗ is equal to the solution of the equation y∗=(1−y∗)ε−m(1−y∗)ε+w, the characteristic root of J′(O5′) is a pair of characteristic complex roots with negative real numbers. According to the above proof, O5′(x∗,y∗) is the focus of stability and the system is asymptotically stable. By solving the equations {x∗=a−b−r(1−y∗)ε+wy∗=(1−y∗)ε−m(1−y∗)ε+w, the coordinate {x∗=2(a−b−r)w+√w2+4εw+4εmy∗=1+w−√w2+4εw+4εm2ε of the stable equilibrium point O5′(x∗,y∗) can be obtained.
Inference 1: under the government's dynamic punishment measures, the government's maximum punishment ε, the government's subsidy to enterprises for recycling waste medical devices w and the government's supervision cost m will simultaneously affect the probability x∗ of household medical device enterprises choosing recycling and the probability y∗ of government choosing supervision.
Proof: according to the condition 0<a−b−rh(y∗)+w<1 and 0<h(y∗)−mh(y∗)+w<1 in theorem 2, the derivatives of x∗ and y∗ can be obtained: ∂x∗∂a=√w2+4εw+4εm−w2ε(w+m)>0, ∂y∗∂m=−1√w2+4εw+4εm<0, ∂x∗∂b=∂x∗∂r=w−√w2+4εw+4εm2ε(w+m)<0, ∂x∗∂m=−(a−b−r)(w2+2εw+2εm−w√w2+4εw+4εm)2ε(w+m)2√w2+4εw+4εm<0, ∂y∗∂ε=w2+2εw+2εm−w√w2+4εw+4εm2ε2√w2+4εw+4εm>0, ∂x∗∂ε=−(a−b−r)(w2+2εw+2εm−w√w2+4εw+4εm)2ε2(w+m)√w2+4εw+4εm<0, ∂x∗∂w=(a−b−r)(mw−2εw−2εm−m√w2+4εw+4εm)2ε2(w+m)√w2+4εw+4εm<0, ∂y∗∂w=√w2+4εw+4εm−2ε−w2ε√w2+4εw+4εm<0.
Through the derivation of x∗ and y∗, it can be seen that with the increase of punishment ε, x∗ will decrease and y∗ will increase, which indicates that the possibility of government supervision is reduced and the possibility of household medical device enterprises to adopt recycling strategy is increased. When the government's subsidy w and the government's supervision cost m decrease, both x∗ and y∗ show an increasing trend, that is to say, the probability of government supervision and household medical device enterprises recycling will increase.
In addition to taking punitive measures, the government will also choose the way of subsidies to improve the enthusiasm of household medical device enterprises in recycling waste medical devices. If the government subsidizes household medical device enterprises, in the early stage of policy implementation, fewer enterprises choose to recycle waste products. In order to increase incentives and reduce environmental pollution, the government will give more subsidies. However, as more and more enterprises choose to recycle in the market, when the government's environmental protection goals have been completed or exceeded, the government's subsidies will be reduced. Therefore, the government's subsidies are inversely proportional to the probability of enterprises choosing to recycle the waste medical devices. That is to say, when the household medical device enterprises choose to "recycling", the government's subsidy is changed from w to f(y)=(1−y)n, and 0<n<a, n is the largest subsidy.
Theorem 3: when the government adopts dynamic subsidy measures, if there are 0<a−b−rf(y×)+p<1 and 0<p−mp+f(y×)<1, then the system has five dynamic equilibrium points, and the system has stable equilibrium point O5″(x×,y×).
It is proved that: when the government adopts dynamic subsidy measures, the income matrix of the government and the enterprise changes correspondingly, and the changed replicator dynamics function are as follows:
| {F(x)=dxdt=x(x−1)[m−p+yp+yf(y)]F(y)=dydt=y(y−1)[a−b−r−xp−xf(y)] | (13) |
Similarly, the equilibrium points O1″(0,0), O2″(0,1), O3″(1,0), O4″(1,1) and O5″(a−b−rf(y×)+p,p−mf(y×)+p) are obtained by solving the equation, and satisfy 0<a−b−rf(y×)+p<1, 0<p−mp+f(y×)<1. The Jacobian matrix is obtained as follows:
| J″=[∂F(x)∂x∂F(x)∂y∂F(y)∂x∂F(y)∂y]=[(2x−1)[m−p+yp+yf(y)]x(x−1)[p+f(y)+yf′(y)]y(1−y)[p+f(y)](2y−1)[a−b−r−xp−xf(y)]−xy(y−1)f′(y)] | (14) |
By substituting five equilibrium points into the Jacobian matrix and calculating the detJ and trJ values of the equilibrium points, it is found that the detJ values of the equilibrium pointsO1″−O4″ are all negative, and they are all saddle points. If O5″(a−b−r(1−y×)n+p,p−m(1−y×)n+p) is substituted into Jacobian matrix J′′(O5″(x×,y×)), where x×=a−b−rf(y×)+p, y×=p−mf(y×)+p, J(O5″)=[0(−a+b+r)[−a+p+b+r+n(1−y×)][(1−2y×)n+p](p+n−ny×)2[n(1−y×)+m](p−m)p+n−ny×n(p−m)[m+n(1−y×)](−a+b+r)(p+n−ny×)3] can be obtained. By solving the characteristic root of the equilibrium point O5″, |λE−J(O5′′)|=|λ−(−a+b+r)[−a+p+b+r+n(1−y×)][(1−2y×)n+p](p+n−ny×)2−[n(1−y×)+m](p−m)p+n−ny×λ−n(p−m)[m+n(1−y×)](−a+b+r)(p+n−ny×)3| can be obtained, the characteristic root λ1′,λ2′=n(p−m)[m+n(1−y×)](−a+b+r)±√Δ2(p+n−ny×)3 is obtained from the solution. Through calculation, it can be known that Δ<0, at the same time, y× is equal to the solution of equation y×=p−mf(y×)+p, so the characteristic root of J′′(O5″) is a pair of characteristic complex roots with negative real numbers. According to the above proof, O5″(x×,y×) is a stable focus and the system is asymptotically stable. {x×=2(a−b−r)p+n+√(p−n)2+4nmy×=p+n−√(p−n)2+4nm2n can be obtained by solving the equations {x×=a−b−r(1−y×)n+py×=p−m(1−y×)n+p.
Inference 2: under the dynamic government subsidy, the maximum government subsidy n, the government's penalty cost p and the government's supervision cost m will affect the probability x× of the household medical device enterprises choosing the recycling strategy and the probability y× of the government choosing the supervision strategy at the same time.
Proof: according to the above conditions 0<a−b−rf(y×)+p<1 and 0<h(y×)−mh(y×)+w<1 in theorem 3, the derivatives of x× and y× can be obtained: ∂x×∂a=p+n−√(p−n)2+4nm2n(p−m)>0, ∂y×∂m=−1√(p−n)2+4nm<0, ∂x×∂b=∂x×∂r=p+n−√(p−n)2+4nm2n(m−p)<0, ∂x×∂m=(−a+b+r)[2(m−p)(p+n−√(p−n)2+4nm)−1(m−p)√(p−n)2+4nm]<0, ∂x×∂n=(a−b−r)(p2−np+2nm−p√(p−n)2+4nm)2n2(p−m)√(p−n)2+4nm<0, ∂y×∂p=√(p−n)2+4nm+n−p2n√(p−n)2+4nm>0, ∂x×∂p=(a−b−r)[3nm−np+n2+pm−(m+n)√(p−n)2+4nm)]2n(p−m)2√(p−n)2+4nm<0, ∂y×∂n=p2−np+2nm−p√(p−n)2+4nm2n2√(p−n)2+4nm<0.
By deriving x× and y×, it can be seen that both x× and y× are increasing with the decrease of government subsidy n and the government supervision cost m, which means that the probability of government supervision and the probability of household medical device enterprises recycling increase. When the government's punishment p increases, the probability of government supervision decreases, while the probability of household medical device enterprises recycling increases.
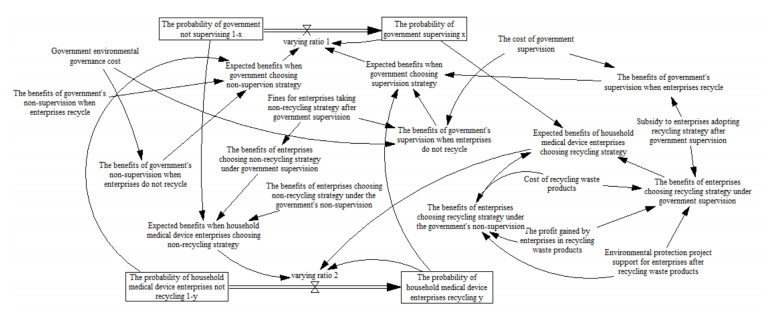
This section further demonstrates the game process and strategy selection between the government and enterprises under the government's static measures, dynamic punishment measures and dynamic subsidy measures by establishing a system dynamics model. At the same time, the behavior trends of both sides in the game under the influence of different factors are explored, so as to provide appropriate advice for the formulation of relevant government strategies. Based on the evolutionary game model and stability analysis, the system dynamics model between government and household medical device enterprises is constructed as shown in Figure 1.
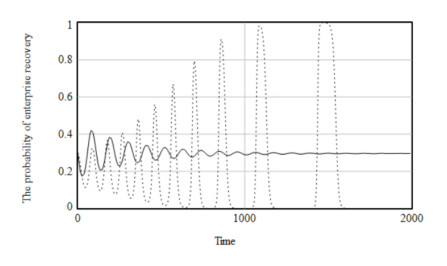
On the basis of the evolutionary game model, this section uses the system dynamics software VenismPLE to simulate, describes the game process of strategy choice between the home medical device enterprise and the government, and calculates the expected profits of the government and the home medical device enterprise under different strategy choices. According to the condition a>b in the problem description and the range conditions 0⩽a−b−rp+w⩽1 and 0⩽p−mp+w⩽1 obtained in the model proving process, the values of auxiliary variables are set accordingly, and the parameters are set to meet the range conditions: the cost of enterprise recycling waste household medical devices is a=3000, the cost of the government's supervision on the recovery behavior of enterprises is m=800, the income of enterprise recycling is b=800, the subsidy of enterprise adopting recycling strategy after government supervision is w=2000, the support of environmental protection project fund obtained by enterprise recycling is r=1000, the penalty of enterprise adopting non-recycling strategy after government supervision is p=2000, the cost of environmental governance is e=2500. In addition, in order to eliminate the interference of government supervision probability, the probability of government choosing "supervision" is set as the stable equilibrium value x0=a−b−rp+w=0.3, and the initial probability of household medical device enterprises choosing "recovery " strategy is set as 0.3 and 0.7 to form a contrast. The change process of strategy selection of household medical device enterprises under different initial recycling probability is observed, as shown in Figure 2. Since the data in the simulation is simulated, the unit of time is set to 1.
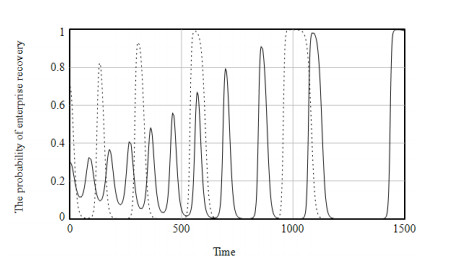
It can be found from Figure 2 that under the government's static punishment and static subsidy, no matter what the initial value is, the probability of household medical device enterprises which choosing recycling strategy is in constant fluctuation, and finally reaches the maximum amplitude, but there is no stable equilibrium point. In addition, in the case of different initial values, the fluctuation patterns of the two curves are also different. When the initial value is 0.7, the fluctuation range is larger.
In order to further test whether there is a stable equilibrium point between the government and the household medical device enterprises under the static measures, the initial value of government supervision and enterprise recycling is set as 0.4, and the process of strategy game between the government and the enterprises is shown in Figure 3.
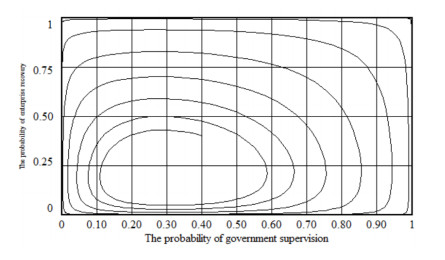
According to the game evolution process of the strategies of the government and the household medical device enterprises in Figure 3, it can be found that there is no stable equilibrium between the government and the household medical device enterprises under the government's static reward and punishment measures, which verifies the conclusion in Theorem 1. The evolutionary process of the game presents a circular curve with periodic changes, which also shows that the government's guidance to enterprises is a long-term repeated behavior.
When the government's punishment changed from p to h(y)=(1−y)ε, the control group with static and dynamic measures is set to observe the change of the probability of household medical device enterprises choosing recycling strategy, and the simulation is carried out by using VenismPLE software. Let ε=0.4, the initial probability of household medical device enterprises choosing "recycling" strategy is set to 0.3, and the other parameters are the same as those set in section 4.2. The evolution process of the probability of household medical device enterprises choosing the recycling strategy under different punishment measures is obtained, as shown in Figure 4.
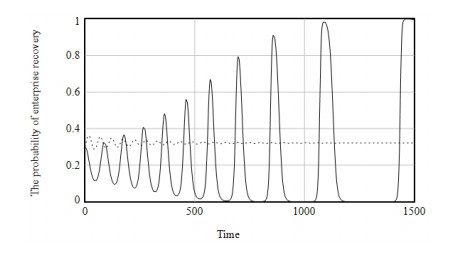
As can be seen from Figure 4, after the government adopts the dynamic punishment, with the increase of the game time, the probability of enterprises choosing the recycling strategy tends to be stable gradually, while the recovery probability of enterprises under the static measures has been floating up and down.
In order to further verify whether there is an equilibrium point in the game between the government and enterprises under the dynamic punishment measures, the initial value of the two is set to 0.4 again, and Figure 5 can be obtained as follows.
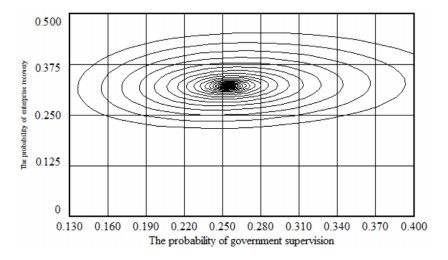
As can be seen from Figure 5, under the government dynamic punishment, with the increase of the game time, the curve of the evolution process presents a trend of continuous convergence, and finally stabilizes at the equilibrium point (2(a−b−r)w+√w2+4εw+4εm,1+w−√w2+4εw+4εm2ε). According to the set parameters, the coordinate of the point is (0.255,0.321), and Theorem 2 is verified. This conclusion can provide the basis for the government's strategic choice and promote the recycling behavior of household medical device enterprises.
When the government subsidies changed from w to f(y)=(1−y)n, the control group of static and dynamic measures is set to observe the change of the probability of household medical device enterprises choosing the recycling strategy, and the simulation is carried out by using VenismPLE software. Let n=0.1, other parameter settings are the same as in 4.3, the evolution process of the probability of household medical device enterprises choosing the recycling strategy under different subsidy measures is obtained, as shown in Figure 6.
As can be seen from Figure 6, after the government adopts the dynamic subsidy, with the increase of the game time, the probability of enterprises choosing the recycling strategy gradually tends to be stable, while the recovery probability of enterprises under the static measures has been floating.
In order to further verify whether there is an equilibrium point in the game between the government and enterprises under the dynamic subsidy measures, the initial value of the government and enterprises is set as 0.4, and Figure 7 is obtained as follows.
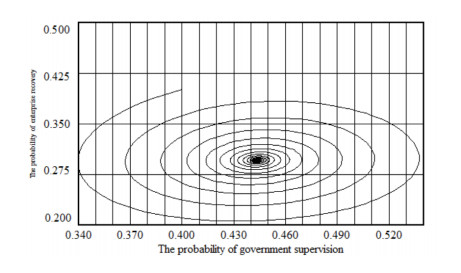
As can be seen from Figure 5, under the government's dynamic punishment, with the increase of the game time, the curve of the evolution process presents a trend of continuous convergence, and finally stabilizes at the equilibrium point (2(a−b−r)p+n+√(p−n)2+4nm,p+n−√(p−n)2+4nm2n). According to the set parameters, the coordinate of the point is (0.444,0.296), and theorem 2 is verified. This conclusion can provide the basis for the government's strategic choice and promote the recycling behavior of household medical device enterprises.
The control group was set up to further analyze the impact of punishment and subsidies on government's supervision decisions and household medical device enterprise' recycling decisions. The initial value of government regulation and enterprise recycling is set to 0.4. According to the conditions ε>a>0 and 0<n<a of the model, ε is set to 4000 and 7000, corresponding to the low punishment and high punishment of non-recycling enterprises after government supervision. Set n as 1000 and 2000, corresponding to the low and high subsidies to enterprises after government supervision. The evolution process of government supervision probability and enterprise recovery probability is shown in Figure 8.
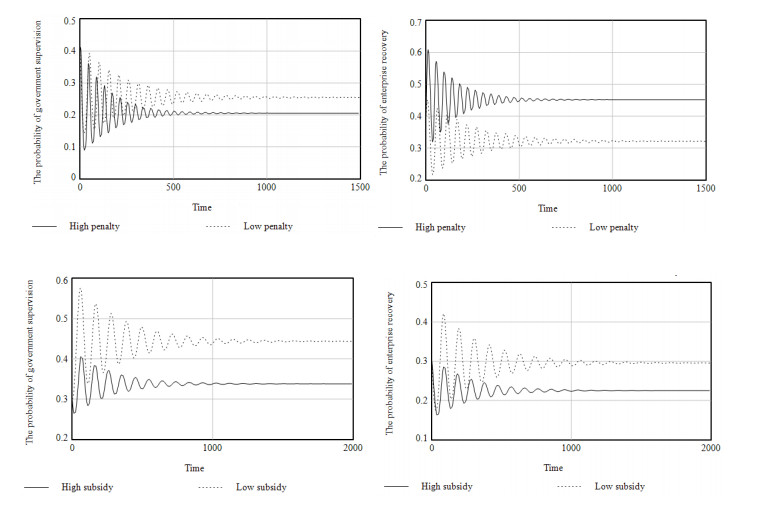
As shown in Figure 8, the probability of both government and enterprise shows similar fluctuation trend under high and low government punishment, but the probability of both government and enterprise can reach the equilibrium point in a shorter time under high government punishment. And under the high punishment, the probability of government supervision is reduced, while the probability of household medical device enterprises choosing recycling strategy is increased, which belongs to the ideal situation that the government wants to achieve. At this time, the government does not need to pay too much economic cost for supervision, but can achieve the effect of improving the recovery probability of enterprises. Similarly, the probability of government and enterprise under different subsidies also shows similar fluctuation trend. The strategy selection probability of household medical device enterprises and the government can reach the equilibrium point faster under the condition of high subsidy. But in the case of low subsidies, although the probability of government supervision is increasing, the probability of household medical device enterprises choosing to recycle is also increasing, which is acceptable to the government. In other words, in order to improve the probability of enterprises choosing recycling strategy, the government needs to pay a certain economic cost for supervision. Therefore, the government can increase punishment and reduce subsidies in a certain range to promote the waste product recycling behavior of household medical device enterprises and achieve the goal of low carbon.
By constructing the evolutionary game model between the government and the household medical device enterprises, the evolution process of the strategy selection of the government and the household medical device enterprises is analyzed from the perspective of system dynamics. The stability analysis is used to study the stability of the dynamic equilibrium under the government's static measures, dynamic punishment measures and dynamic subsidy measures. The evolution process of probability between the government and the household medical equipment enterprises is observed by setting up the comparison between high and low punishment and subsidy. The research shows that only when the government takes dynamic measures can the system have a stable equilibrium point. Under the government's high punishment constraints, the government's supervision probability is reduced, while the recovery probability of household medical device enterprises is increased, which belongs to the ideal situation that the government wants to achieve. In the case of low subsidies, the probability of recovery of household medical device enterprises is increased, but the probability of government supervision must also be increased, which is acceptable to the government. In order to achieve the dual goals of economic development and environmental protection at the same time, on the one hand, the government should supervise the recovery of household medical device enterprises; on the other hand, the government should subsidize the cost of recovery of household medical device enterprises. Therefore, the government can increase punishment and reduce subsidies in a certain range to promote the waste product recycling behavior of household medical device enterprises, so as to reduce environmental pollution. However, there is no in-depth study on the specific scope of the government's reward and punishment measures for household medical device enterprises, so as to protect the environment and ensure the economic benefits of both government and enterprises. In addition, compared with the research of other scholars, this paper still lacks the consideration of consumer's recycling behavior.
The finding is sponsored by the National Natural Science Foundation of China (Grant no. 71901141), the soft science research project of Shanghai Science and Technology Committee (Grant no. 21692195600), the Key Lab of Information Network Security of Ministry of Public Security (Grant no. C20609), Municipal Key Curriculum Construction Project of University in Shanghai (Grant no. S202003002).
All authors declare no conflict of interest in this paper.
| [1] |
Y. Cao, K. E. Uhrich, Biodegradable and biocompatible polymers for electronic applications: A review, J. Bioact. Compat. Polym., 34 (2019), 3-15. doi: 10.1177/0883911518818075

|
| [2] |
A. B. Hughey, T. S. Baman, K. A. Eagle, T. C. Crawford, Pacemaker reuse: an initiative to help those in underserved nations in need of life-saving device therapy, Expert Rev. Med. Devices., 10 (2013), 577-579. doi: 10.1586/17434440.2013.827519
|
| [3] |
R. Cole, C. F. Lindsay, F. Barker, Reverse exchange of healthcare devices: the case of hearing aid equipment in the UK, Prod. Plann. Control., 29 (2018), 1045-1057. doi: 10.1080/09537287.2018.1506892
|
| [4] |
M. B. Weick, S. Singh, The food and drug administration's initiative for safe design and effective use of home medical equipment, Home Healthcare Now, 32 (2014), 343-348. doi: 10.1097/NHH.0000000000000078
|
| [5] | X. Zhang, H. L. Xu, Y. H. Huang, X. L. Peng, Strategy discussion for pollution control of post-consumer home medical equipment, Chin. J. Med. Instrum., 39 (2015), 367-369. |
| [6] | M. Gluzman, J. G.Scott, A. Vladimirsky, Optimizing adaptive cancer therapy: Dynamic programming and evolutionary game theory, Proc. R. Soc. B., 287 (2020), 1-10. |
| [7] |
A. Krishnamoorthy, A. Prasad, S. P. Sethi, Optimal pricing and advertising in a durable-good duopoly, Eur. J. Oper. Res., 200 (2010), 486-497. doi: 10.1016/j.ejor.2009.01.003
|
| [8] |
G. I. Beliavsky, N. V. Danilova, G. A. Ougolnitsky, Evolutionary methods for solving dynamic resource allocation problems, Autom. Remote Control, 80 (2019), 1335-1346. doi: 10.1134/S0005117919070105
|
| [9] |
J. Barreiro-Gomez, H. Tembine, Constrained evolutionary games by using a mixture of imitation dynamics, Automatica, 97 (2018), 254-262. doi: 10.1016/j.automatica.2018.08.014
|
| [10] |
G. Villani, M. Biancardi, An evolutionary game approach in international environmental agreements with R & D investments, Comput. Econ., 54 (2019), 1027-1042. doi: 10.1007/s10614-018-9860-3
|
| [11] | G. J. Yuan, Research on internal logistics information sharing of supply chain from the perspective of evolutionary game, Int. Core J. Eng., 6 (2020), 350-356. |
| [12] | Z. Liu, L. L. Lang, B. Hu, L. H. Shi, B. T. Huang, Y. J. Zhao, Emission reduction decision of agricultural supply chain considering carbon tax and investment cooperation, J. Clean. Prod., 294 (2021), 1-8. |
| [13] |
S. Kim, N. Shin, S. Park, Closed-loop supply chain coordination under a reward-penalty and a manufacturer's subsidy policy, Sustainability, 12 (2020), 1-28. doi: 10.3390/su12229323
|
| [14] |
G. Debabrata, S. Janat, S. Sanjeev, Product greening and pricing strategies of firms under green sensitive consumer demand and environmental regulations, Ann. Oper. Res., 290 (2020), 491-520. doi: 10.1007/s10479-018-2903-2
|
| [15] | Z. Liu, H. X. G, Y. J. Zhao, B. Hu, X. D. J, L. L. Lang, et al., Optimal pricing decision of composite service offered by network providers in E-commerce environment, Electron. Commer. Res., 4 (2021), 1-17. |
| [16] | M. D. Ramandi, M. K. Bafruei, Effects of government's policy on supply chain coordination with a periodic review inventory system to reduce greenhouse gas emission, Comput. Ind. Eng., 148 (2020), 1-20. |
| [17] |
Y. P. Li, D. C. Wen, X. J. Sun, Quality supervision game between government and online shopping platforms, Total. Qual. Manag. Bus., 29 (2018), 1246-1258. doi: 10.1080/14783363.2018.1487617
|
| [18] | W. T. Chen, Z. H. Hu, Research on the government regulation and manufacturer recovery under premium and penalty mechanism, Soft Sci., 33 (2019), 106-125. |
| [19] |
W. Wang, Y. Zhang, K. Zhang, T. Bai, J. Shang, Reward-penalty mechanism for closed-loop supply chains under responsibility-sharing and different power structures, Int. J. Prod. Econ., 170 (2015), 178-190. doi: 10.1016/j.ijpe.2015.09.003
|
| [20] | D. Friedman, Evolutionary games in economics, Econometrica, 59 (1991), 63-666. |

Zheng Liu, Lingling Lang, Lingling Li, Yuanjun Zhao, Lihua Shi. Evolutionary game analysis on the recycling strategy of household medical device enterprises under government dynamic rewards and punishments[J]. Mathematical Biosciences and Engineering, 2021, 18(5): 6434-6451. doi: 10.3934/mbe.2021320

| Household medical device enterprises | |||
| recycling | non-recycling | ||
| Government | supervision | (−m−w,b+r+w−a) | (−m+p−e,−p) |
| non-supervision | (0,b−a+r) | (−e,0) | |
DownLoad:
CSV
| equilibrium point | detJ | trJ | result |
| O1(0,0) | negative | uncertain | saddle point |
| O2(0,1) | negative | uncertain | saddle point |
| O3(1,0) | negative | uncertain | saddle point |
| O4(1,1) | negative | uncertain | saddle point |
| O5(x0,y0) | positive | 0 | central point |
DownLoad:
CSV
| Household medical device enterprises | |||
| recycling | non-recycling | ||
| Government | supervision | (−m−w,b+r+w−a) | (−m+p−e,−p) |
| non-supervision | (0,b−a+r) | (−e,0) | |
| equilibrium point | detJ | trJ | result |
| O1(0,0) | negative | uncertain | saddle point |
| O2(0,1) | negative | uncertain | saddle point |
| O3(1,0) | negative | uncertain | saddle point |
| O4(1,1) | negative | uncertain | saddle point |
| O5(x0,y0) | positive | 0 | central point |
