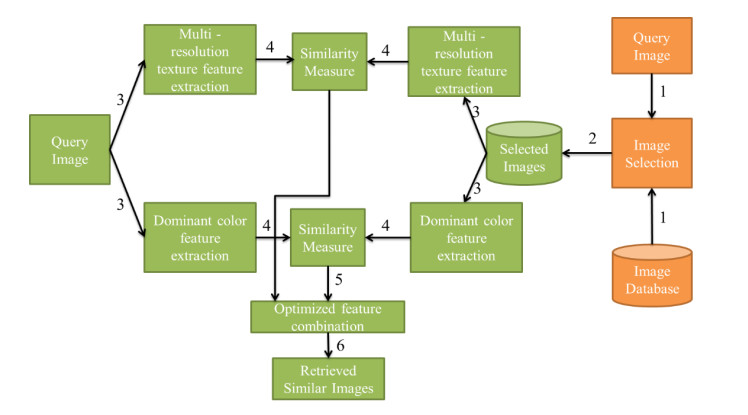
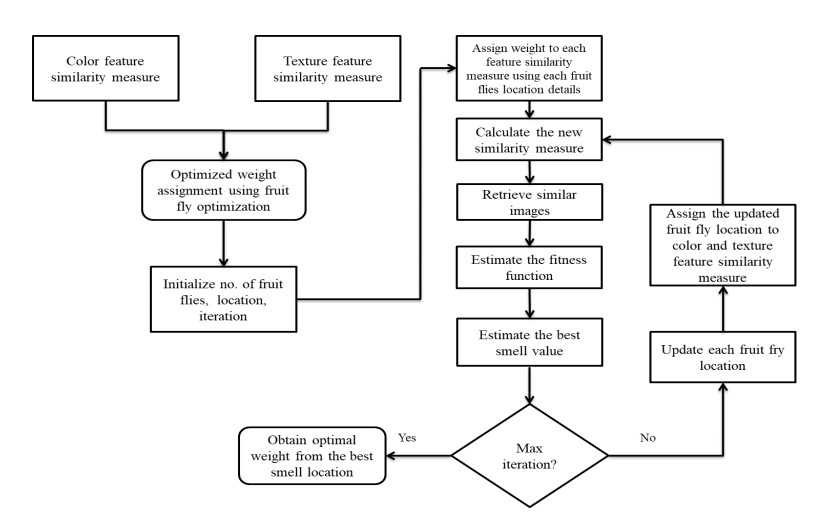
The content-based image retrieval (CBIR) system searches and retrieves the similar images from the huge database using the significant features extracted from the image. Feature integration techniques used in the CBIR system assign static weights to each feature involved in the retrieval process that gives a smaller number of similar images as a result. Moreover, the retrieval time of the CBIR system increases due to the entire database search. To overcome this disadvantage the proposed work introduced a two-level searching process in the CBIR system. The initial level of the proposed framework uses the image selection rule to select more relevant images for the second-level process. The second level of the framework takes the proposed dominant color and radial difference pattern details from the query and selected images. By using color and texture features of the selected images, similarity measure is calculated. The proposed work assigns optimal dynamic weight to the similarity measure of color and texture features using the fruit fly optimization algorithm. This improves the retrieval performance of the CBIR system.
Citation: Pavithra Latha Kumaresan, Subbulakshmi Pasupathi, Sindhia Lingaswamy, Sreesharmila Thangaswamy, Vimal Shunmuganathan, Danilo Pelusi. Fruit-Fly optimization based feature integration in image retrieval[J]. Mathematical Biosciences and Engineering, 2021, 18(5): 6178-6197. doi: 10.3934/mbe.2021309
The content-based image retrieval (CBIR) system searches and retrieves the similar images from the huge database using the significant features extracted from the image. Feature integration techniques used in the CBIR system assign static weights to each feature involved in the retrieval process that gives a smaller number of similar images as a result. Moreover, the retrieval time of the CBIR system increases due to the entire database search. To overcome this disadvantage the proposed work introduced a two-level searching process in the CBIR system. The initial level of the proposed framework uses the image selection rule to select more relevant images for the second-level process. The second level of the framework takes the proposed dominant color and radial difference pattern details from the query and selected images. By using color and texture features of the selected images, similarity measure is calculated. The proposed work assigns optimal dynamic weight to the similarity measure of color and texture features using the fruit fly optimization algorithm. This improves the retrieval performance of the CBIR system.

| [1] |
J. Yue, Z. Li, L. Liu, Z. Fu, Content-based image retrieval using color and texture fused features, Math. Comput. Model., 54 (2011), 1121–1127. doi: 10.1016/j.mcm.2010.11.044

|
| [2] |
M. Singha, K. Hemachandran, A. Paul, Content-based image retrieval using the combination of the fast wavelet transformation and the colour histogram, IET Image Process., 6 (2012), 1221–1226. doi: 10.1049/iet-ipr.2011.0453
|
| [3] |
X. Y. Wang, B. B. Zhang, H. Y. Yang, Content-based image retrieval by integrating color and texture features, Multimed. Tools. Appl., 68 (2014), 545–569. doi: 10.1007/s11042-012-1055-7
|
| [4] |
M. Dey, B. Raman, M. Verma, A novel colour- and texture-based image retrieval technique using multi-resolution local extrema peak valley pattern and RGB colour histogram, Pattern Anal. Appl., 19 (2016), 1159–1179. doi: 10.1007/s10044-015-0522-y
|
| [5] |
X. Y. Wang, L. L. Liang, Y. W. Li, H. Y. Yang, Image retrieval based on exponent moments descriptor and localized angular phase histogram, Multimedia Tools. Appl., 76 (2017), 7633–7659. doi: 10.1007/s11042-016-3416-0
|
| [6] |
G. Sucharitha, R. K. Senapati, Biomedical image retrieval by using local directional edge binary patterns and Zernike moments, Multimed Tools. Appl., 79 (2020), 1847–1864. doi: 10.1007/s11042-019-08215-7
|
| [7] | R. P. Y. Narasimha, L. K. Pavithra, T. S. Sharmila, Analysis of Supervised and Unsupervised Learning in Content Based Multimedia Retrieval, Int. Conf. on Comput. Commun. Sign. Proc. (ICCCSP), (2018), 1–5. |
| [8] | X. Y. Wang, Y. J. Yua, H. Y. Yang, An effective image retrieval scheme using color, texture and shape features, Comput. Stand. Inter., 33 (2011), 59–68. |
| [9] |
X. Y. Wang, H. Y. Yang, D. M. Li, A new content-based image retrieval technique using color and texture information, Comput. Electr. Eng., 39 (2013), 746–761. doi: 10.1016/j.compeleceng.2013.01.005
|
| [10] | A. Khokher, R. Talwar, A fast and effective image retrieval scheme using color-, texture-, and shape-based histograms, Multimed Tools. Appl., 76 (2017), 21787–21809. |
| [11] |
N. Varish, A. K. Pal, R. Hassan, M. K. Hasan, A. Khan, N. Parveen, et al., Image Retrieval Scheme Using Quantized Bins of Color Image Components and Adaptive Tetrolet Transform, IEEE Access, 8 (2020), 117639–117665. doi: 10.1109/ACCESS.2020.3003911
|
| [12] | S. Fadaei, R. Amirfattahi, M. R. Ahmadzadeh, New content-based image retrieval system based on optimised integration of DCD, wavelet and curvelet features, IET Image Process., 11 (2017), 89–98. |
| [13] | L. K. Pavithra, T. S. Sharmila, An Efficient Framework for Image Retrieval using Color, Texture and Edge Features, Comput. Electr. Eng., 70 (2018), 580–593. |
| [14] |
L. Putzu, L. Piras, G. Giacinto, Convolutional neural networks for relevance feedback in content based image retrieval, Multimed. Tools Appl., 79 (2020), 26995–27021. doi: 10.1007/s11042-020-09292-9
|
| [15] | L. Pinjarkar, M. Sharma, S. Selot, Deep CNN combined with relevance feedback for trademark image retrieval. J Intell Sys., 29 (2020), 894–909. |
| [16] | K. Simonyan, A. Zisserman, Very deep convolutional networks for large-scale image recognition, Comput. Vis. Pattern Recognit., (2014), 1–6. |
| [17] |
X. Li, J. Yang, J. Ma, Large Scale Category-Structured Image Retrieval for Object Identification Through Supervised Learning of CNN and SURF-Based Matching, IEEE Access, 8 (2020), 57796–57809. doi: 10.1109/ACCESS.2020.2982560
|
| [18] |
A. A. Heidari, S. Mirjalili, H. Faris, I. Aljarah, M. Mafarja, H. Chen, Harris hawks optimization: Algorithm and applications, Future Gener Comput Syst., 97 (2019), 849–872. doi: 10.1016/j.future.2019.02.028
|
| [19] |
G. G. Wang, Moth search algorithm: a bio-inspired metaheuristic algorithm for global optimization problems, Memetic Comp., 10 (2018), 151–164. doi: 10.1007/s12293-016-0212-3
|
| [20] |
Q. Guo, Y. Quan, C. Jiang, Object Pose Estimation in Accommodation Space using an Improved Fruit Fly Optimization Algorithm, J. Intell. Robot. Syst., 95 (2019), 405–417. doi: 10.1007/s10846-018-0940-3
|
| [21] | G. G. Wang, S. Deb, Z. Cui, Monarch butterfly optimization, Neural Comput & Applic., 31 (2019), 1995–2014. |
| [22] |
S. Li, H. Chen, M. Wang, A. A. Heidari, S. Mirjalili, Slime mould algorithm: A new method for stochastic optimization, Future Gener. Comput. Syst., 111 (2020), 300–323. doi: 10.1016/j.future.2020.03.055
|
| [23] | Y. Yang, H. Chen, A. A. Heidari, A. H. Gandomi, Hunger games search: Visions, conception, implementation, deep analysis, perspectives, and towards performance shifts, Expert Syst. Appl., 177 (2021), 1–34. |
| [24] | Y. Fan, P. Wang, M. Mafarja, M. Wang, X. Zhao, H. Chen, A bioinformatic variant fruit fly optimizer for tackling optimization problems, Knowl. Based Syst., 213 (2021), 1–21. |
| [25] | H. Yu, W. Li, C. Chen, J. Liang, W. Gui, M. Wang, et al., Dynamic Gaussian bare‑bones fruit fly optimizers with abandonment mechanism: method and analysis, Eng. Comput., (2020), 1–29. |
| [26] | X. Wang, H. Chen, A. A. Heidari, X. Zhang, J. Xu, Y. Xu, H. Huang, Multi-population following behavior-driven fruit fly optimization: A Markov chain convergence proof and comprehensive analysis, Knowl. Based Syst., 210 (2020), 1–26. |
| [27] | Y. Fan, P. Wang, A. A. Heidari, M. Wang, X. Zhao, H. Chen, C. Li, Rationalized fruit fly optimization with sine cosine algorithm: A comprehensive analysis, Expert Syst. Appl., 157 (2020), 1–23. |
| [28] | Y. Fan, P. Wang, A. A. Heidari, M. Wang, X. Zhao, H. Chen, et al., Boosted hunting-based fruit fly optimization and advances in real-world problems, Expert Syst. Appl., 159 (2020), 1–23. |
| [29] |
N. C. Yang, W. H. Chang, C. M. Kuo, T. H. Li, A fast MPEG-7 dominant color extraction with new similarity measure for image retrieval, J. Vis. Commun. Image. R., 19 (2008), 92–105. doi: 10.1016/j.jvcir.2007.05.003
|
| [30] | E. Walia, S. Vesal, A. Pal, An Effective and Fast Hybrid Framework for Color Image Retrieval, Sens. Imaging, 15 (2015), 1–23. |
| [31] |
S. M. Lin, Analysis of service satisfaction in web auction logistics service using a combination of Fruit fly optimization algorithm and general regression neural network, Neural. Comput. Appl., 22 (2013), 783–791. doi: 10.1007/s00521-011-0769-1
|
| [32] |
E. Walia, A. Pal, Fusion framework for effective color image retrieval, J. Vis. Commun. Image R., 25 (2014), 1335–1348. doi: 10.1016/j.jvcir.2014.05.005
|
| [33] |
Y. Li, M. Han, Improved fruit fly algorithm on structural optimization, Brain Inf., 7 (2020), 1–13. doi: 10.1186/s40708-020-0102-9
|
| [34] |
X. Li, J. Yang, J. Ma, Recent developments of content-based image retrieval (CBIR), Neurocomputing, 452 (2021), 675–689. doi: 10.1016/j.neucom.2020.07.139
|
| [35] |
Y. Yang, H. Chen, S. Li, A. A. Heidari, M. Wang, Orthogonal learning harmonizing mutation-based fruit fly-inspired optimizers, Appl. Math. Model., 86 (2020), 368–383. doi: 10.1016/j.apm.2020.05.019
|
| [36] |
G. Ding, Y. Qiao, W. Yi, W. Fang, L. Du, Fruit fly optimization algorithm based on a novel fluctuation model and its application in band selection for hyperspectral image, J. Ambient Intell. Human Comput., 12 (2021), 1517–1539. doi: 10.1007/s12652-020-02226-1
|
| [37] | X. Zhang, Y. Xu, C. Yu, A. A. Heidari, S. Li, H. Chen, et al., Gaussian mutational chaotic fruit fly-built optimization and feature selection, Expert Syst. Appl., 141 (2020), 1–14. |
| [38] | S. Singh, S. Batra, An efficient bi-layer content based image retrieval system. Multimed Tools Appl., 79 (2020), 17731–17759. |
| [39] |
U. A. Khan, A. Javed, R. Ashraf, An effective hybrid framework for content based image retrieval (CBIR), Multimed Tools Appl., 80 (2021), 26911–26937. doi: 10.1007/s11042-021-10530-x
|
Figures(7) / Tables(4)

Pavithra Latha Kumaresan, Subbulakshmi Pasupathi, Sindhia Lingaswamy, Sreesharmila Thangaswamy, Vimal Shunmuganathan, Danilo Pelusi. Fruit-Fly optimization based feature integration in image retrieval[J]. Mathematical Biosciences and Engineering, 2021, 18(5): 6178-6197. doi: 10.3934/mbe.2021309


 DownLoad: