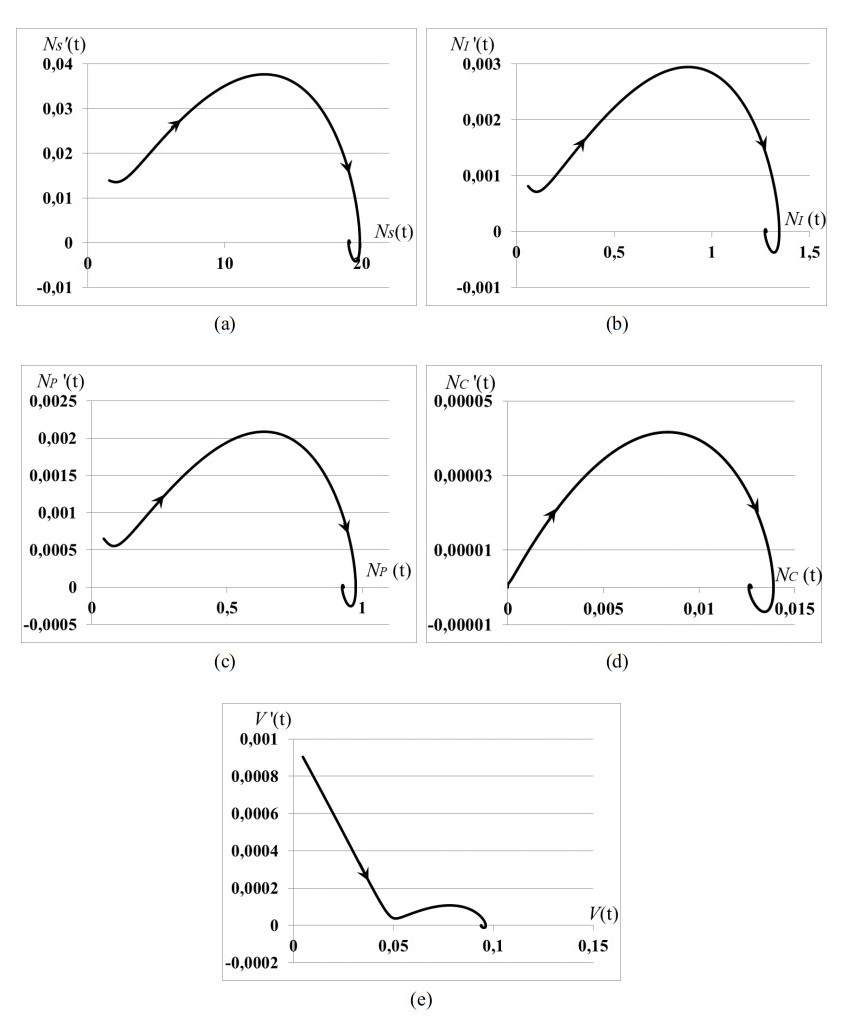
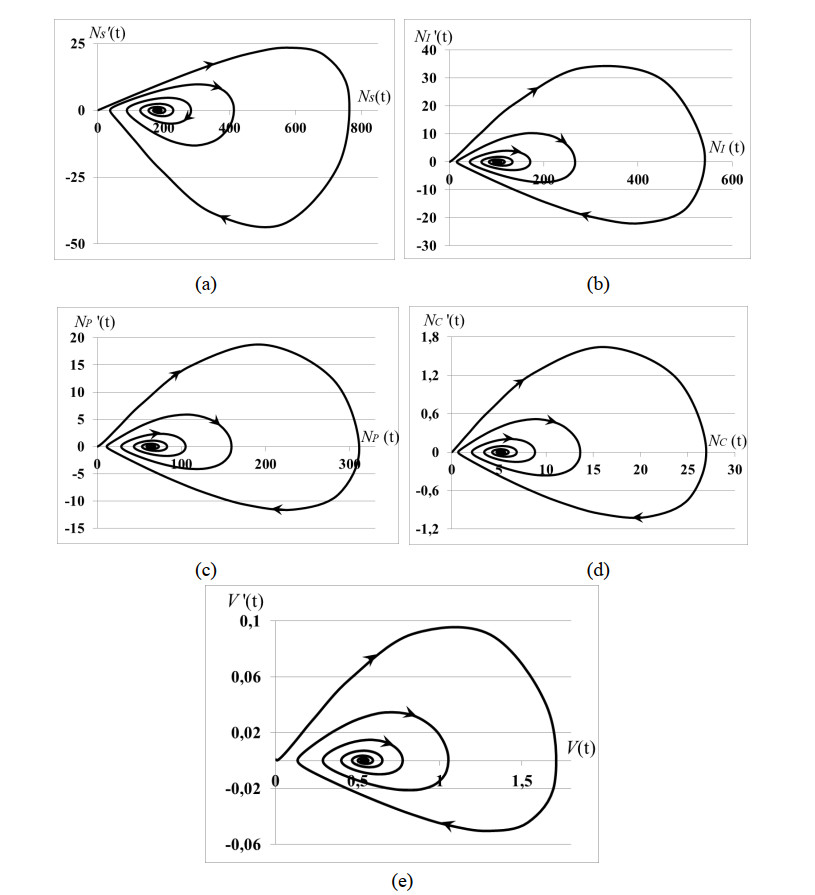
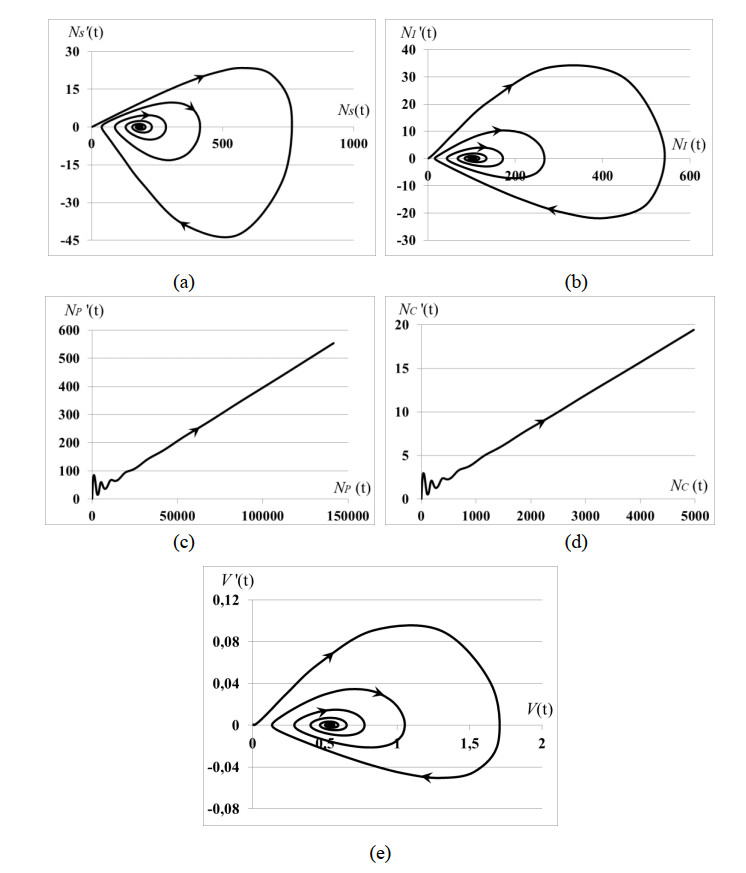
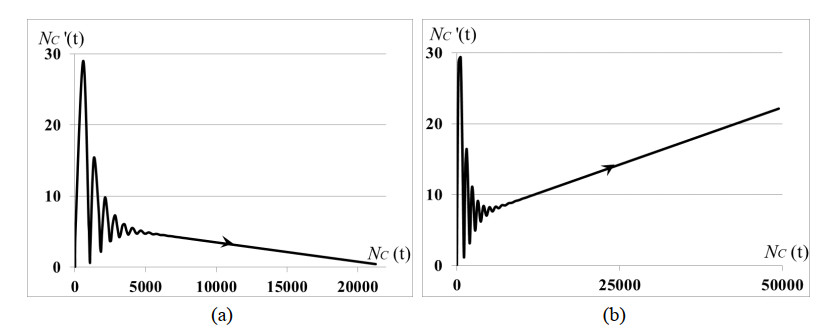
1.
Introduction
Cervical cancer induced by sexually transmitted human papilloma virus (HPV) is the second most common cancer in women worldwide [1,2,3,4]. The widespread prevalence of this disease stimulated extensive studies of HPV-epidemic models over the last several years. The research in this field is carried out in two directions: (i) epidemiology and population science (models of spread of HPV through a population, HPV vaccination of people, etc.) [5,6]; (ii) epidemiology and biological sciences (cellular and tissue modelling, cell-HPV interaction studies, etc.) [7,8,9]. The early studies in the framework of the second scientific direction (ii) used the unstructured models of population dynamics for several compartments – subpopulations of biological cells and HPV. The dynamics of virus population can be efficiently described by the unstructured model on the basis of nonlinear ODE because viruses are non-living things which do not proliferate and can replicate only within a living host cell. But unstructured models are not suitable for the modelling of cell population dynamics because they do not describe the cell's life history and provide only a restricted description of their population dynamics in many applications. The urgent need to gain insight the complex biological processes for deep and accurate understanding of patterns of population dynamics and a variety of dynamical regimes of populations motivated the development and implementation of age-structured, and more generally, physiologically structured, cell population dynamics and tumor growth modelling [3,10,11,12,13,14,15,16,17,18,19,20,21,22,23,24].
In this paper we study the new age-structured model of susceptible, infected, precancerous, cancer cells populations and unstructured model of human papilloma virus population (SIPCV epidemic model) dynamics which is continuation of the previous research described in works [8,25]. In this model we use the L. Hayflick limit theory [26] for modelling the proliferation in cell subpopulations. The model describes the life history of each cell (cell aging by L. Hayflick): birth, maturing up to the age when they can proliferate, division a limited number of times at the reproductive age, aging up to the final reproductive age and death. The cell division and mortality in subpopulations are described by the birth and death rates, respectively. The death rates of infected, precancerous and cancer cell subpopulations in our model do not depend on the HPV quantity since the immune system of organism does not respond to its own cells [1,3,4]. The death rate of HPV is considered as density-dependent function since immune system responds to the virus population growth [1,3,4]. Interaction between susceptible cells and HPV is described by the Lotka-Voltera incidence rate and leads to the growth of infected cells [25]. Some of infected cells become precancerous cells, and the other apoptosis when viruses leave infected cells and are ready to infect new susceptible cells [8,28]. Precancerous cells partially become cancer cells with the density-dependent saturated rate [8]. We assume that cancer cells do not apply pressure on the tissues of organism and have no effect on the proliferation and mortality of other cells and replication of HPV. This model is studied both theoretically and numerically. The existence theorem and explicit recurrent formula for the solution of the age-structured SIPCV model (like in work [25]) are beyond the aim and scope of this paper due to the complexity of the model and will be the subject of our further study.
The stability analysis of model is based on the study of conditions of existence of the positive (endemic) equilibrium of system and its asymptotical stability ([13,29,30,31,32,33,34,35,36,37]). We obtain the restrictions on the basic reproduction numbers of susceptible and cancer cell subpopulations, and coefficients of the system which guarantee existence of the endemic equilibrium. We prove that this equilibrium is always locally asymptotically stable whenever it exists. The numerical experiments confirm theoretical results and provide us with several topologically non-equivalent phase portraits of the model. Simulations reveal two asymptotically stable regimes with non-oscillating and oscillating dynamics in the vicinity of positive equilibrium and, at least, two unstable dynamical regimes (when the positive equilibrium does not exist). From the biological point of view the asymptotically stable dynamical regimes of cell-HPV population mean the localization of cancer without spreading it in organism. The unstable dynamical regimes of cell-HPV population mean the cancer metastasis. Overall, the theoretical and numerical analysis of autonomous age-structured SIPCV epidemic model help us better understand the features of HPV infectious and cancer disease.
2.
Model and main results
2.1. Model
SIPCV epidemic model considers the biological tissue which consists of susceptible (noninfected), infected (without significant changing of morphology, CIN I and CIN II stages [1,2,3,4,27]), precancerous (with changed by virus morphology - dysplasia, but is differentiable yet, CIN III stage [2,3,27]), cancer (nondifferentiable) cells and human papilloma virus (HPV) that moves freely between cells. The age-specific densities of susceptible, infected, precancerous and cancer cells subclasses are denoted as S(a,t), I(a,t), P(a,t) and C(a,t), respectively, and are defined in domain Q={(a,t)|a∈[0,ad],t≥0}, where ad is a maximum lifespan of cells. The total number (quantity) of susceptible, infected, precancerous and cancer cells subpopulations are denoted by NS(t)=∫ad0S(a,t)da, NI(t)=∫ad0I(a,t)da, NP(t)=∫ad0P(a,t)da, NC(t)=∫ad0C(a,t)da, respectively. The dynamics of cell subpopulations is described by the autonomous nonlinear age-structured model with death rates of susceptible cells ds, infected cells di, precancerous cells dp and cancer cells dc, with an age reproductive window of non-cancer cells [ar,am] and cancer cells [ac,ak], ac<ar, ak<am, (the age reproductive window of cancer cells is shifted in relation to the age reproductive window of non-cancer cells due to the abnormal program of cancer cell division when they divide before reaching the maturity of the reproductive window of non-cancer cells and therefore become nondifferentiable cells), the same birth rate of susceptible, infected and precancerous cells β0, and the birth rate of cancer cells βc. Due to the adaptive behaviour of the HPV immune system of organism (both T-killers cells and humoral immunity) does not respond to the infected, precancerous and cancer cells, that is their death rates do not depend on the HPV quantity. Since viruses are non-living things which do not proliferate and replicate only within a living host cell, the dynamics of HPV quantity V(t) is described by the non-linear ODE with density-dependent death rate dv(V). The latter describes the immune response of organism to the HPV population growth. The interaction between susceptible cells and HPV is a product of the Lotka-Voltera incidence rate αV(t)S(a,t) (where α is an infection rate) and result in the growth of infected cells. Infected cells partially move to the precancerous subpopulation with rate δI(a,t) (where δ is a progression rate from infected to precancerous cells (dysplasia)) and partially apoptosis with rate ndiNI(t), when viruses leave infected cells and are ready to infect susceptible cells (where n is a mean number of virions produced by an infectious cell, the death rate of infected cells di>ds since it is induced by HPV). Precancerous cells move to the cancer cell subpopulation with the saturated rate μ(NP)=θNP(t)1+kNP(t). When the abundance of precancerous cells (dysplasia) increases from the small value, the risk of developing cancer cells increases from the small value too. In this case μ(Np) is directly proportional to the Np with coefficient θ (progression rate). Since μ(Np) is a fraction of precancerous cells which move to cancer subclass per unit of time, it is a bounded parameter which increases and eventually tends to the saturated level θ/k<1 with Np→∞, where k is a coefficient of saturation [8].
These assumptions lead to the following autonomous epidemic model
where Λ is a constant recruitment rate of virus population. Equations (2.1)–(2.5) are completed by the boundary conditions and initial values:
where ϕ(a) is an initial density of susceptible cells, V0 is an initial value of HPV quantity. We impose the following restrictions on the density-dependent HPV death rate and cell's birth and death rates [1,2,3,4,27,28]:
Equations (2.11) and (2.12) consider the positiveness and boundness of cell birth and death rates. The restrictions (2.11) mean that increasing of HPV quantity changes the characteristics of intracellular space that result in the organism immune response through the activation of cell immunity (T-killers) and humoral immunity (B-lymphocytes) that leads to the elimination of viruses (i.e. monotone increasing of their death rate). The constant d0 restricts the intrinsic density independent part of death rate.
2.2. Existence of the positive (endemic) equilibrium of autonomous system (2.1)–(2.10)
The trivial, disease free equilibrium (DFE) of the system (2.1)–(2.10) exists if an infection rate α=0. In this case biological tissue consists only from susceptible cells and its dynamics is defined by the basic reproduction number of susceptible cell subpopulation. Since we consider only positive infection rate α>0 (Eq (2.12)), the analysis of DFE is beyond of our study. Further we consider the conditions of existence of positive (endemic) equilibrium of system (2.1)–(2.10): S∗(a)≥0 is a positive equilibrium of susceptible cells with an equilibrium quantity N∗S=∫ad0S∗(a)da>0; I∗(a)≥0 is a positive equilibrium of infected cells with an equilibrium quantity N∗I=∫ad0I∗(a)da>0; P∗(a)≥0 is a positive equilibrium of precancerous cells with an equilibrium quantity N∗P=∫ad0P∗(a)da>0, C∗(a)≥0 is a positive equilibrium of cancer cells with an equilibrium quantity N∗C=∫ad0C∗(a)da>0, V∗>0 is a positive equilibrium of HPV. This positive equilibrium of system (2.1)–(2.10) satisfies the stationary system:
where di=di+δ, dp(N∗P)=dp+μ(N∗P). Equations (2.13)–(2.17) are completed by the boundary conditions:
We seek the solution of the boundary problem (2.13)–(2.19) S∗(a), I∗(a), P∗(a), C∗(a). From Eq (2.17) we have
where we assume that
Using Eq (2.18) we obtain the integral equation for the solution of Eq (2.13):
Integrating Eq (2.22) with respect to a form ar to am, after a little algebra we arrive to the transcendental equation for determination of V∗ :
Integrating Eq (2.22) with respect to a form 0 to ad we obtain the equation for the equilibrium quantity of susceptible cells:
Substituting this expression in Eq (2.22) we obtain the solution S∗(a) and equation for the equilibrium density of susceptible cells N∗S :
where AS is an auxiliary positive constant. Using the boundary condition (2.19) we can write the integral equation for the solution of Eq (2.14):
Integrating Eq (2.27) with respect to a form ar to am, and using Eq (2.25), after a little algebra we arrive to the integral equation:
Expressing ∫amarI∗(a)da from Eq (2.28) and substituting it together with Eq (2.23) in Eq (2.27), after a little algebra we obtain the positive equilibrium I∗(a) :
HPV equilibrium V∗ has to satisfy restriction
which guarantees positiveness of the auxiliary constant AI and equilibrium I∗(a). Integrating I∗(a) (Eq (2.29)) with respect to a form 0 to ad and using Eq (2.30), we have
From Eqs (2.20), (2.26) and (2.32) we arrive to the equilibrium quantity of susceptible cells:
Hence, if Eq (2.23) has a real root V∗>0 (i.e. the positive equilibrium quantity of HPV) satisfied restrictions (2.21) and (2.31), the equilibrium densities of susceptible and infected cells are defined by Eqs (2.25), (2.29) with auxiliary constants (2.26), (2.30), and the equilibrium quantity of susceptible and infected cells are defined by Eqs (2.33), (2.20), respectively.
Solution of problem (2.15), (2.20) satisfies the integral equation:
Integrating Eq (2.34) with respect to a form ar to am, and using Eqs (2.23), (2.29), (2.30), after a little algebra we arrive to the integral equation:
Since the left-hand side of Eq (2.35) must be positive the equilibrium quantity N∗P and coefficients of the system have to satisfy the restriction:
Substituting expression ∫amarP∗(a)da from Eq (2.35) together with Eqs (2.23), (2.29), (2.30), in Eq (2.35), after a little algebra we obtain the positive equilibrium P∗(a) :
Equation (2.36) guaranties positiveness of the auxiliary constant AP(N∗P) and equilibrium P∗(a)>0. Integrating Eq (2.37) with respect to a form 0 to ad we obtain the quadratic equation for the equilibrium quantity of precancer cells N∗P :
If the positive solution of Eq (2.39) exists it can be given by
Using the simple algebra, it is easy to verify that the equilibrium quantity of precancerous cells (2.41) is positive N∗p>0 and satisfies restriction (2.36) if the HPV equilibrium V∗ and coefficients of the system satisfy condition
Thus, if restriction (2.42) holds there exists the positive equilibrium of precancerous cells N∗p (2.41), and after that HPV equilibrium V∗ has to satisfy restriction (2.36). If condition (2.42) does not hold, restriction (2.36) does not hold too. Solution of the problem (2.16), (2.19) satisfies the integral equation:
Integrating Eq (2.43) with respect to a form ac to ak, after a little algebra we arrive to the equation:
Since the expression in the right-hand side of Eq (2.44) is positive, integral ∫akacC∗(a)da>0, if
where RC is a basic reproduction number of a cancer cell sub-population. Restriction (2.45) guarantees the positiveness of equilibrium C∗(a) in Eq (2.43). Expressing ∫akacC∗(a)da from Eq (2.44) and substituting it together with Eq (2.37), in Eq (2.43), after integration and a little algebra we arrive to the positive equilibrium of cancer cell's density C∗(a) :
Integrating Eq (2.42) with respect to a form 0 to ad we obtain the corresponding equilibrium quantity of cancer cells:
The results obtained above are summarized in the Theorem 2.1.
Theorem 2.1. The system (2.1)–(2.5) possess a positive (endemic) equilibrium S∗(a)≥0, N∗S>0, I∗(a)≥0, N∗I>0, P∗(a)≥0, N∗P>0, C∗(a)≥0, N∗C>0, V∗>0, if and only if there exists the real positive root V∗>0 of transcendental equation RV(V∗)=1 (Eq (2.23)) for which conditions (2.21), (2.31), (2.36), (2.42), hold and the basic reproduction number of cancer cell population RC<1 (Eq (2.45)). The equilibrium values of all parameters are determined through V∗ : S∗(a) - Eqs (2.25), (2.26), N∗S - Eq (2.33), I∗(a) – Eqs (2.29), (2.30), N∗I - Eq (2.20), P∗(a) – Eqs (2.37), (2.38), N∗P - (2.41), C∗(a) – Eqs (2.46), (2.47), N∗C - Eq (2.48).
Remark 2.1. Parameter RV(V∗) is a decreasing function of V∗≥0 :
Hence, the necessary and sufficient condition of existence of a positive root V∗>0 of transcendental equation RV(V∗)=1 (Eq (2.23)) is the condition RV(0)>1, that is the basic reproduction number of susceptible cell population RS is bigger than one:
2.3. Local asymptotic stability of the positive (endemic) equilibrium of autonomous system (2.1)–(2.10)
Linearizing system (2.1)–(2.5) at the positive equilibrium S∗(a)≥0, N∗S>0, I∗(a)≥0, N∗I>0, P∗(a)≥0, N∗P>0, C∗(a)≥0, N∗C>0, V∗>0, we arrive to the system for perturbations ˉψs(a,t)=ψs(a)exp(λt) and ˉξs(t)=∫ad0ˉψs(a,t)da=∫ad0ψs(a)daexp(λt)=ξsexp(λt) for S∗(a) and N∗S, ˉψi(a,t)=ψi(a)exp(λt) and ˉξi(t)=∫ad0ˉψi(a,t)da=ξiexp(λt) for I∗(a) and N∗I, ˉψp(a,t)=ψp(a)exp(λt) and ˉξp(t)=∫ad0ˉψp(a,t)da=ξpexp(λt) for P∗(a) and N∗P, ˉψc(a,t)=ψc(a)exp(λt) and ˉξc(t)=∫ad0ψc(a,t)da=ξcexp(λt) for C∗(a) and N∗C, ˉψv(t)=ψvexp(λt) for V∗ :
where ∂μ(N∗P)∂NP=θ(1+kN∗P)2>0. Equations (2.51)–(2.55) are completed by the boundary conditions:
System (2.51)–(2.57) is reduced to the system of integral equations:
First, we analyse the existence of the real positive characteristic numbers λ>0 of the linear system (2.51)–(2.57). Integrating both sides of Eq (2.58) with respect to a from ar to am yields:
Integrating Eq (2.62) with respect to a from 0 to ad we arrive to the linear homogeneous equation for the perturbations ξs and ψv :
Integrating Eq (2.59) with respect to a from ar to am, and using Eqs (2.23), (2.63), we arrive to the equation:
where λ+ di−ds−αV∗>0 for λ>0 (see Eq (2.31)). We assume that λ≠αV∗, because when λ=αV∗ function perturbations ψv=0 (Eq (2.64)), ξs=0 (Eq (2.63)) and we obtain the trivial solution. Substituting ∫amarψi(a)da in Eq (2.59) after integration and a little algebra we arrive to the solution of Eq (2.59):
Integrating Eq (2.65) with respect to a form 0 to ad we obtain the linear homogeneous equation for the perturbations ξi and ψv :
Integrating Eq (2.60) with respect to a from ar to am, and using Eqs (2.23), (2.37), (2.38), (2.65), we arrive to the equation:
where λ+ dp(N∗P)−ds−αV∗>0 for λ>0 (see Eqs (2.36), (2.42)). Substituting Eq (2.65) in Eq (2.60), after integration and a little algebra we obtain the solution of Eq (2.60):
Integrating Eq (2.68) with respect to a from 0 to ad, we arrive to the linear homogeneous equation for the perturbations ξp and ψv :
Integrating Eq (2.61) with respect to a from ac to ak, and using Eqs (2.23), (2.37), (2.68), yields:
We assume that XC(λ)≠0, YC(λ)≠0 for λ>0 because otherwise function perturbations ψv=0, ξp=0 (Eqs (2.69), (2.70)) and we obtain the trivial solution. Substituting Eqs (2.70)–(2.74) in Eq (2.61), after integration we arrive to the solution of Eq (2.61):
where BC(λ)=X−1(λ)Y(λ). Integrating Eq (2.75) with respect to a from 0 to ad we arrive to the linear homogeneous equation for the perturbations ξc, ξp and ψv :
Substituting Eq (2.66) in Eq (2.55) we obtain the last equation of the system for ψv :
where Ad,Av>0 are auxiliary constants (see Eqs (2.11), (2.31)). Equating to zero determinant of the linear system (2.63), (2.66), (2.69), (2.76), (2.77) we arrive to the characteristic equation for λ :
We analyse existence of the real positive roots of Eq (2.79). Since ∂μ(N∗P)∂NP=θ(1+kN∗P)2>0 and condition (2.42) holds, expression in the first briskets is always positive for λ>0. Hence, we analyse existence of the positive roots λ>0 (λ≠αV∗) of equation obtained by equating to zero the second briskets in Eq (2.79) transformed to the form:
Cubic polynomial y1(λ) has three zeroes: λ1=0, λ2=−Ad<0, λ3=−Av<0, and y1(λ)→∞ for λ→∞. Obviously that a cubic function y1(λ) and a linear increasing function y2(λ) intersect in domain λ>0 if there exists such point λ0>0, solution of equation ∂y1(λ0)∂λ=∂y2(λ0)∂λ, at which y1(λ0)≤y2(λ0). Parameter λ0>0 is given:
Substituting Eq (2.33) in Eq (2.84) yields:
Since ∂dv(V∗)∂V>0 and Λ≥0, inequality (2.85) does not hold. It means that λ0>0 - a real positive root of equation ∂y1(λ0)∂λ=∂y2(λ0)∂λ, at which y1(λ0)≤y2(λ0), does not exist, and characteristic equation (2.77) does not have a real positive root λ∗>0.
Second, we analyse existence of the trivial characteristic number λ=0 of linear system (2.55), (2.58)–(2.57). Substituting λ=0 in Eq (2.58), integrating them with respect to a from ar to am and excluding from obtained expression Eq (2.23) yields:
In this case ψv=0 and we only obtain a trivial solution of system that is the characteristic number λ cannot take the trivial value.
Finally, if condition (2.84) does not hold and Eq (2.79) does not have a real positive root, we analyse existence of the complex characteristic roots with nonnegative real part. We seek the pure imaginary root λ=iω (where ω≠0 is unknown real parameter) for which there exists the non-trivial solution of system (2.51)–(2.57). Substituting λ=iω in Eqs (2.51)–(2.55) and separating imaginary parts of equations yields:
From Eq (2.87) it follows that the nontrivial solution of system (2.51)–(2.57) exists if and only if ω=0, that is characteristic Eq (2.79) does not have complex roots with non-negative real part. The results obtained above are summarized in the Theorem 2.2.
Theorem 2.2. Let conditions of Theorem 2.1 hold, the positive equilibrium of system (2.1)–(2.10) S∗(a)≥0, N∗S>0, I∗(a)≥0, N∗I>0, P∗(a)≥0, N∗P>0, C∗(a)≥0, N∗C>0, V∗>0 is always locally asymptotically stable.
2.4. Numerical experiments
The theoretical results obtained in Theorems 2.1 and 2.2 are illustrated by the numerical experiments. For simulation of the autonomous model (2.1–2.10), we use the explicit formulae of method of characteristics from [25]. The set of coefficients and initial values of autonomous system (2.1–2.10) used in simulations is given in Appendix A.
First, using the bisection method we find numerically the positive real root of Eq (2.23) V∗ which satisfies conditions of Theorem 2.1, and compute the positive equilibrium - N∗S (2.33), S∗(a) (2.25), N∗I (2.20), I∗(a) (2.29), N∗P (2.41), P∗(a) (2.37), N∗C (2.48), C∗(a) (2.46). Our goal here is to study the dynamical regimes of cell and HPV population in the vicinity of the positive equilibria.
Experiment I. Case (i) RS≤1, RC<1. In this case Eq (2.23) does not have the positive root V∗>0 (see Remark 2.1 to Theorem 2.1). The quantity of susceptible, infected, precancerous, cancer cells and HPV quantity asymptotically evolve to the trivial equilibrium. Such dynamical regime is not interesting and valuable in practice and does not deserve our attention.
Experiment II. Case (ii) RS>1, RC<1 (non-oscillating dynamical regimes). If coefficients of the system (2.1)–(2.10) satisfy conditions (2.21), (2.31), (2.36), (2.42) of Theorem 2.1 the dynamical regimes of cell and virus populations correspond to the stable asymptotic behavior in the vicinity of nontrivial equilibrium. We observe two kinds of population behavior – non-oscillating dynamics (case (ii)) and oscillating dynamics (case (iii)).
The results of numerical experiments exhibited the case (ii) of dynamical regimes are shown in the phase diagrams in Figure 1a (susceptible cell population), Figure 1b (infected cell population), Figure 1c (precancerous cell population), Figure 1d (cancer cell population), Figure 1e (HPV population). The graphs in all figures are given in phase coordinates Y'(t)=dY(t)dt and Y(t), where Y(t) is a quantity of corresponding cells or HPV. The arrow on the graphs shows the direction of increasing of time t.
Since in case (ii) the conditions of Theorem 2.1 hold, there exists the positive root of Eq (2.23) V∗>0 and the positive equilibrium of system (2.1)–(2.10). By virtue of Theorem 2.2 this equilibrium is always locally asymptotically stable. All graphs in Figures 1a – 1e illustrate the asymptotic convergence of all cells and HPV quantities to the corresponding positive equilibrium. Since we do not observe the cycles on the phase diagrams, solution converges to the positive equilibrium without oscillations with a little wiggle.
Experiment II. Case (iii) RS>1, RC<1 (oscillating dynamical regimes). In this experiment coefficients of the system (2.1)–(2.10) satisfy conditions (2.21), (2.31), (2.36), (2.42) of Theorem 2.1. We continue to study the particularities of asymptotic behavior of solution in the vicinity of positive equilibrium increasing value of the birth rate of susceptible, infected and precancerous cells and HPV death rate (see Appendix A). The results of numerical experiments exhibited case (iii) of dynamical regimes are shown in the phase diagrams in Figure 2a (susceptible cell population), Figure 2b (infected cell population), Figure 2c (precancerous cell population), Figure 2d (cancer cell population), Figure 2e (HPV population).
Since in case (iii) conditions (2.21), (2.31), (2.36), (2.42) of Theorem 2.1 hold, there exists the positive equilibrium of system (2.1)–(2.10). Graphs in Figure 2a–e illustrate the local asymptotic stability of all trajectories in the vicinity of positive equilibrium and exhibit the convergence of all cells and HPV quantities to the corresponding positive equilibrium with oscillations of large magnitude. The magnitude of these oscillations can be estimated by the dimension of cycles on the phase diagrams.
Experiment II. Case (iv) RS>1, RC<1 (unstable regime). In this experiment coefficients of the system (2.1)–(2.10) do not satisfy conditions (2.36), (2.42) of Theorem 2.1 (see Appendix A). The results of numerical experiments exhibited case (iv) of dynamical regimes are shown in the phase diagrams in Figure 3a (susceptible cell population), Figure 3b (infected cell population), Figure 3c (precancerous cell population), Figure 3d (cancer cell population), Figure 3e (HPV population).
Since in case (iv) conditions (2.36), (2.42) of Theorem 2.1 do not hold, the positive equilibrium of system (2.1)–(2.10) does not exist. Graphs in Figures 3a, 3b, 3e show the oscillating dynamics of the quantity of susceptible, infected cell subpopulations and HPV subpopulation with following their convergence to some stationary values, like in the previous case (iii).
Since N'P(t)>0 in Figure 3c and N'C(t)>0 in Figure3d the graphs in these figures show the wiggle (non-oscillating) dynamics of the quantity of precancerous and cancer cell subpopulations with their subsequent unlimited exponential growth. The section of straight increasing line with arrow in phase diagram in Figure 3c, d corresponds to the exponentially increasing function on the traditional plane with coordinates NP(t) and t, NC(t) and t, respectively. In spite of the small basic reproduction number RC=0.59 the quantity of cancer cell population evolves to infinity. Such dynamics is induced by the unlimited growth of precancerous cell subpopulation which plays the role of donor for cancer cell subpopulation. From the biological point of view this dynamical regime corresponds to the growth of dysplasia and formation of metastasis in organism.
Experiment III. Case (v) RS>1, RC≈1. In the last group of experiments, we study the behavior of solution when the basic reproduction number of cancer cell population RC<1 and RC>1. We consider the same set of the coefficients and constants as in the Experiment II but take the bigger values of birth rates of cancer cells βc (Appendix A) that corresponds to the bigger value of RC.
In the first simulation RC=0,99993, and the set of all coefficients and constants (except βc) is the same as in case (iii). Since RS>1, RC<1, and coefficients of the system (2.1)–(2.10) satisfy conditions (2.21), (2.31), (2.36), (2.42) of Theorem 2.1, there exists the positive equilibrium of system (2.1)–(2.10). In numerical experiment we obtain the same type of oscillating dynamical regime as in case (iii) in the vicinity of positive equilibrium of susceptible, infected, precancerous cell populations and HPV population shown in Figure 2a–c, e.
The dynamical regime of cancer cell population in this simulation differs essentially from the one obtained in case (iii). The results of simulation are shown in the phase diagram in Figure 4a. Since N'C(t)>0 in Figure 4a, we obtain the wiggle dynamical regime of the cancer cell quantity with subsequent asymptotic exponential convergence of it to the positive equilibrium, instead of oscillating dynamics shown in Figure 2d.
In the second simulation RS>1, RC=1.00008, and the set of all coefficients and constants of the system (2.1)–(2.10) satisfy conditions (2.21), (2.31), (2.36), (2.42) of Theorem 2.1 and is the same (except βc) as in case (iii) (see Appendix A). Since RC>1, conditions of Theorem 2.1 do not hold, and the positive equilibrium of system (2.1)–(2.10) does not exist. In this simulation we obtain the same type of oscillating dynamical regime as in case (iii) in the vicinity of the positive equilibrium of susceptible, infected, precancerous cell subpopulations and HPV subpopulation shown in Figure 2a–c, e. The dynamical regime of the cancer cell subpopulation obtained in this experiment differs from the one obtained in case (iii) and is the same as in simulation of case (iv) (for RC<1). The results of simulation are shown in the phase diagram in Figure 4b. Since N'C(t)>0, we observe the wiggle dynamical regime of the cancer cell subpopulation quantity (without oscillation) with subsequent unlimited exponential growth. Thus, the absence of the positive equilibrium in this case means the unstable dynamical regime of the system (2.1)–(2.10).
3.
Discussion and conclusions
In this paper we study an autonomous epidemic model of age-structured population dynamics of susceptible, infected, precancerous and cancer cells and unstructured model of population dynamics of human papilloma virus (HPV) (SIPCV epidemic model). The model considers the problem of HPV propagation and cancer disease dynamics on the tissue level and includes the competitive system of initial-boundary value problems for semi-linear transport equations with non-local boundary conditions (renewal equations) and initial problem for nonlinear ODE. We carried out the stability analysis of this autonomous system, obtained the conditions of existence of the positive (endemic) equilibrium and proved that this equilibrium is always locally asymptotically stable whenever it exists. Theoretical analysis revealed two key parameters important for the study of cervical cancer disease – the basic reproduction numbers of susceptible cell population RS and cancer cell population RC. The necessary and sufficient condition of existence of the positive equilibrium of system, as it was expected, imposes the restriction on the basic reproduction number of susceptible cell population: RS>1, that is the healthy biological tissue must be growing for providing the sufficient environment for the HPV replication and propagation, and development of the cancer tissue. The particularity of the semi-linear transport equation of cancer cell population dynamics is that it does not impact on the dynamics of the other cell and HPV sub-populations since all other equations of the system do not depend from the cancer cell density or cancer cell quantity. This property of model is a consequence of our hypothesizes that immune system of organism is tolerant with respect to its own cervical cancer cells and cancer cells do not apply pressure on the tissues of organism and have no effect on the proliferation and mortality of the other cells and replication of HPV. Thus, when the positive equilibrium of system exists and the cancer cell population is not empty, their farther dynamics depends only on the basic reproduction number RC. If RC<1 cancer cell population evolve eventually to the stationary state that means the localization of tumor tissue, and if RC>1 cancer cell population grows infinitely that means the formation of metastasis in organism. The unlimited growth of cancer cell population can also appear even for RC<1, when the positive equilibrium of system does not exist, but susceptible, infected cell subpopulations and HPV subpopulation eventually evolve to some stationary values and precancerous cell subpopulation (dysplasia) grows infinitely. In this case precancerous cells induce the cancer cell outbreak and subpopulation of cancer cells grows infinitely.
Numerical experiments illustrate and confirm the theoretical results obtained in paper. When the basic reproduction number of susceptible cell subpopulation RS≤1 (case (i)) the positive equilibrium of system does not exist, and simulation showed that all cell and HPV subpopulations eventually evolve to zero. This is a trivial solution of the model which is not valuable in epidemiological problem. When RS>1, RC<1, and all coefficients and constants of system (2.1)–(2.10) satisfy conditions (2.21), (2.31), (2.36), (2.42) of Theorem 2.1, the positive equilibrium of system exists. Simulation showed that in this case there are three types of dynamical asymptotically stable regimes: non-oscillating convergence of solution to the positive equilibrium (case (ii)), oscillating convergence of solution to the positive equilibrium (case (iii)), wiggle dynamics with subsequent exponential convergence of solution to the positive equilibrium (first simulation in case (v), RC=0.99995). The common feature of all these dynamical regimes is that cancer cell population cannot grow infinitely, their dynamics is related to the dynamics of all other cells of tissue and the quantity of cancer cells eventually evolves to the stationary state. Results of the simulations in these cases confirm the theoretical conclusion about a localization of cancer tissue. When RS>1, RC<1, and coefficients and constants of system (2.1)–(2.10) do not satisfy condition (2.42) of Theorem 2.1, the positive equilibrium of system does not exist. Simulation showed that in this case the quantity of susceptible, infected cell subpopulations and HPV subpopulation oscillated and eventually evolved to some stationary values and the quantity of precancerous cell subpopulation (dysplasia) showed the wiggle dynamics with subsequent unlimited growth. In spite of the small value of the basic reproduction number RC<1, cancer cell subpopulation also grew infinitely together with precancerous cell subpopulation that means the growth of dysplasia and cancer metastasis in organism.
And the last, but not least case when RS>1, RC>1, and all coefficients and constants of the system satisfy the conditions of Theorem 2.1, except RC. In this case (the second simulation in case (iv), RC=1.00008), like in case (i), system does not have the positive equilibrium, but the dynamical regime of population is significantly different from case (i). The quantities of susceptible, infected, precancerous cells and HPV converge to the stationary states, except the cancer cell quantity. Cancer cell subpopulation exhibits the wiggle dynamics (without oscillation) with consequence unlimited exponential growth, that is the dynamics of cancer cells is not stable and leads to the formation of metastases in organism. Thus, the results of all numerical experiments confirm the conclusions of theoretical analysis.
Overall, the main result of this paper - development of the SIPCV age-structured epidemic model and stability analysis of autonomous system of this model, provide the theoretical instrument for the qualitative analysis of dynamical regimes of susceptible, infected, precancerous, cancerous cells and HPV populations that help us better understand the features of HPV infectious and cancer disease.
Acknowledgments
We would like to acknowledge Department of Mathematics, Universitas Gadjah Mada for the organizational support of this study.
Conflict of interest
All authors declare no conflict of interest in this paper.
Appendix A.
The set of coefficients and constants in numerical experiments
The set of constants used in numerical experiments is given in Table A1. The coefficients and initial values of the system used in all numerical experiments are:
In the different numerical experiments, in addition to the constants from the Table A1, we use the coefficients given in the Table A2.