The outbreak of coronavirus disease 2019 (COVID-19) in Wuhan, which is caused by the severe acute respiratory syndrome coronavirus 2 (SARS-CoV-2), is still severe. In order to optimize the epidemic response strategy, it is urgent to evaluate the implemented prevention and control interventions (PCIs). Based on the reported data of Chongqing and Guizhou Provinces, the phased dynamic models of COVID-19 were constructed, the average intensity of the existing PCIs (from January 25 to March 2) was estimated in these two provinces. The results indicate that both provinces have carried out better control of the infected, but there are still differences in the intensity of control for people who need close observation. Especially in Chongqing, the estimated strength is significantly smaller than that in Guizhou. Furthermore, qualitative evaluations on the epidemic of COVID-19 under different PCIs scenarios suggest that containment strategy is still necessary to ensure the safety of resumption of work and school, and quarantining the city of Wuhan is an important and effective containment strategy to reduce the epidemic in other provinces.
Citation: Chenxi Dai, Jing Yang, Kaifa Wang. Evaluation of prevention and control interventions and its impact on the epidemic of coronavirus disease 2019 in Chongqing and Guizhou Provinces[J]. Mathematical Biosciences and Engineering, 2020, 17(4): 2781-2791. doi: 10.3934/mbe.2020152
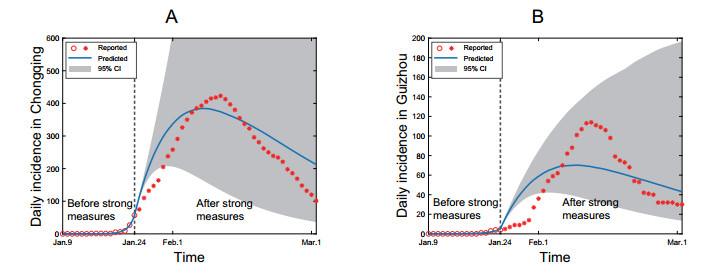
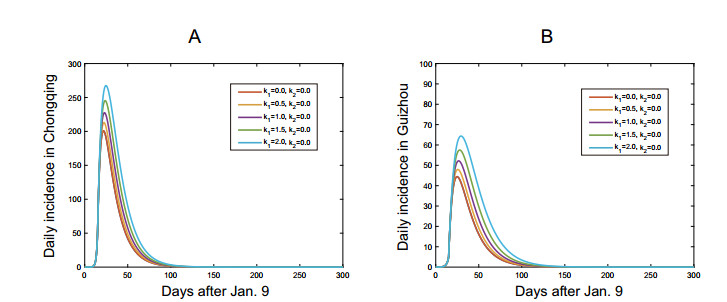
The outbreak of coronavirus disease 2019 (COVID-19) in Wuhan, which is caused by the severe acute respiratory syndrome coronavirus 2 (SARS-CoV-2), is still severe. In order to optimize the epidemic response strategy, it is urgent to evaluate the implemented prevention and control interventions (PCIs). Based on the reported data of Chongqing and Guizhou Provinces, the phased dynamic models of COVID-19 were constructed, the average intensity of the existing PCIs (from January 25 to March 2) was estimated in these two provinces. The results indicate that both provinces have carried out better control of the infected, but there are still differences in the intensity of control for people who need close observation. Especially in Chongqing, the estimated strength is significantly smaller than that in Guizhou. Furthermore, qualitative evaluations on the epidemic of COVID-19 under different PCIs scenarios suggest that containment strategy is still necessary to ensure the safety of resumption of work and school, and quarantining the city of Wuhan is an important and effective containment strategy to reduce the epidemic in other provinces.

| [1] | World Health Organization (WHO), Novel Coronavirus-China, Accessed 3 Mar 2020. Available from: https://www.who.int/csr/don/12-january-2020-novel-coronavirus-china/en/. |
| [2] |
J. T. Wu, K. Leung, G. M. Leung, Nowcasting and forecasting the potential domestic and international spread of the 2019-nCoV outbreak originating in Wuhan, China: a modeling study, Lancet, 395 (2020), 689-697. doi: 10.1016/S0140-6736(20)30260-9

|
| [3] | J. M. Read, J. R. E. Bridgen, D. A. T. Cummings, A. Ho, C. P. Jewell, Novel coronavirus 2019-nCoV: early estimation of epidemiological parameters and epidemic predictions, MedRxiv, 2020. |
| [4] | X. Yu, Updated Estimating Infected Population of Wuhan Coronavirus in different policy scenarios by SIR Model, Infectious diseases: Comments, 2020. |
| [5] | B. Tang, X. Wang, Q. Li, N. L. Bragazzi, S. Tang, Y. Xiao, et al., Estimation of the transmission risk of 2019-nCov and its implication for public health interventions, SSRN Electron. J., (2020). Available from: https://papers.ssrn.com/sol3/papers.cfm?abstract_id=3525558. |
| [6] | Health Committees of Chongqing, Daily report of epidemic situation, Accessed 10 Jan to 4 Feb 2020. Available from: http://wsjkw.cq.gov.cn/. |
| [7] | Health Committees of Guizhou, Daily report of epidemic situation, Accessed 10 Jan to 4 Feb 2020. Available from: http://http://www.gzhfpc.gov.cn/. |
| [8] | Chongqing Provincial Burcau of Statistics NBS Survey Office in Chongqing, Chongqing Statistical yearbook-2019, China Statistics Press, (2019). Available from: http://tjj.cq.gov.cn//tjnj/2019/indexch.htm. |
| [9] | Guizhou Provincial Burcau of Statistics NBS Survey Office in Chongqing, Guizhou Statistical yearbook-2019, China Statistics Press, (2019). Available from: http://202.98.195.171:82/2019/zk/indexch.htm. |
| [10] | Baidu, Baidu migration, Accessed 10-24 Jan 2020. Available from: http://qianxi.baidu.com/. |
| [11] |
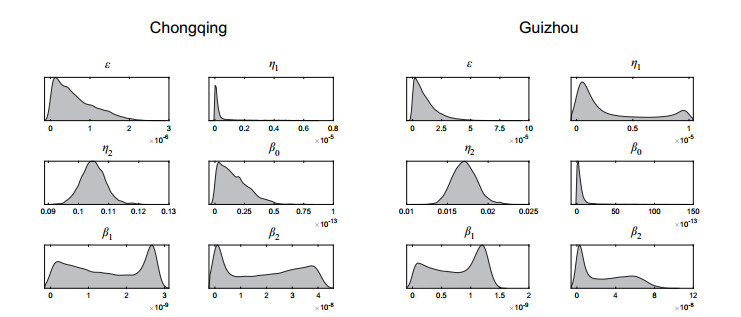
H. Haario, M. Laine, A. Mira, E. Saksman, DRAM: efficient adaptive MCMC, Stat. Comput., 16 (2006), 339-354. doi: 10.1007/s11222-006-9438-0
|
| [12] | World Health Organization (WHO), Statement on the second meeting of the International Health Regulations (2005) Emergency Committee regarding the outbreak of novel coronavirus (2019-nCoV)[EB/OL], Accessed 4 Feb 2020. Available from: https://www.who.int/news-room/detail/30-01-2020-tatement-on-the-second-meetingof-the-international-health-regulations-(2005-emergency-committeeregarding-the-outbreak-of-novel-coronavirus-(2019-ncov)). |
| [13] | National Health Committee, Announcement of the National Health Committee of the People's Republic of China, Accessed 4 Feb 2020. Available from: http://www.nhc.gov.cn/jkj/s7916/202001/44a3b8245e8049d2837a4f27529cd386.shtml. |
| [14] | Strategy and Policy Working Group for NCIP Epidemic Response, Urgent research agenda for the novel coronavirus epidemic transmission and non-pharmaceutical mitigation strategies, Chin. J. Epidemiol., 41 (2020), 135-136. |
Figures(6) / Tables(3)

Chenxi Dai, Jing Yang, Kaifa Wang. Evaluation of prevention and control interventions and its impact on the epidemic of coronavirus disease 2019 in Chongqing and Guizhou Provinces[J]. Mathematical Biosciences and Engineering, 2020, 17(4): 2781-2791. doi: 10.3934/mbe.2020152


 DownLoad: