Dynamics of a Filippov epidemic model with limited hospital beds

  • Received: 18 April 2017 Revised: 08 October 2017 Published: 01 June 2018
  • MSC : Primary: 92D30, 92B05; Secondary: 34C05

  • A Filippov epidemic model is proposed to explore the impact of capacity and limited resources of public health system on the control of epidemic diseases. The number of infected cases is chosen as an index to represent a threshold policy, that is, the capacity dependent treatment policy is implemented when the case number exceeds a critical level, and constant treatment rate is adopted otherwise. The proposed Filippov model exhibits various local sliding bifurcations, including boundary focus or node bifurcation, boundary saddle bifurcation and boundary saddle-node bifurcation, and global sliding bifurcations, including grazing bifurcation and sliding homoclinic bifurcation to pseudo-saddle. The impact of some key parameters including the threshold level on disease control is examined by numerical analysis. Our results suggest that strengthening the basic medical conditions, i.e. increasing the minimum treatment ratio, or enlarging the input of medical resources, i.e. increasing HBPR (i.e. hospital bed-population ratio) as well as the possibility and level of maximum treatment ratio, can help to contain the case number at a relatively low level when the basic reproduction number R0>1. If R0<1, implementing these strategies can help in eradicating the disease although the disease cannot always be eradicated due to the occurring of backward bifurcation in the system.

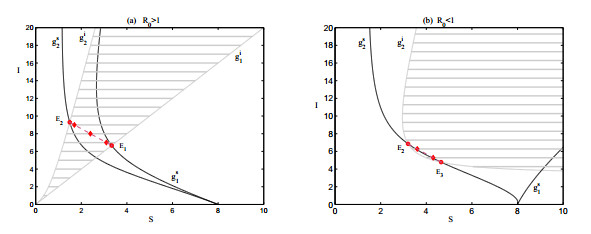
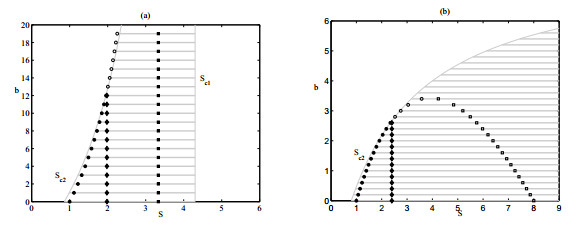
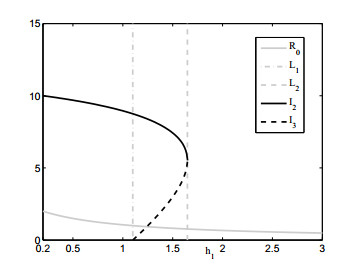
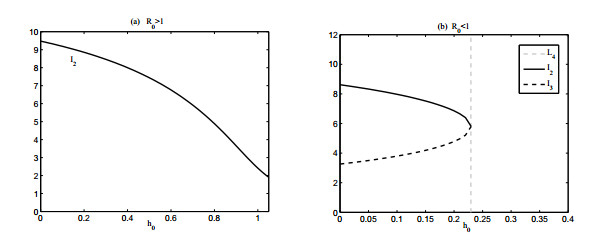
    Citation: Aili Wang, Yanni Xiao, Huaiping Zhu. Dynamics of a Filippov epidemic model with limited hospital beds[J]. Mathematical Biosciences and Engineering, 2018, 15(3): 739-764. doi: 10.3934/mbe.2018033

    Related Papers:

    [1] Baolin Kang, Xiang Hou, Bing Liu . Threshold control strategy for a Filippov model with group defense of pests and a constant-rate release of natural enemies. Mathematical Biosciences and Engineering, 2023, 20(7): 12076-12092. doi: 10.3934/mbe.2023537
    [2] Guodong Li, Wenjie Li, Ying Zhang, Yajuan Guan . Sliding dynamics and bifurcations of a human influenza system under logistic source and broken line control strategy. Mathematical Biosciences and Engineering, 2023, 20(4): 6800-6837. doi: 10.3934/mbe.2023293
    [3] Hao Zhou, Xia Wang, Sanyi Tang . Global dynamics of non-smooth Filippov pest-natural enemy system with constant releasing rate. Mathematical Biosciences and Engineering, 2019, 16(6): 7327-7361. doi: 10.3934/mbe.2019366
    [4] Yi Yang, Lirong Liu, Changcheng Xiang, Wenjie Qin . Switching dynamics analysis of forest-pest model describing effects of external periodic disturbance. Mathematical Biosciences and Engineering, 2020, 17(4): 4328-4347. doi: 10.3934/mbe.2020239
    [5] Cunjuan Dong, Changcheng Xiang, Wenjin Qin, Yi Yang . Global dynamics for a Filippov system with media effects. Mathematical Biosciences and Engineering, 2022, 19(3): 2835-2852. doi: 10.3934/mbe.2022130
    [6] A. K. Misra, Jyoti Maurya, Mohammad Sajid . Modeling the effect of time delay in the increment of number of hospital beds to control an infectious disease. Mathematical Biosciences and Engineering, 2022, 19(11): 11628-11656. doi: 10.3934/mbe.2022541
    [7] Dan Shi, Shuo Ma, Qimin Zhang . Sliding mode dynamics and optimal control for HIV model. Mathematical Biosciences and Engineering, 2023, 20(4): 7273-7297. doi: 10.3934/mbe.2023315
    [8] Fang Wang, Juping Zhang, Maoxing Liu . Dynamical analysis of a network-based SIR model with saturated incidence rate and nonlinear recovery rate: an edge-compartmental approach. Mathematical Biosciences and Engineering, 2024, 21(4): 5430-5445. doi: 10.3934/mbe.2024239
    [9] David Moreno-Martos, Sean Foley, Benjamin Parcell, Dumitru Trucu, Raluca Eftimie . A computational investigation of COVID-19 transmission inside hospital wards and associated costs. Mathematical Biosciences and Engineering, 2022, 19(7): 6504-6522. doi: 10.3934/mbe.2022306
    [10] Yun Liu, Yuhong Huo . Predefined-time sliding mode control of chaotic systems based on disturbance observer. Mathematical Biosciences and Engineering, 2024, 21(4): 5032-5046. doi: 10.3934/mbe.2024222
  • A Filippov epidemic model is proposed to explore the impact of capacity and limited resources of public health system on the control of epidemic diseases. The number of infected cases is chosen as an index to represent a threshold policy, that is, the capacity dependent treatment policy is implemented when the case number exceeds a critical level, and constant treatment rate is adopted otherwise. The proposed Filippov model exhibits various local sliding bifurcations, including boundary focus or node bifurcation, boundary saddle bifurcation and boundary saddle-node bifurcation, and global sliding bifurcations, including grazing bifurcation and sliding homoclinic bifurcation to pseudo-saddle. The impact of some key parameters including the threshold level on disease control is examined by numerical analysis. Our results suggest that strengthening the basic medical conditions, i.e. increasing the minimum treatment ratio, or enlarging the input of medical resources, i.e. increasing HBPR (i.e. hospital bed-population ratio) as well as the possibility and level of maximum treatment ratio, can help to contain the case number at a relatively low level when the basic reproduction number R0>1. If R0<1, implementing these strategies can help in eradicating the disease although the disease cannot always be eradicated due to the occurring of backward bifurcation in the system.


    1. Introduction

    Emerging and reemerging infectious disease, for instance, the 2003 severe acute respiratory syndrome (SARS) [27,19], the 2009 H1N1 influenza epidemic [22,38,44], Ebola virus disease in west Africa [42,23] and Zika virus [2] have become major causes of mortality and morbidity in emergencies, where collapsing health service and disease control programmes, poor access to health care, interrupted supplies and logistics are often the cruel reality. Global public health systems of surveillance and response are used to fighting to curb infectious diseases by controlling it at source [30] or slowing down its development course [20,5]. An efficient way to containing a disease during an outbreak is to provide as much as possible medical resources, including sufficient medicine, health care workers, hospital beds and etc. To explore the impact of limited medical resources on the control of infectious diseases and evaluate the possible control strategies, most of the available compartmental models either assume a constant treatment rate or adopt medical resources dependent continuous functions to represent the treatment rates [41,45]. However, change of the level of available medical resources were not well modeled in these models since usually the allocation and change of medical resources do not occur in a continuous way.

    As WHO statistic information system referred, in-patient beds density, as one of the available indicators, can be adopted to access the level of health service delivery [43]. Hence, the number of available hospital beds per 10000 population, termed as hospital bed-population ratio (HBPR), is always used by the public health as an approach of capturing availability of health services delivery. The variations of the level of infected cases between communities and hospitals usually make it difficult for the public health to evaluate and decide the number of hospital beds needed to control the epidemic [1]. Setting sufficient beds to cover peak demands usually leads to quite a lot of beds idle at other times while reducing hospital beds to improving average bed occupancy level results in frequent overflows and congestions within hospital. Hence, quantifying the impact of the number of hospital beds for epidemics control remains a challenge and is therefore an important issue for public health.

    Recently, there have been modeling studies dedicated to exploring the impact of the number of hospital beds on the future containing of disease [35,24,33,43,34]. Some have modeled the impact by embedding a continuous function in terms of the number of hospital beds into the recovery rate [35,34]. In fact, the medical resources used to contain the disease are always limited and the policy to intervene the disease varies depending on the number of infected individuals [32]. In particular, treatment rate depends not only on the available resources of health system to the public but also on the total infected individuals seeking treatment. On one hand, the capacity of the hospital settings, especially the number of health workforce and the facilities of the hospital are vital factors for efficient treatment of infection. On the other hand, the proportion of infected individuals getting access of the medical establishment to cure may change. Therefore, a considerable issue is to model and study the impact of these factors on the control of epidemic disease.

    In this paper, we choose the number of infected cases as an index to propose a threshold policy [37,44,31,28] (of course, we could adopt the size of population who are exposed to the virus or the total number of susceptible and infected individuals). In this case, the control strategy is formulated by using a piecewise smooth function which depends on the density of infected individuals. The purpose of this paper is then to formulate a novel mathematical model subject to the threshold policy to study a Filippov system [21,39,8,4]. In particular, when the number of infected individuals is below the threshold level, the per capita treatment rate will be a constant, representing the maximum per capita treatment rate; while above the level, a weaker treatment policy will be adopted by incorporating the impact of the capacity and limited resources of the health care system in terms of the HBPR and depends on the number of the infected individuals. Filippov systems have been widely investigated [7,11,3,6], especially the sliding mode bifurcations in generic Filippov systems [17,26,18,29] and the numerical methods for them [15,13]. This type of systems have gained considerable attention in recent years since they not only behave differently from smooth systems but also found very important applications in many fields, such as pest control [37], power control in circuit [9], control of ecological systems [14], evolutionary biology [12,10], forest fire [16] and mechanical systems with friction [25], and a few work found in the disease controlling[32,40]. In [32], two parameters are adopted to model the treatment proportion for selective treatment measure due to the limited medical resources while we will model the hospital bed-population ratio by a parameter in this work.

    The main purpose of this paper is to explore the impact of hospital bed-population ratio (i.e. HBPR) on disease control using a Filippov system. Some natural questions to ask include how does the level of infected cases combined with the HBPR affect the existence of the sliding modes, pseudo-equilibrium and sliding bifurcation? Further, how does the threshold policy affect the course of disease transmission and control outcome? To address these questions, we will focus on the sliding mode dynamics as well as the rich sliding bifurcations with variation of the threshold level. The rest of this paper is organized as follows. In Section 2, a piecewise defined treatment programme, which is termed as switching policy in control literature, is proposed to incorporate the level of infected cases and the impact of HBPR into the epidemic model. The sliding mode as well as all possible critical points are examined in Section 3. In Section 4, we study the sliding bifurcation including local sliding bifurcation and global sliding bifurcation. In Section 5, we investigate the impact of some key parameters on the evolution of the epidemic disease. Some concluding remarks and biological interpretations will be presented in the last section.


    2. SIS Filippov model with switching treatment programme

    As mentioned in the introduction, the medical resources can not always meet the increasing treatment demand of the infecteds. As WHO referred, we adopt the hospital bed-population ratio (i.e. HBPR and denoted by b) to evaluate the amount of medical resources in the following. Due to the limited medical resources, the treatment policy may vary as the amount of infecteds varies, so it is appropriate to set the number of infected individuals as the index. It is reasonable to assume that when the amount of infecteds is below a certain threshold level (denoted by Ic), the maximum per capita treatment rate (denoted by h1) is in effect due to the relatively sufficient medical resources. As the number of infected individuals becomes larger and larger and once it exceeds Ic, only a certain ratio of infectious people can get treatment due to the insufficiency of the available medical resource. Note that the available treatment ratio may depend on the HBPR and the number of infected individuals. In particular, the treatment ratio decreases to h0 as the amount of infecteds increases on one hand. On the other hand, the treatment ratio increases as HBPR increases. Thus we adopt a saturated function to represent the treatment policy, i.e. H1(b,I)=h0+(h1h0)b/(b+I) for this scenario. It is clear that H1(b,I) is bounded by the maximum per capita treatment rate h1 and minimum per capita treatment rate h0.

    We divide the population into two classes: susceptible (S) and infected (I) individuals and formulate an SIS epidemic model by considering the effect of disease-induced mortality, which is important and appropriate for some epidemic diseases, such as tuberculosis, AIDS and plague. Then the model takes the following form

    {dSdt=ΛμSβSIS+I+H(I,ϵ)I,dIdt=βSIS+IμIνIH(I,ϵ)I (1)

    with

    H(I,ϵ)=ϵH1(b,I)+(1ϵ)h1 (2)

    and

    ϵ={0,σ(S,I,Ic)<0,1,σ(S,I,Ic)>0, (3)

    where Λ represents the recruitment rate, μ is the natural death rate, β denotes the basic transmission rate, ν stands for disease-induced mortality rate, the function H(I,ϵ) represents the per capita treatment rate. σ(S,I,Ic) is a given function which may depend on the number of susceptible individuals, infected individuals and the threshold value Ic. But here we choose a particular form for function σ(S,I,Ic), i.e. σ(S,I,Ic)=σ(I,Ic)=IIc, which indicates the amount of infected individuals is the index to guide which treatment policy works for different cases. Further, H1(b,I) is increasing as a function of the parameter b, where b represents the HBPR and is used to characterize the impact of the capacity as well as the limited hospital resources. A detailed examination of the property on the treatment rate H1(b,I) can be found in [35].

    In particular, the function H(I,ϵ) can be rewritten as the following form

    H(I,ϵ)={h1,I<Ic,h0+(h1h0)bb+I,I>Ic.

    Model system (1) with (2) and (3) is a piecewise smooth dynamical system (PWS)[3]. In particular, it subjects to a threshold value and is indeed a so-called Filippov system [21], i.e. systems of ordinary differential equations (ODES) with non-smooth right-hand sides.

    Denote Z=(S,I) and

    X1(S,I)=(ΛμSβSIS+I+h1I,βSIS+IμIνIh1I)T˙=(f11(S,I),f12(S,I))T,X2(S,I)=(ΛμSβSIS+I+[h0+(h1h0)bb+I]I,βSIS+IμIνI[h0+(h1h0)bb+I]I)T˙=(f21(S,I),f22(S,I))T,

    then system (1) with (2) and (3) can be written as the following Filippov system

    dZdt={X1(S,I),σ(I,Ic)<0X2(S,I),σ(I,Ic)>0. (4)

    The attraction region of system (4) is Ω={(S,I)R2+:S+IΛ/μ}. For system (4), σ=0 defines the switching manifold

    Σ={(S,I):I=Ic,(S,I)R2+},

    which splits R2+ into two parts:

    G1(S,I)={(S,I):I<Ic,(S,I)R2+},G2(S,I)={(S,I):I>Ic,(S,I)R2+}.

    For convenience, system (4) restricted in region Gi is denoted as system SGi,i=1,2. Different from the smooth counterparts, system (4) possesses more than one equilibria [29,26], which play an important role in determining complex dynamics of the system.

    Definition 2.1. Regular equilibrium of system (4) refers to those equilibria located in the region Gi(i=1,2), which consists of real equilibrium and virtual equilibrium.

    A real equilibrium Z of Filippov system (4) (denoted by Zr) refers to one which is an equilibrium of subsystem SGi(i=1,2) and locates in the corresponding region Gi, i.e., it satisfies

    X1(Z)=0, σ(Z)<0

    or

    X2(Z)=0, σ(Z)>0.

    A virtual equilibrium Z of Filippov system (4) (denoted by Zv) refers to one which is an equilibrium of subsystem SGi(i=1,2) but locates in the opposite region Gj(j=1,2 and ji), i.e., it satisfies

    X1(Z)=0, σ(Z)>0

    or

    X2(Z)=0, σ(Z)<0.

    Definition 2.2. A boundary equilibrium Z of Filippov system (4) refers to one which is an equilibrium of subsystem SGi(i=1,2) but locates on the discontinuity boundary Σ, i.e. it satisfies

    X1(Z)=0, σ(Z)=0

    or

    X2(Z)=0, σ(Z)=0.

    Definition 2.3. A tangency point Z of system (4) refers to a point ZΣ (i.e. σ(Z)=0) and X1σ(Z)=0 or X2σ(Z)=0, where Xiσ(Z)(i=1,2) stands for the Lie derivative of σ with respect of the vector field Xi at the point Z, i.e.

    Xiσ(Z)=σ(Z),Xi(Z).

    We examine the dynamics of the subsystems SG1 and SG2 separately in the following.

    Dynamics of subsystem SG1. Let ri=μ+ν+hi(i=1,2). The Jacobian of system SG1 reads

    J1(S,I)=(μβI2(S+I)2βS2(S+I)2+h1βI2(S+I)2βS2(S+I)2r1).

    If we denote

    δ1=(tr(J1(S1,I1)))24det(J1(S1,I1))

    and the dynamics of system SG1 can be summarized in the following theorem.

    Theorem 2.4. There is a disease-free equilibrium E0=(Λ/μ,0) for system SG1, which is a stable node for R0<1 and a saddle for R0>1 with R0=β/r1. The endemic equilibrium E1=(S1,I1) exists if R0>1 with

    S1=r1I1βr1, I1=(βr1)Λμr1+(μ+ν)(βr1),

    which is a stable node for δ10 and a stable focus for δ1<0. No endemic equilibrium exists for R0=1.

    Dynamics of subsystem SG2. Denote

    a0=βμ+ν(βr0),a1=bβ(μ+ν)+Λ(r0β)bνr1, a2=bΛ(r1β)

    and

    C0=[βb(μ+ν)Λ(r0β)bνr1]2+4βμbΛ(h0h1).

    One can verify that there are two possible endemic equilibria of system SG2 if C0>0 and a0>0, denoted by Ei=(Si,Ii),i=2,3, with

    Si=Λ(μ+ν)Iiμ, I2=a1+C02a0, I3=a1C02a0.

    Only one endemic equilibrium E=(S,I) or E4=(S4,I4) exists if C0=0 or a0=0, where

    S=Λ(μ+ν)Iμ,I=a12a0,S4=Λ(μ+ν)I4μ,I4=bΛ(βr1)bν(r0r1)+Λ(r0β).

    We address the existence of equilibria for system SG2 in detail according to whether the basic reproduction number R0 is greater than unity and summarize the result as follows.

    Theorem 2.5. The disease-free equilibrium E0 always exists for system SG2 while the existence of possible endemic states is given in Table 1 .

    Table 1. Existence of endemic equilibria for system SG2.
    Range of parameter values Existence of endemic equilibria
    R0>1 a1+C02a0<Λμ+ν E2
    R0<1 a0>0,a1<0,C0>0,a1+C02a0<Λμ+ν E2,E3
    a0>0,a1<0,C0=0,a12a0<Λμ+ν E
    a0=0,a1<0,a2a1<Λμ+ν E4
    C0<0 Nonexistence
    a0>0,a1>0,C00 Nonexistence
    a0=0,a10 Nonexistence
    R0=1 R1>1,a12a0<Λμ+ν E2
    R11 Nonexistence
     | Show Table
    DownLoad: CSV

    The disease-free equilibrium E0 is a node for R0<1 and it is a saddle for R0>1. To determine the type of the endemic equilibria, we initially compute the Jacobian of system SG2 as follows

    J2(S,I)=(μβI2(S+I)2βS2(S+I)2+(h1h0)b2(b+I)2+h0βI2(S+I)2βS2(S+I)2(h1h0)b2(b+I)2r0).

    For any endemic equilibrium ¯E=(¯S,¯I), we denote

    tr(J2(¯S,¯I))=(β+r0μ)¯I2+2b(r1βμ)¯I+(μβ+r1)b2(b+¯I)2,det(J2(¯S,¯I))=μ{[(βr0)Λ+νb(r1r0)]¯I2+2Λb(βr1)¯I+Λb2(βr1)}(Λν¯I)(b+¯I)2.

    One can get that the unique endemic equilibrium E2 is a stable focus or node if R0>1.

    For the coexistence of E2 and E3, note that det(J2(S,I))=0 and

    sgn(det(J2(¯S,¯I)))=sgn(A¯I2+2Λb(βr1)¯I+Λ(βr1)b2)

    with

    A=((βr0)Λ+νb(βr0)νb(βr1))>0,

    then

    det(J2(S2,I2))>0, det(J2(S3,I3))<0.

    This indicates that E3 is a saddle while E2 and E are anti-saddles. Further discussion yields

    tr(J2(S2,I2))=(ν+h0β)I22+2b(ν+h1β)I2+(ν+h1β)b2(b+I2)2.

    It follows that

    sgn(tr(J2(S2,I2)))=sgn((ν+h0β)I22+2b(ν+h1β)I2+(ν+h1β)b2)=sgn{[a1(2a0bp1a1p0)+2a0(a2p0a0b2p1)](2a0bp1a1p0)C0},

    where p0=βνh0,p1=βνh1. Denote

    B=a1(2a0bp1a1p0)+2a0(a2p0a0b2p1)

    and

    δ2=[tr(J2(S2,I2))]24det(J2(S2,I2)).

    Then one can verify that E2 is a node for δ20 while it is a focus for δ2<0. The further conclusion is as following:

    (ⅰ) E2 is stable if one of the following conditions holds

    βν+h1;

    ν+h0<β<ν+h1,p1p0>a12a0b,(2a0bp1a1p0)2C0>B2.

    (ⅱ)E2 is unstable if p1/p0a1/(2a0b),(2a0bp1a1p0)2C0B2 and both of the above conditions do not hold.

    For the existence of endemic equilibrium E4, it follows from

    det(J2(S4,I4))=μ(βr1)C(bν+Λ)2(βr0)2(h1h0)>0,tr(J2(S4,I4))=(βr0μ)[bν(h0h1)+Λ(r0β)]2(h1h0)(Λ+bν)2<0,

    where

    C=μνβb2(h1h0)2+2bμβΛ(r0β)(h1h0)Λ2(r0β)3,

    we conclude that E4 is a stable node or stable focus.

    Theorem 2.6. (i) If R0>1, the endemic equilibrium E2 is a stable node or focus for subsystem SG2.

    ()If there are two endemic equilibria E2 and E3, then E3 is a saddle while E2 is an anti-saddle.

    () If only one endemic equilibrium E exists for the system, it appears as a stable node or stable focus.

    By implementing similar discussion as in [35], we obtain the rich dynamics of system SG2 as the parameters vary. Here we omit the details and summarize the main result as follows.

    Theorem 2.7. (i) If there are two endemic equilibria E2 and E3 for system SG2, Hopf bifurcation occurs at E2 if

    ν+h0<β<ν+h1,p1p0>a12a0b,(2a0bp1a1p0)2C0=B2.

    () Bogdanov-Takens bifurcation occurs if R0<1,a0>0,a1<0,C0=0,a1/(2a0)<Λ/(μ+ν) and

    ν+h0<β<ν+h1,p1p0>a12a0b,(2a0bp1a1p0)2C0=B2.

    3. Sliding mode and equilibria

    To establish the dynamics given by the Filippov system (4), the first step is to rigorously define the local trajectory through a point ZR2+, especially those trajectories initiating from ZΣ and it becomes the focus of this section. Those local trajectories initiating from the subregions G1 and G2 are defined by the subsystems SG1 and SG2 as usual. To extend the definition of a trajectory to the discontinuous boundary Σ, it is necessary to split Σ into three distinct parts depending on whether the vector field points towards it [21,25].

    Attracting sliding mode Σs, where the vector fields points toward Σs in both G1 and G2.

    Repulsing sliding mode Σe, where the vector fields points away from Σe in either of G1 and G2.

    Transversal sliding mode Σc, where the vector fields points toward Σc in G1(G2) and away from Σc in G2(G1).

    Existence of sliding mode. Indeed, no attracting sliding mode region exists for Filippov system (4) due to the mechanisms of our model. Solving Xiσ(I,Ic)=0 (i=1,2) yields

    Sc1=(μ+ν+h1)Icβ(μ+ν+h1), Sc2=[(b+Ic)(μ+ν+h0)+b(h1h0)]Ic(b+Ic)(β(μ+ν+h0))b(h1h0).

    The repulsing sliding mode region takes the form

    Σe={(S,Ic):Sc2SSc1}˙=Σe1

    for R0>1 and

    Σe={(S,Ic):SSc2}˙=Σe2

    for R0<1,β>r0 and Ic>Ic0, where Ic0=b(r1β)/(βr0). For R0=1, the sliding mode region is also Σe2. On the sliding mode region Σe1 or Σe2, it follows from Filippov's convex method [21,39] that the sliding mode dynamics reads

    dSdt=μ[SΛ(μ+ν)Icμ]˙=Fs(S,Ic). (5)

    Equation (5) defines a one dimensional dynamical system on Σe1 or Σe2.

    We will define the type of equilibrium on the repulsing sliding mode Σe [29], which is special for Filippov system and plays an important role in the analysis of global behavior.

    Definition 3.1. A point ZΣe is called a pseudo-equilibrium of Filippov system (4) if it satisfies Fs(Z)=0, which suggests a pseudo-equilibrium is indeed an equilibrium of the sliding mode dynamics. We call pseudo-saddle to any pseudo-equilibrium ZΣe such that Fs(Z)<0.

    The following definition gives a more detailed characterization of a tangency point.

    Definition 3.2. A point ZΣ is termed as a fold tangency point if one of the following conditions hold.

    (a) X1σ(Z)=0,X21σ(Z)0,X2σ(Z)0.

    (b) X2σ(Z)=0,X22σ(Z)0,X1σ(Z)0.

    Furthermore, if X2σ(Z)>0 in possibility (a) or X1σ(Z)<0 in possibility (b), then ZΣe and it appears as a repulsing sliding fold tangency.

    For case (a), we call a fold tangency point visible (invisible) if the trajectories of subsystem SG1 initiating from Z remains in region G1(G2) for any sufficiently small period. It follows that a fold tangency point is visible (invisible) if we further have X21σ(Z)<0(X21σ(Z)>0) in possibility (a). Similar definitions hold for case (b).

    An equilibrium Ss=(Λ(μ+ν)Ic)/μ exists for the sliding mode dynamics (5), which suggests a possible pseudo-equilibrium Es=(Ss,Ic) exists for system (4) by Definition 3.1. The feasibility of pseudo-equilibrium for system (4) in different cases depends on whether Es lies in the domain of repulsing sliding mode region Σe1 or Σe2.

    Note that

    SsSc1=(I1Ic)[βμ+ν(βr1)]μ(βr1),

    we have

    SsSc1IcI1

    for R0>1. It follows from

    SsSc2=[βμ+ν(βr0)]I2c+[bβ(μ+ν)Λ(βr0)bνr1]IcbΛ(r1β)μ(βr0)(IcIc0)

    that SsSc2 provided one of the following set of inequalities satisfies.

    R0>1,IcI2;

    R0<1,β>r0,Ic>Ic0,I3IcI2;

    R0=1,Ic<Ic0.

    Then we conclude that the pseudo-equilibrium Es is feasible if one of the following conditions holds.

    (a) R0>1,I1IcI2;

    (b) R0<1,β>r0,Ic>Ic0,I3IcI2;

    (c) R0=1,Ic<Ic0.

    Equilibria. We address all possible critical points for system (4) as follows.

    Regular Equilibrium. In terms of Definition 2.1, the disease-free equilibrium E0 is real and independent of the size of threshold level Ic; the endemic equilibrium E1 is real provided Ic>I1 while it is virtual provided Ic<I1; the endemic equilibrium Ei(E) is real for Ic<Ii(Ic<I) while Ei(E) is virtual for Ic>Ii(Ic>I), i=2,3,4.

    Boundary Equilibrium. There are up to five equilibria of Filippov system (4) colliding with the switching boundary Σ at distinct moments, so five possible boundary equilibria exist according to Definition 2.2, i.e.

    Eb1=(r1Icβr1,Ic1), Ebi=(Λ(μ+ν)Icμ,Ici),i=2,3,4,5

    if Ic=Ici,Ici=Ii for Ebi with i=1,2,3,4 and Ic=Ic5,Ic5=I for Eb5.

    Pseudo-equilibrium. Only a pseudo-equilibrium Es is feasible if one of the following conditions satisfies.

    (a) R0>1,I1IcI2;

    (b) R0<1,β>r0,Ic>Ic0,I3IcI2;

    (c) R0=1,Ic<Ic0.

    Furthermore, the pseudo-equilibrium Es is a pseudo-saddle if it is defined well on the sliding mode region Σe1 or Σe2.

    Tangency point. By Definition 2.3, two tangency points coexist for system (4) if R0>1, represented by

    Et1=(Sc1,Ic),Et2=(Sc2,Ic),

    and there is one tangency point Et2 if R0<1,β>r0,Ic>Ic0 or R0=1.

    According to Definition 3.2, fold tangency points can be classified as visible and invisible ones, so we examine the type of tangency points Eti(i=1,2) as follows.

    For Et1, it follows from

    {sgn(X2σ(Et1))=sgn(βSc1Sc1+Icb(h1h0)b+Icr0)=1,X21σ(Et1)=βI2c(Sc1+Ic)2f11(Sc1,Ic)+[βS2c1(Sc1+Ic)2r1]f12(Sc1,Ic),

    that

    sgn(X21σ(Et1))=sgn(Λ(βr1)μr1Ic(μ+ν)(βr1)Icβr1),

    so if Ic<I1, one gets X21σ(Et1)>0 and then Et1 is invisible in such case; if Ic>I1, one has X21σ(Et1)<0 and then Et1 is visible. Furthermore, since X2σ(Et1)>0, the fold tangency point Et1 is a repulsing fold tangency.

    For the tangency point Et2, similar argument gives

    {sgn(X1σ(Et2))=sgn((βr1)Sc2r1Ic)=1,X22σ(Et2)=βI2c(Sc2+Ic)2f21(Sc2,Ic)+[βS2c2(Sc2+Ic)2(h1h0)b2(b+Ic)2(μ+ν+h0)]f22(Sc2,Ic),

    so

    sgn(X22σ(Et2))=sgn{[μβ+ν(βr0)]I2c+[Λ(βr0)b(βμ+βνr1ν)]Ic+Λb(βr1)(βr0)Ic+b(βr1)}. (6)

    There are two possibilities according to whether R0 is greater or less than unity. If R0>1, one gets that Et2 is visible for Ic<I2 and invisible for Ic>I2. If R0<1, since the sliding mode region exists for β>r0 and Ic>Ic0, we focus our examination on such case and there are the following three subcases to consider in terms of the existence of endemic equilibrium for system SG2. For the coexistence of two endemic equilibria E2 and E3, one gets

    I3<Ic<I2X22σ(Et2)>0

    according to (6), so Et2 is visible; while we get X22σ(Et2)<0 if Ic>I2 or Ic<I3, so Et2 is invisible. (ⅱ) For the existence of endemic equilibrium E, if IcI, we have X22σ(Et2)<0, so Et2 is invisible. (ⅲ) For the nonexistence of endemic equilibrium, we derive X22σ(Et2)<0, so Et2 is invisible. Moreover, it follows from X1σ(Et2)<0 that the fold tangency point Et2 is a repulsing fold independent of the level of threshold Ic.

    Once we have examined the sliding dynamics as well as all possible critical points for system (4), we turn to discuss the discontinuity-induced bifurcation in the following section, which is special for Filippov system and refer to a type of bifurcations involving structural changes in the sliding mode domain.


    4. Sliding bifurcation

    In this section, we focus our attention on sliding bifurcation, in which some sliding segment on the switching boundary is involved. According to [29,17], all sliding bifurcations can be classified as local and global bifurcations. The local sliding bifurcations include boundary equilibrium bifurcation and double tangency bifurcation. Those sliding bifurcations are called global if they involve nonvanishing cycles. Global bifurcations include grazing (touching) bifurcation, sliding homoclinic bifurcation to pseudo-saddle, or pseudo-saddle-node or saddle, and the sliding heteroclinic bifurcation between pseudo-saddles, etc. In the following, we choose the threshold value Ic as a bifurcation parameter and fix all other parameters unchanged.


    4.1. Local sliding bifurcation

    We initially examine the local sliding bifurcation for system (4), which include boundary equilibrium bifurcation and double tangency bifurcation. There are four distinguished boundary equilibrium bifurcations, i.e. boundary node (BN), boundary focus (BF), boundary saddle (BS) and boundary saddle-node bifurcation (BSN) [29,26]. Further, if the boundary equilibrium bifurcation involves changes of the real/virtual character, it is also termed as real/virtual equilibrium bifurcation. Double tangency bifurcation is a type of bifurcations triggered by the collision of two tangency points. Since the tangency points Et1 and Et2 are distinct and impossible to collide for Ic>0, no double tangency bifurcation will occur. Thus, in the following we are devoted to the boundary equilibrium bifurcation, which is induced by the collision of a hyperbolic equilibrium with the discontinuity boundary Σ. For such purpose, we introduce the following definition [17].

    Definition 4.1. A boundary equilibrium bifurcation occurs at a critical point ZΣ if X1(Z)=0 (or X2(Z)=0) and DXi(Z) is invertible (i.e. det(DXi(Z))0) for i=1,2.

    When a boundary equilibrium bifurcation occurs, we can observe two cases. One is persistence, where a real equilibrium becomes a pseudo-equilibrium; the other is non-smooth fold, where a real equilibrium disappears after colliding together with a pseudo-equilibrium. Implementing a similar discussion as in [17], one gets the conditions to distinguish between the two possible types of unfolding of a boundary equilibrium as the parameter Ic is perturbed from the critical value. Without loss of generality, we take the boundary equilibrium Eb1 as an example and state the conditions as following.

    Definition 4.2. For system (4), if

    det(J1(Sic1,Ic1))0σ(Ic1,Ic)IcJ3(Sic1,Ic1)J11(Sic1,Ic1)J4(Sic1,Ic1)0J3(Sic1,Ic1)J11(Sic1,Ic1)(X2(Sic1,Ic1)X1(Sic1,Ic1))0,

    a non-smooth fold is observed for

    J3(Sic1,Ic1)J11(Sic1,Ic1)(X2(Sic1,Ic1)X1(Sic1,Ic1))<0

    while persistence is derived at the boundary equilibrium bifurcation point for

    J3(Sic1,Ic1)J11(Sic1,Ic1)(X2(Sic1,Ic1)X1(Sic1,Ic1))>0,

    where J3(S,I) stands for the Jacobian of σ(I,Ic) with respect to the the state variable (S,I), J4(S,I) represents the Jacobian of X1 with respect of the parameter Ic, Sic1 denotes the abscissa of the boundary equilibrium Eb1.

    The similar condition can be presented for other boundary equilibria and we omit them here.

    For the case that only one endemic equilibrium E2 exists for system SG2, there are two boundary equilibria Eb1 and Eb2 for Filippov system (4). According to section 2, det(J2(Eb2))>0 for R0>1. Further calculation yields

    det(J1(Eb1))=μr1I1S1+I1+(μ+ν)βI21(S1+I1)2,det(J1(Eb2))=β(μ+ν)I22(S2+I2)2+μ[βS2I2S2+I2+(h1h0)I2b+I2],det(J2(Eb1))=[ν(r1+β)2+βμ(βr1)][(βr1)(Λ+bν)+bβμ]2Cβ[(βr1)(Λ+bν)+bβμ]2

    with

    C=βμ(r1r0)[(βr1)2(Λ2+2bνΛ)+2bβμΛ(βr1)],

    so a boundary focus (or node) bifurcation occurs for R0>1 when Ic passes through the critical value Ic2. If detJ2(Eb1)0, a boundary focus (node) bifurcation happens for R0>1 when Ic passes through another critical value Ic1. Indeed, a boundary equilibrium bifurcation is triggered by the collision of the regular equilibrium, pseudo-equilibrium and tangency point (or two of them) as the threshold value Ic passes through the critical level.

    For boundary equilibrium Eb1, the first three conditions in Definition 4.2 hold, so according to Definition 4.2, the type of unfolding depends on the sign of the following formula

    sgn(J3(Sic1,Ic1)J11(Sic1,Ic1)(X2(Sic1,Ic1)X1(Sic1,Ic1)))=sgn{(h1h0)Ic1b+Ic1[h1μβI2c1(Sic1+Ic1)2βS2ic1(Sic1+Ic1)2]}=sgn{(h1μβ)r21+2(h1μ)r1(βr1)+(h1μβ)(βr1)2(βr1)2}=sgn(2r21+β(r1+ν+2h1β)).

    Thus, a non-smooth fold occurs if

    2r21+β(r1+ν+2h1β)>0, (7)

    while persistence is derived if

    2r21+β(r1+ν+2h1β)<0. (8)

    Implementing the similar process for boundary equilibrium Eb2, we derive that the type of unfolding of Eb2 is determined by

    sgn(J3(Sic2,Ic2)J12(Sic2,Ic2)(X1(Sic2,Ic2)X2(Sic2,Ic2)))=sgn{(h1h0)Ic2b+Ic2[h0+μ(h1h0)b2(b+Ic2)2+βI2c2(Sic2+Ic2)2+βS2ic2(Sic2+Ic2)2]}=sgn{(μh0)b2(h1h0)(b+Ic2)2+β[Λ(μ+ν)Ic2]2+βμ2I2c2(ΛνIc2)2}=sgn{(ΛνIc2)2[(h0+β+μ)(b+Ic2)2b2(h1h0)]2μβIc2(b+Ic2)2[Λ(μ+ν)Ic2]},

    where Sic2 is the abscissa of boundary equilibrium Eb2. It follows that the persistence happens for β+μh0 and

    2β(b+Ic2)2b2(h1h0)(b+Ic2)2(β+μh0)<(ΛνIc2)2μIc2[Λ(μ+ν)Ic2] (9)

    while a non-smooth fold appears for β+μh0 and

    2β(b+Ic2)2b2(h1h0)(b+Ic2)2(β+μh0)>(ΛνIc2)2μIc2[Λ(μ+ν)Ic2]. (10)

    If we choose the parameters as Λ=8,μ=0.1,β=1.8,h0=0.2,h1=0.8,b=5,ν=0.6,Ic=8.2934(a),Ic=6.6667(b),Ic=9.2934(c),Ic=9.7934(d) and keep Ic as a bifurcation parameter, Fig. 1 shows the boundary node bifurcation occurs when the threshold parameter Ic passes through the critical value Ic1 or Ic2, where Ic1=6.6667,Ic2=9.2934,det(J2(Eb1))=0.011. In Fig. 1, the red solid circle points (i.e. Er1,Er2) stand for the real endemic equilibria while the red hollow ones (i.e. Ev2) denote the virtual equilibria. The hollow square dots (i.e. E0) represent the unstable disease-free equilibria and the solid diamond dot (i.e. Es) denote the pseudo-equilibria. The stable (unstable) manifolds of the pseudo-saddle Es are depicted by blue (green) lines. The grey thick solid lines are used to show the repulsing sliding mode region while the grey thin dashed lines are to represent the transversal sliding mode region. All the black solid lines stand for the trajectories of system (4). In the rest of this work, unless otherwise stated, we always use these notations.

    Figure 1. Boundary node bifurcation for Filippov system (4).

    The pseudo-saddle Es, stable node Er1 and visible tangency point Et1 coexist for Ic>Ic1 and Ic=8.2934 as shown in Fig. 1(a). They collide together simultaneously when Ic decreases and reaches the critical value Ic1, denoted by Eb1, as shown in Fig. 1(b). In this case, Eb1 is a pseudo-saddle with an incoming sliding orbit. Further, since (7) holds ture, a non-smooth fold occurs, which indicates the real equilibrium Er1 disappears after it collides with the pseudo-equilibrium Es. However, as Ic increases and reaches the critical value Ic2, another boundary node bifurcation occurs, which is due to the collision of real endemic equilibrium Er2, the visible tangency point Et2 and the pseudo-equilibrium Es, denoted by Eb2, as shown in Fig. 1(c). In such scenario, Eb2 is also a pseudo-saddle with an incoming sliding orbit. It is worth noting that (10) is satisfied, which implies the occurrence of non-smooth fold in this process. In fact, as Ic increases further, the pseudo-saddle Eb2 is superseded by an invisible tangency point Et2 and a virtual equilibrium Ev2 for Ic>Ic2 and Ic=9.7934 as shown in Fig. 1(d). This shows how a catastrophic disappearance of a stable equilibrium occurs.

    Note that the endemic equilibrium E3 is a saddle provided it is feasible, so a boundary saddle bifurcation may occur once E3 collides with the tangency point at the critical parameter value Ic=Ic3 as shown in Fig. 2. The type of unfolding of the boundary equilibrium Eb3 is determined by

    sgn(J3(Sc3,Ic3)J12(Sc3,Ic3)(X1(Sc3,Ic3)X2(Sc3,Ic3)))=sgn{(ΛνIc3)2[(h0βμ)(b+Ic3)2+b2(h1h0)]+2μβIc3(b+Ic3)2[Λ(μ+ν)Ic3]},
    Figure 2. Boundary saddle bifurcation for Filippov system (4). Here we choose Ic as a bifurcation parameter and fix all other parameters as follows: Λ=5,μ=0.08,β=1.4,h0=0.3,h1=0.7,b=3,ν=0.7,Ic=2(a),Ic=1.1463(b),Ic=1(c).

    where Sc3 represents the abscissa of Eb3. Then a non-smooth fold is observed if (9) is true and persistence is derived if (10) holds. In this scenario, (10) is true and so persistence occurs. In Fig. 2(a), the virtual equilibrium Ev3, stable focus Er2, visible tangency point Et2, pseudo-saddle Es and the disease-free equilibrium E0 coexist for Ic>Ic3 with Ic3=1.1463 and Ic=2. As Ic decreases and passes through the critical value Ic3, the virtual equilibrium Ev3, visible tangency point Et2 and pseudo-saddle Es collide together simultaneously, denoted by Eb3, which results in a boundary saddle bifurcation as shown in Fig. 2(b). As Ic further decreases and Ic<Ic3, the boundary saddle Eb3 is replaced by the visible tangency point Et2 and the standard saddle Er3, as shown in Fig. 2(c) with Ic=1. It is worth mentioning that different monotonicity levels of Ic yield different phenomena if we take Ic as a variable. In fact, if Ic is decreasing, we get the following variation order, i.e. Fig. 2(a)(b)(c), which shows how a pseudo-saddle becomes a standard saddle. If Ic is increasing, we get the change order Fig. 2(c)(b)(a), which indicates the real equilibrium Er3 turns into the pseudo-equilibrium Es in this case.

    It follows from Theorem 2.2 that a unique endemic equilibrium E exists for system SG2 if R0<1,a0>0,a1<0,C0=0. In fact, E is a saddle node point of system SG2 and is actually the result of the collision of two endemic equilibria E2 and E3. A boundary saddle node bifurcation occurs when E collides with the repulsing sliding mode region Σe2, according to [26], as shown in Fig. 3(b) with Ic=Ic5 and Ic5=2.5661. Saddle node point Er and invisible tangency point Et2 coexist for Ic<Ic5, as shown in Fig. 3(a). The saddle node point Er collides with the invisible tangency point Et2, which results in occurrence of the boundary saddle node point Eb2 with a sliding stable manifold as shown in Fig. 3(b). If Ic>Ic5, Eb2 is replaced by invisible tangency point Et2 and virtual equilibrium Ev, as shown in Fig. 3(c).

    Figure 3. Boundary saddle node bifurcation for Filippov system (4). Here we choose Ic as a bifurcation parameter and fix all other parameters as follows: Λ=6,μ=0.1,β=1.4,h0=0.3,h1=0.7834,ν=0.6,Ic=2(a),Ic=2.5661(b),Ic=3(c).

    For other cases with the existence of endemic equilibrium E2, E4 or E, boundary node (or focus) bifurcation occurs once the threshold parameter Ic passes through the critical value Ic2,Ic4 or Ic5 as shown in Fig. 4 (g)-(h).

    Figure 4. Local and global sliding bifurcations for Filippov system (4). We select Ic as a bifurcation parameter and fix all other parameters as follows: Λ=8,μ=0.1,β=1.8,h0=0.2,h1=2,b=3.28,ν=0.6,Ic=4(a),Ic=4.7844(b),Ic=4.95(c),Ic=5.03(d),Ic=5.2(e),Ic=6.009782(f),Ic=6.3(g),Ic=6.8556(h). Here the black thick solid line represents a periodic cycle while the blue thick solid line stands for the homoclinic cycle.

    4.2. Global sliding bifurcation

    Now we turn to examine the bifurcations of limit cycles of (4). Basically, there are three types of limit cycles for Filippov system (4) [29], i.e. standard periodic cycles, sliding periodic cycles and crossing periodic cycles. Standard periodic solutions refer to the cycles lying entirely in region G1 or G2; sliding periodic cycles are those cycles having a sliding segment in Σe; crossing periodic cycles represent the periodic solutions having only isolated points in common with Σe. In what follows we address grazing bifurcation and pseudo-homoclinic bifurcations for system (4) by choosing the threshold level Ic as bifurcation parameter and specifying other parameters as shown in Fig. 4.

    Grazing bifurcation. The bifurcation that occurs once the standard piece of a periodic cycle touches the switching boundary Σ is said to be grazing bifurcation (or touching bifurcation) [29]. It follows from Fig. 4(c) that an unstable standard cycle exists in region G2 with Ic=4.95.In such scenario, there are five critical points, i.e. the real endemic equilibrium Er2, virtual endemic equilibrium Ev3, stable disease-free equilibrium Er0, pseudo-equilibrium Es and visible tangency point Et2, two stable manifolds of the pseudo-saddle Es, denoted by the blue solid lines, and two unstable manifolds of it, denoted by the green solid lines. As the parameter Ic increases and reaches the value Ic=5.03, grazing bifurcation occurs as shown in Fig. 4(d), where the closed orbit is tangent to the repulsing sliding mode region Σe2 at the tangency point Et2, which is a so-called crossing cycle. As Ic further increases, the crossing cycle becomes a sliding cycle, which contains a piece of sliding segment, as shown in Fig. 4(e) with Ic=5.2.

    It is worth noting that local sliding bifurcation happens at the critical threshold value Ic3, i.e. real/virtual equilibrium bifurcation or boundary saddle bifurcation, before the occurrence of grazing bifurcation, as shown in Fig. 4(a)-(c) with Ic3=4.7844. A real endemic equilibrium Er3 and invisible fold tangency point Et2 coexist as shown in Fig. 4(a) with Ic<Ic3 and Ic=4, where Er3 is a saddle. With the increasing of Ic and Ic=Ic3, the saddle point Er3 collides with tangency point Et2 and becomes boundary saddle Eb3, which results in boundary saddle bifurcation, where Eb3 possesses a stable sliding manifold as shown in Fig. 4(b). If we further increase Ic, the boundary saddle disappears and is replaced by the tangency point Et2, pseudo-saddle Es and virtual equilibrium Ev3. This process shows how a real equilibrium becomes a virtual equilibrium.

    Bifurcation of a sliding homoclinic orbit to pseudo-saddle. If a pseudo-equilibrium of system (4) is a pseudo-saddle, it can have a sliding trajectory which initiates and returns back to it at certain threshold parameter values. This is indeed the so-called sliding homoclinic orbit. If a sliding cycle collides with such a pseudo-saddle, a sliding homoclinic bifurcation occurs as shown in Fig. 4(e)-(g). It follows from Fig. 4(e) that a sliding cycle, two pieces of stable manifolds and unstable manifolds of the pseudo-saddle Es coexist with Ic=5.2. As Ic increases and reaches about 6.009782, the trajectory departing from the tangency point Et2 becomes the stable manifold of the pseudo-saddle and the sliding cycle collides with the pseudo-saddle Es as shown in Fig. 4(f), where the sliding cycle is replaced by a sliding homoclinic orbit. As Ic further increases, the sliding homoclinic orbit breaks and no periodic orbit exists as shown in Fig. 4(g). If Ic continues to increase and passes through Ic2 with Ic2=6.8556, a local sliding bifurcation (i.e. boundary node bifurcation) occurs as shown in Fig. 4(h).

    It follows from Fig. 4 that as the threshold level increases from 4 to 6.8556, Filippov system (4) exhibits the interesting local and global sliding bifurcations sequentially, i.e. boundary saddle bifurcation grazing bifurcation sliding homoclinic bifurcation boundary node bifurcation. This illustrates a series of rich dynamics and suggests that the control outcomes may be sensitive to the threshold value.


    5. Impact of interventions of Filippov system (4)

    One of our purposes in this study is to seek better strategies for curbing the spread of diseases, and to examine when and how to implement the control measure to contain the number of infected individuals to be less than some acceptable level if it is almost impossible to eradicate an infectious disease. An efficient way is to reduce the level of infected cases in steady state as small as possible. To realize this goal, we will examine the impact of parameters associated with interventions on the dynamics, especially the equilibrium level of infected individuals of Filippov system (4) in this section. Due to the biological significance of each parameter and their effect on disease control, we focus only on the impact of threshold parameter Ic, HBPR parameter b, maximum and minimum per capita treatment rate h1 and h0 in this section.

    Impact of threshold level Ic. We start from the effect of the variation of the threshold level Ic on the the sliding mode region. Fig. 5 shows the possible sliding modes and pseudo-equilibrium for different values of parameter Ic. We select Ic=0,1,2,,20 in each subplot. The black solid lines represent the vertical isoclines for system SG1 and system SG2, denoted by gs1 and gs2, respectively. The grey thin solid lines represent the horizontal isoclines for system SG1 and system SG2, denoted by gi1 and gi2, respectively. The grey thick solid lines stand for the sliding mode regions with various threshold levels Ic. The red cycle points are the regular endemic equilibria while the red diamond points denote the pseudo-equilibria of the system (4). Subplot (a) and (b) show the case R0>1 and the case R0<1, respectively.

    Figure 5. Evolution of the sliding modes and pseudo-equilibria for Filippov system (4) with respect to the threshold level Ic. Here we fix all other parameters as follows: Λ=8,μ=0.1,β=1.8,h0=0.2,ν=0.6 and h1=0.8,b=5(a);h1=2,b=3.28(b).

    It is clear that the pseudo-equilibria and sliding modes are sensitive to the threshold level Ic. If the basic reproduction number is greater than unity, Fig. 5(a) indicates that the sliding mode region enlarges as Ic increases. In particular, if we let Ic<6.6667, for instance, Ic=6, the endemic equilibrium of system SG1 (i.e.E1) is virtual, that of system SG2 (i.e. E2) is real and no pseudo-equilibrium exists. If Ic increases and reaches Ic=6.6667, a boundary equilibrium Eb1 appears. If Ic further increases such that 6.6667<Ic<9.2934, for example Ic=7, a pseudo-equilibrium Es and two real endemic equilibria appears. If Ic increases to Ic=9.2934, another boundary equilibrium Eb2 is feasible. Note that the pseudo-equilibrium disappears while virtual endemic equilibrium E2 and real endemic equilibrium E1 coexist for Ic>9.2934, for example Ic=10. If R0<1, it follows from Fig. 5(b) that the repulsing sliding mode region is feasible only when the threshold level satisfies Ic>Ic0. Similar argument to that on Fig. 5(a) yields the evolution of sliding mode regions as well as equilibria.

    It follows from the above discussion that we can increase the threshold level Ic such that only endemic equilibrium E1=(S1,I1) of system SG1 is real for R0>1, where I1 represents a relatively low equilibrium level of infection. If R0<1, the infectious disease cannot be eradicated due to the existence of multiple endemic equilibria of system SG2. However, Fig. 5(b) shows that both endemic equilibria of system SG2 can be virtual if Ic is increased to a high level in such scenario, so neither of them can be the attractor of the Filippov system. This indicates that increasing the threshold level Ic can lead to the nonexistence of real endemic equilibria, i.e. only the disease free equilibrium is real in such scenario.

    Impact of HBPR parameter b. Due to the significance of hospital bed-population ratio (HBPR) on the control of disease, it is essential to examine the impact of HBPR parameter b on disease infection. To this purpose, we numerically conduct the analysis about the effect of b on the variation of sliding mode and equilibria, as shown in Fig. 6. The black circle points represent the endemic equilibria of system SG2 with higher endemicity while the square ones denote the endemic equilibria of system SG1 (shown in Fig. 6(a)) or the endemic equilibrium of system SG2 with lower endemicity (shown in Fig. 6(b)). The solid ones of those are real equilibria while the hollow ones are virtual equilibria. We select the parameter b as a bifurcation parameter and all other parameters are fixed as indicated in Fig. 6, with R0>1 for subplot (a) and R0<1 for subplot (b). Fig. 6 shows that the sliding mode region shrinks as the parameter b increases for both R0>1 and R0<1. For R0>1, Fig. 6(a) indicates that two endemic equilibria (E1,E2) coexist for system (4), one (i.e. E1) for system SG1 and the other (i.e. E2) for system SG2. Further, E1 is real and independent of the size of parameter b while a real/virtual equilibrium bifurcation occurs at E2, i.e. the real equilibrium E2 becomes a virtual one when the parameter b passes through a critical value around b=12, where the pseudo-equilibrium Es disappears. In fact, Es is feasible for b less than the critical value b=12. It follows from Fig. 6(b) that the sliding mode region is feasible only when the parameter b satisfies b<bc with bc=(βr0)Ic/(r1β), and here we have bc=8. In such scenario, both endemic equilibrium E2 and E3 exist for the parameter b less than a critical value about b=3.4315. The one with lower endemicity (i.e. E3) is virtual provided it is feasible while a real/virtual equilibrium bifurcation is triggered at E2 when the parameter b passes through a certain critical value around 2.6, below which the pseudo-equilibrium is feasible.

    Figure 6. Evolution of the sliding modes (grey thick solid lines), the regular endemic equilibria (circle points and square points) and pseudo-equilibria (diamond points) for Filippov system (4) with respect to the parameter b. Here we fix all other parameters as follows: Λ=8,μ=0.1,β=1.8,h0=0.2,ν=0.6 and h1=0.8,Ic=8.6(a);h1=2,Ic=8(b).

    The above discussion demonstrates that only endemic equilibrium of free system exists for Filippov system (4) by increasing the HBPR (i.e. b) for R0>1, which indicates I1 stands for the equilibrium level of infected individuals in this case. If R0<1, a backward bifurcation is triggered for system SG2 when the parameter b passes through the critical value b=3.4315. In particular, if R0<1 and b>3.4315, no stable endemic equilibrium exists for system SG2; for b<3.4315, there are two endemic equilibria, which collide together and are substituted by a unique endemic equilibrium for b=3.4315. Note that only those real stable equilibria can be the attractor of system (3) and endemic equilibrium E2 is real for R0<1,b<2.6, so the coexistence of stable disease free equilibrium and endemic equilibrium occurs at b=2.6 for system (3). This indicates that no endemic equilibrium exists besides the disease-free equilibrium E0 when the number of hospital beds is enough large, so E0 becomes the unique attractor in such scenario.

    Note that here increasing Ic or b makes the Filippov system work as system SG1, and consequently this bifurcation result is rather obvious. Moreover, we refer backward to the co-existence of a stable disease free equilibrium and a stable endemic equilibrium when the basic reproductive number is less than unity, i.e., the backward bifurcation leads to bistability for R0<1 as a parameter varies. In particular, the real endemic equilibrium E2, which can be stable, begins to exist for system (3) besides the disease free equilibrium when the parameter b passes through the value b=2.6, as addressed above, so a backward bifurcation occurs.

    Impact of the maximum and minimum treatment rate. In this section, we focus on the impact of maximum and minimum per capita treatment rate (i.e. h1 and h0) on the equilibrium level of infected individuals for system SG2 in the following.

    Fig. 7 is to show the variation of the number of infected individuals in steady states as the maximum per capita treatment rate h1 varies. The black solid (dashed) lines represent the number of infected individuals with high (low) endemicity in steady states, i.e. I2 (I3). The grey solid line describes the variation of basic reproduction number R0 with the maximum treatment rate h1. Solving R0=1 and C0=0 with respect to h1 yields h11=β(μ+ν) and

    h12=4βμbΛ2D1(4βμbΛ2D1)24b2ν2(D21+4βμbr0Λ)2b2ν2(μ+ν),D1=bν[Λ(r0β)βb(μ+ν)],
    Figure 7. Evolution of the infected cases with respect to the maximum per capita treatment rate h1. Here we fix all other parameters as follows: Λ=8,μ=0.1,β=1.8,ν=0.6,b=5,h0=0.2.

    respectively. Denote

    L1={(S,I)R2+: S=h11},L2={(S,I)R2+: S=h12}.

    Then L1 divides the whole domain into two parts, the one to the left of which is for R0>1 while the one to the right is for R0<1. Line L2 also divides the whole region into two parts, the part to the left of which stands for C0>0,(a1+C0)/(2a0)<Λ/(μ+ν) while the part to the right of which is for C00 or (a1+C0)/(2a0)>Λ/(μ+ν)). So, there is a unique endemic equilibrium E2 for subsystem SG2 if h1<h11 (i.e. R0>1,C0>0), which is stable in some cases; two endemic equilibria E2 and E3 coexist for subsystem SG2 if h11<h1<h12 (i.e. R0<1,C0>0,(a1+C0)/(2a0)<Λ/(μ+ν)), and E2 is stable in some cases while E3 is unstable; no endemic equilibrium is feasible for h1>h12 (i.e. R0<1 and C0<0 or (a1+C0)/(2a0)<Λ/(μ+ν)); a unique endemic equilibrium E exists for h1=h12 (i.e. R0<1,C0=0). Further discussion yields that a backward bifurcation occurs when the parameter h1 passes through the critical value h12 on one hand. On the other hand, a saddle-node bifurcation occurs at h1=h12, which implies E is a saddle-node as the result of the collision of E2 and E3.

    It follows from Fig. 7 that I2 decreases as h1 increases for h1<h12, which implies that the number of infected cases decreases as the maximum treatment rate increases. If we select the maximum treatment rate properly such that h1>h12, only the disease free equilibrium E0 is the attractor.

    By choosing the minimum per capita treatment rate h0 as a bifurcation parameter and fixing all other parameters, the evolution of the number of infected cases is clearly depicted in Fig. 8. Solving C0=0 in terms of h0 gives

    h01=2D2Λ4βμbΛ(4βμbΛ2D2Λ)24Λ2(D224βμbΛr1)2Λ2(μ+ν),D2=βΛbνr1+bβ(μ+ν).
    Figure 8. Evolution of the equilibria with respect to the minimum per capita treatment rate h0. Here we fix all other parameters as follows: Λ=8,μ=0.1,β=1.8,ν=0.6 and b=5,h1=1.05(a);b=3.28,h1=2(b).

    Denote

    L4={(S,I)R2+: S=h01}.

    According to Fig. 8(a), the equilibrium number of infected cases for system SG2 can be contained at a low level by enhancing the minimum per capita treatment rate h0 for R0>1. Similar argument yields that increasing the minimum treatment rate can lead to the existence of only disease free equilibrium E0 for system SG2.


    6. Discussion and conclusions

    It has been observed that treatment programme plays a significant role in controlling the emerging and reemerging infectious diseases, such as HIV [36] and Ebola [23], and usually the control programme is implemented only when the number of infected individuals reaches or exceeds the threshold level Ic. In this study, we propose a Filippov epidemic model by using a piecewise smooth function to reflect the treatment rate, which incorporates the impact of number of hospital beds. By taking the number of infected cases as a critical index, we define a threshold policy as follows: the treatment policy, depending on HBPR and the number of infected cases, is implemented when the number of infected individuals is above the threshold level; below this level, a larger treatment ratio, which is indeed the maximum per capita treatment ratio the health care system can provide, is adopted. Our modeling and results extend the recent work [35] on the impact of threshold policy on the control of infectious diseases.

    Based on the dynamics of two subsystems of the Filippov system, we investigate the long-term dynamical behavior, which reveals much more complex dynamics compared to those for the continuous counterpart. In particular, we have examined the sliding mode, pseudo-equilibrium, multiple attractors in Section 3 and Section 4, respectively. As the threshold value varies, bifurcation analysis of piecewise smooth systems [17,29] on the proposed Filippov epidemic model yields the following local sliding bifurcations theoretically, i.e. regular/virtual equilibrium bifurcation, boundary equilibrium bifurcation including BN (see Fig. 1), BF, BS (see Fig. 2) and BSN bifurcations (see Fig. 3), and global sliding bifurcations including grazing bifurcation (see Fig. 4) and sliding homoclinic bifurcation (see Fig. 4). Our results demonstrate that variety of threshold level can give rise to diversity of long-term dynamical behavior.

    It is worth emphasizing that understanding of impact of threshold policy will lead to the development of effective control programmes for public health, so we have examined the impact of some key parameters related to the control measure in Section 5. According to Fig. 5(a), if the basic reproduction number is greater than unity, we can choose proper threshold level such that the real equilibrium of system SG1, or that of system SG2, or both of them together with the unique pseudo-equilibrium act as the attractors for Filippov system (4), which implies that different threshold levels and initial states lead to different levels of total number of infected cases. It follows from Fig. 5 and Fig. 6 that we can select a proper threshold value or the number of hospital beds such that the endemic equilibrium with the lowest endemicity or the disease free equilibrium appears as the attractor (i.e. the endemic one of system SG1 for R0>1 while disease free equilibrium for R0<1). This observation indicates that the course of an outbreak as well as the control outcome are sensitive to the threshold level and the available HBPR. If the infectious disease is on the course of becoming endemic (R0>1), it is essential to increase the medical resources, i.e, to increase the number of hospital beds therefore the possibility of implementing maximum treatment ratio to control the infection to a relatively low level. For the case when R0<1, the infection can still become endemic due to the possible existence of backward bifurcation of system SG2, increasing the medical resources therefore be essential to control the spreading of infection.

    In most cases, it is impossible to eradicate an epidemic disease from the population. We have investigated how the maximum and minimum treatment rate affect the equilibrium level of infected individuals in Section 5. Fig. 7 and Fig. 8 show that the number of infected individuals at the steady state is closely related to the maximum and minimum per capita treatment rate. The maximum and minimum per capita treatment rate remain effective for reducing transmission during the outbreak. In particular, if R0>1, strengthening the basic medical conditions and increasing medical resources, i.e. increasing the minimum and maximum treatment ratio, will result in a relative low level of infected cases, as shown in Fig. 8 (a) and Fig. 7. Increasing maximum treatment rate h1 (or minimum treatment rate h0 if R0<1) such that h1>h12 (or h0>h01) will aid in eradicating the disease, as shown in Fig. 7 and Fig. 8(b).

    It is worth noting that we choose the size of infected individuals as an index. In fact, the number of susceptible individuals can also affect on the implementation of control measures, especially on those immunization policies, so it is more appropriate for modeling the impact of limited resources on vaccination policies. Moreover, it is more natural to choose the total number of susceptible individuals and infected individuals as an index, especially for the combined control measure based on treatment and vaccination policy, which may be difficult and interesting, and we leave this for future work.

    In conclusion, we propose a Filippov epidemic model to study the impact of HBPR on the disease control by incorporating a piecewise defined treatment programme in this paper. The main results illustrate the significant role of switching treatment programme in response to the call of controlling the epidemic disease. Indeed, to illustrate the main idea, we formulate a simple SIS model without considering the effect of hospitalized infection. Generally, those hospitalized has no contact with susceptible individuals, so no transmission occurs. An SIH (susceptible-infective-hospitalized) model of three dimension could then be more natural, which we will consider in the future work.


    Acknowledgments

    The first author was supported by Scientific research plan projects of Shaanxi Education Department (16JK1047). Xiao was supported by the National Natural Science Foundation of China (NSFC, 11571273 and 11631012) and Fundamental Research Funds for the Central Universities(GK 08143042). Zhu was supported by NSERC of Canada. This research was finished when Wang visited Lamps and Department of Mathematics and Statistics, York University.


    [1] [ A. Abdelrazec,J. Bélair,C. Shan, Modeling the spread and control of dengue with limited public health resources, Math. Biosci., 271 (2016): 136-145.
    [2] [ M. J. Aman and F. Kashanchi, Zika virus: A new animal model for an arbovirus, PLOS Negl Trop Dis, 10 (2016), e0004702.
    [3] [ M. Bernardo, C. Budd, A. R. Champneys and et al., Piecewise-smooth Dynamical Systems: Theory and Applications, Springer, 2008.
    [4] [ F. Bizzarri,A. Colombo,F. Dercole, Necessary and sufficient conditions for the noninvertibility of fundamental solution matrices of a discontinuous system, SIAM J Appl. Dyn. Syst., 15 (2016): 84-105.
    [5] [ Y. Cai,Y. Kang,M. Banerjee, A stochastic SIRS epidemic model with infectious force under intervention strategies, J Differ Equations, 259 (2015): 7463-7502.
    [6] [ N. S. Chong,B. Dionne,R. Smith, An avian-only Filippov model incorporating culling of both susceptible and infected birds in combating avian influenza, J Math. Biol., 73 (2016): 751-784.
    [7] [ A. Colombo,F. Dercole, Discontinuity induced bifurcations of non-hyperbolic cycles in non-smooth systems, SIAM J Appl. Dyn. Syst., 9 (2010): 62-83.
    [8] [ F. Della Rossa,F. Dercole, Generalized boundary equilibria in n-dimensional Filippov systems: The transition between persistence and nonsmooth-fold scenarios, Physica D, 241 (2012): 1903-1910.
    [9] [ F. Della Rossa,F. Dercole, Generic and generalized boundary operating points in piecewise-linear (discontinuous) control systems, 51st IEEE Conference on Decision and Control, null (2012): 7714-7719.
    [10] [ F. Dercole, Border collision bifurcations in the evolution of mutualistic interactions, Int. J. Bifurcat. Chaos, 15 (2005): 2179-2190.
    [11] [ F. Dercole,F. Della Rossa,A. Colombo, Two degenerate boundary equilibrium bifurcations in planar Filippov systems, SIAM J Appl. Dyn. Syst., 10 (2011): 1525-1553.
    [12] [ F. Dercole,R. Ferrière,A. Gragnani, Coevolution of slow-fast populations: Evolutionary sliding, evolutionary pseudo-equilibria and complex Red Queen dynamics, P. Roy. Soc. B-Biol. Sci., 273 (2006): 983-990.
    [13] [ F. Dercole,A. Gragnani,Y. A. Kuznetsov, Numerical sliding bifurcation analysis: An application to a relay control system, IEEE T Circuits-I, 50 (2003): 1058-1063.
    [14] [ F. Dercole,A. Gragnani,S. Rinaldi, Bifurcation analysis of piecewise smooth ecological models, Theor. Popul. Biol., 72 (2007): 197-213.
    [15] [ F. Dercole,Y. A. Kuznetsov, SlideCont: An Auto97 driver for bifurcation analysis of Filippov systems, ACM Math. Software., 31 (2005): 95-119.
    [16] [ F. Dercole,M. Stefano, Detection and continuation of a border collision bifurcation in a forest fire model, Appl. Math. Comput., 168 (2005): 623-635.
    [17] [ M. Di Bernardo,C. J. Budd,A. R. Champneys, Bifurcations in nonsmooth dynamical systems, SIAM Rev., 50 (2008): 629-701.
    [18] [ M. Di Bernardo,P. Kowalczyk,A. Nordmark, Bifurcations of dynamical systems with sliding: Derivation of normal-form mappings, Physica D, 170 (2002): 175-205.
    [19] [ C. A. Donnelly,M. C. Fisher,C. Fraser, Epidemiological and genetic analysis of severe acute respiratory syndrome, Lancet Infect. Dis., 4 (2004): 672-683.
    [20] [ S. Echevarría-Zuno,J. M. Mejía-Aranguré,A. J. Mar-Obeso, Infection and death from influenza a H1N1 virus in mexico: a retrospective analysis, Lancet, 374 (2010): 2072-2079.
    [21] [ A. F. Filippov and F. M. Arscott, Differential Equations with Discontinuous Righthand Sides: Control Systems, Springer, 1988.
    [22] [ C. Fraser,C. A. Donnelly S. Cauchemez, Pandemic potential of a strain of influenza a (H1N1): early findings, Science, 324 (2009): 1557-1561.
    [23] [ J. L. Goodman, Studying "secret serums" toward safe, effective ebola treatments, New Engl. J Med., 371 (2014): 1086-1089.
    [24] [ L. V. Green, How many hospital beds, Inquiry: J. Health Car., 39 (2002): 400-412.
    [25] [ M. Guardia,S. J. Hogan,T. M. Seara, An analytical approach to codimension-2 sliding bifurcations in the dry-friction oscillator, SIAM J Appl. Dyn. Syst., 9 (2010): 769-798.
    [26] [ M. Guardia,T. M. Seara,M. A. Teixeira, Generic bifurcations of low codimension of planar filippov systems, J. Differ. Equations, 250 (2011): 1967-2023.
    [27] [ A. B. Gumel,S. Ruan,T. Day, Modelling strategies for controlling SARS outbreaks, P. Roy. Soc. B-Biol. Sci., 271 (2004): 2223-2232.
    [28] [ V. Křivan, On the gause predator-prey model with a refuge: A fresh look at the history, J. of Theor. Biol., 274 (2011): 67-73.
    [29] [ Y. A. Kuznetsov,S. Rinaldi,A. Gragnani, One-parameter bifurcations in planar filippov systems, Int. J. Bifurcat. Chaos, 13 (2003): 2157-2188.
    [30] [ I. M. Longini,A. Nizam,S. Xu, Containing pandemic influenza at the source, Science, 309 (2005): 1083-1087.
    [31] [ M. E. M. Meza,A. Bhaya,E. Kaszkurewicz, Threshold policies control for predator-prey systems using a control liapunov function approach, Theor. Popul. Biol., 67 (2005): 273-284.
    [32] [ W. Qin,S. Tang,C. Xiang, Effects of limited medical resource on a Filippov infectious disease model induced by selection pressure, Appl. Math. Comput., 283 (2016): 339-354.
    [33] [ Z. Sadique,B. Lopman,B. S. Cooper, Cost-effectiveness of ward closure to control outbreaks of norovirus infection in United Kingdom National Health Service Hospitals, J. Infect. Dis., 213 (2016): S19-S26.
    [34] [ C. Shan,Y. Yi,H. Zhu, Nilpotent singularities and dynamics in an SIR type of compartmental model with hospital resources, J Differ Equations, 260 (2016): 4339-4365.
    [35] [ C. Shan,H. Zhu, Bifurcations and complex dynamics of an sir model with the impact of the number of hospital beds, J Differ Equations, 257 (2014): 1662-1688.
    [36] [ X. Sun, Y. Xiao, S. Tang and et al., Early HAART initiation may not reduce actual reproduction number and prevalence of MSM infection: Perspectives from coupled within-and between-host modelling studies of Chinese MSM populations, PloS one, 11 (2016), e0150513.
    [37] [ S. Tang,J. Liang,Y. Xiao, Sliding bifurcations of filippov two stage pest control models with economic thresholds, SIAM J Appl. Dyn. Syst., 72 (2012): 1061-1080.
    [38] [ S. Tang, Y. Xiao, Y. Yang and et al., Community-based measures for mitigating the 2009 H1N1 pandemic in china, PloS One, 5 (2010), e10911.
    [39] [ V. I. Utkin, Sliding Modes and Their Applications in Variable Structure Systems, Mir, Moscow, 1978.
    [40] [ A. Wang and Y. Xiao, Sliding bifurcation and global dynamics of a Filippov epidemic model with vaccination, Int. J. Bifurcat. Chaos, 23 (2013), 1350144, 32pp.
    [41] [ W. Wang, Backward bifurcation of an epidemic model with treatment, Math. Biosci., 201 (2006): 58-71.
    [42] [ WHO Ebola Response Team, Ebola virus disease in west africa--the first 9 months of the epidemic and forward projections, New Engl. J Med., 371 (2014): 1481-1495.
    [43] [ World health organization, World health statistics, 2005-2015.
    [44] [ Y. Xiao, S. Tang and J. Wu, Media impact switching surface during an infectious disease outbreak, Sci. Rep. -UK, 5 (2015).
    [45] [ X. Zhang,X. Liu, Backward bifurcation and global dynamics of an SIS epidemic model with general incidence rate and treatment, Nonlinear Anal-Real, 10 (2009): 565-575.
  • This article has been cited by:

    1. Weike Zhou, Aili Wang, Xia Wang, Robert A. Cheke, Yanni Xiao, Sanyi Tang, Impact of Hospital Bed Shortages on the Containment of COVID-19 in Wuhan, 2020, 17, 1660-4601, 8560, 10.3390/ijerph17228560
    2. Lirong Liu, Changcheng Xiang, Guangyao Tang, Yuan Fu, Sliding Dynamics of a Filippov Forest-Pest Model with Threshold Policy Control, 2019, 2019, 1076-2787, 1, 10.1155/2019/2371838
    3. Wenjie Qin, Xuewen Tan, Xiaotao Shi, Changcheng Xiang, IPM strategies to a discrete switching predator-prey model induced by a mate-finding Allee effect, 2019, 13, 1751-3758, 586, 10.1080/17513758.2019.1682200
    4. Khalil Muqbel, Gabriella Vas, Gergely Röst, Periodic Orbits and Global Stability for a Discontinuous SIR Model with Delayed Control, 2020, 19, 1575-5460, 10.1007/s12346-020-00395-0
    5. Salihu Sabiu Musa, Shi Zhao, Nafiu Hussaini, Abdulrazaq Garba Habib, Daihai He, Mathematical modeling and analysis of meningococcal meningitis transmission dynamics, 2020, 13, 1793-5245, 2050006, 10.1142/S1793524520500060
    6. Ana María Pulecio-Montoya, Luis Eduardo López-Montenegro, Jhon Cerón-Caicedo, Sliding Dynamic in a 3-dimensional epidemiological system, 2021, 185, 03784754, 570, 10.1016/j.matcom.2021.01.015
    7. Aili Wang, Yanni Xiao, Robert Smith, Multiple Equilibria in a Non-smooth Epidemic Model with Medical-Resource Constraints, 2019, 81, 0092-8240, 963, 10.1007/s11538-018-00544-2
    8. Zhimin Chen, Kaihui Liu, Xiuxiang Liu, Yijun Lou, Modelling epidemics with fractional-dose vaccination in response to limited vaccine supply, 2020, 486, 00225193, 110085, 10.1016/j.jtbi.2019.110085
    9. Hongyong Zhao, Liping Wang, Sergio Muniz Oliva, Huaiping Zhu, Modeling and Dynamics Analysis of Zika Transmission with Limited Medical Resources, 2020, 82, 0092-8240, 10.1007/s11538-020-00776-1
    10. Aili Wang, Yanni Xiao, Robert Smith, Dynamics of a non-smooth epidemic model with three thresholds, 2020, 139, 1431-7613, 47, 10.1007/s12064-019-00297-z
    11. Yunhu Zhang, Yanni Xiao, Global dynamics for a Filippov epidemic system with imperfect vaccination, 2020, 38, 1751570X, 100932, 10.1016/j.nahs.2020.100932
    12. Joshua Kiddy K. Asamoah, Farai Nyabadza, Zhen Jin, Ebenezer Bonyah, Muhammad Altaf Khan, Michael Y. Li, Tasawar Hayat, Backward bifurcation and sensitivity analysis for bacterial meningitis transmission dynamics with a nonlinear recovery rate, 2020, 140, 09600779, 110237, 10.1016/j.chaos.2020.110237
    13. Salihu Sabiu Musa, Shi Zhao, Nafiu Hussaini, Salisu Usaini, Daihai He, Dynamics analysis of typhoid fever with public health education programs and final epidemic size relation, 2021, 10, 25900374, 100153, 10.1016/j.rinam.2021.100153
    14. Hao Zhou, Biao Tang, Huaiping Zhu, Sanyi Tang, Bifurcation and Dynamic Analyses of Non-monotonic Predator–Prey System with Constant Releasing Rate of Predators, 2022, 21, 1575-5460, 10.1007/s12346-021-00539-w
    15. Aili Wang, Jin Guo, Yinjiao Gong, Xueying Zhang, Rong Yan, Modeling the effect of Fangcang shelter hospitals on the control of COVID‐19 epidemic, 2022, 0170-4214, 10.1002/mma.8427
    16. Lin Hu, Shengfu Wang, Tingting Zheng, Zhenxiang Hu, Yuenan Kang, Lin-Fei Nie, Zhidong Teng, The Effects of Migration and Limited Medical Resources of the Transmission of SARS-CoV-2 Model with Two Patches, 2022, 84, 0092-8240, 10.1007/s11538-022-01010-w
    17. Yi Yang, Lirong Liu, Changcheng Xiang, Wenjie Qin, Switching dynamics analysis of forest-pest model describing effects of external periodic disturbance, 2020, 17, 1551-0018, 4328, 10.3934/mbe.2020239
    18. Hao Zhou, Sanyi Tang, Complex Dynamics and Sliding Bifurcations of the Filippov Lorenz–Chen System, 2022, 32, 0218-1274, 10.1142/S0218127422501826
    19. A. K. Misra, Jyoti Maurya, Modeling the importance of temporary hospital beds on the dynamics of emerged infectious disease, 2021, 31, 1054-1500, 103125, 10.1063/5.0064732
    20. A. K. Misra, Jyoti Maurya, Mohammad Sajid, Modeling the effect of time delay in the increment of number of hospital beds to control an infectious disease, 2022, 19, 1551-0018, 11628, 10.3934/mbe.2022541
    21. A. K. Misra, Jyoti Maurya, Bifurcation analysis and optimal control of an epidemic model with limited number of hospital beds, 2023, 16, 1793-5245, 10.1142/S1793524522501017
    22. Guilherme Tavares da Silva, Ricardo Miranda Martins, Dynamics and stability of non-smooth dynamical systems with two switches, 2022, 108, 0924-090X, 3157, 10.1007/s11071-022-07384-9
    23. Hao Zhou, Sanyi Tang, Bifurcation dynamics on the sliding vector field of a Filippov ecological system, 2022, 424, 00963003, 127052, 10.1016/j.amc.2022.127052
    24. A. K. Misra, Jyoti Maurya, Allocation of hospital beds on the emergence of new infectious disease: A mathematical model, 2023, 33, 1054-1500, 043125, 10.1063/5.0133703
    25. Ishfaq Ahmad, Hiromi Seno, An epidemic dynamics model with limited isolation capacity, 2023, 1431-7613, 10.1007/s12064-023-00399-9
    26. Jin Yang, Likun Guan, Zhuo Chen, Yuanshun Tan, Zijian Liu, Robert A. Cheke, Bifurcation analysis of a nonlinear pulse SIR model with media coverage, 2023, 111, 0924-090X, 19543, 10.1007/s11071-023-08869-x
    27. Jyoti Maurya, Konstantin B. Blyuss, A. K. Misra, Prospective impact of healthcare facilities and infrastructure on infectious disease outbreak dynamics: a modeling study, 2024, 1951-6355, 10.1140/epjs/s11734-024-01224-0
    28. Rajesh Ranjan Patra, Sarit Maitra, Discontinuous harvesting policy in a Filippov system involving prey refuge, 2024, 43, 2238-3603, 10.1007/s40314-024-02858-5
    29. Hao Zhou, Qianqian Zhang, Sanyi Tang, Qualitative analysis of the sliding vector field in a Filippov food chain model with integrated pest management strategy, 2025, 490, 00963003, 129188, 10.1016/j.amc.2024.129188
    30. Zhiqiong Fu, Hiromi Seno, SIRI+Q model with a limited capacity of isolation, 2025, 1431-7613, 10.1007/s12064-025-00437-8
  • Reader Comments
  • © 2018 the Author(s), licensee AIMS Press. This is an open access article distributed under the terms of the Creative Commons Attribution License (http://creativecommons.org/licenses/by/4.0)
通讯作者: 陈斌, bchen63@163.com
  • 1. 

    沈阳化工大学材料科学与工程学院 沈阳 110142

  1. 本站搜索
  2. 百度学术搜索
  3. 万方数据库搜索
  4. CNKI搜索

Metrics

Article views(5176) PDF downloads(934) Cited by(30)

Article outline

Figures and Tables

Figures(8)  /  Tables(1)

Other Articles By Authors

/

DownLoad:  Full-Size Img  PowerPoint
Return
Return

Catalog