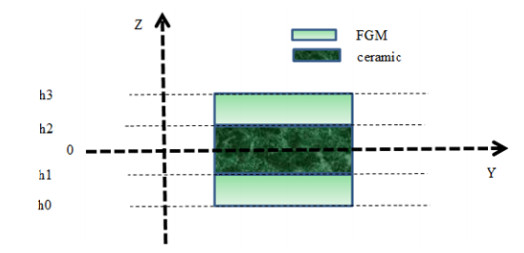
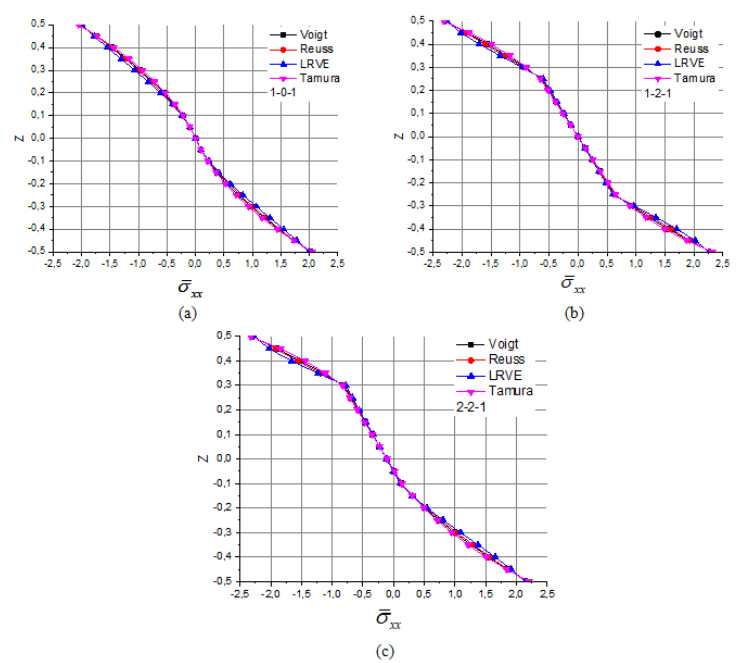
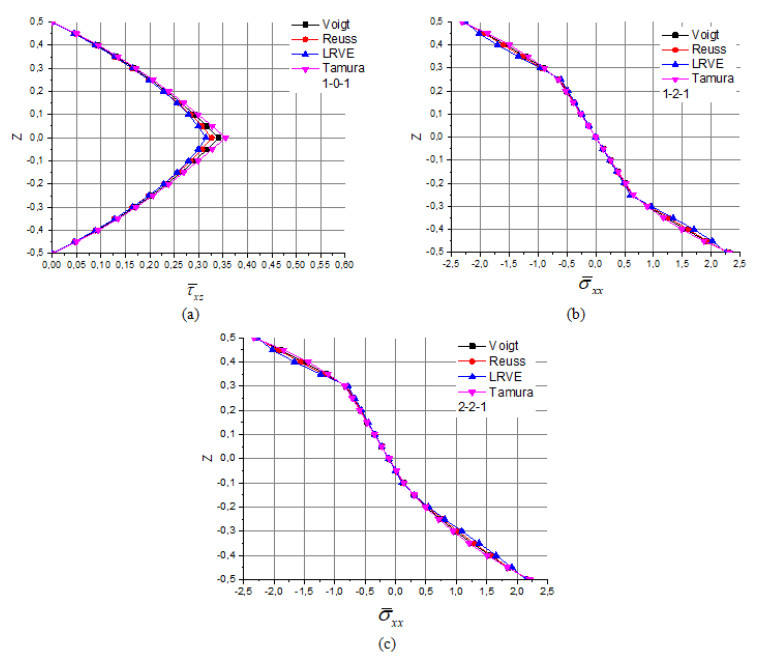
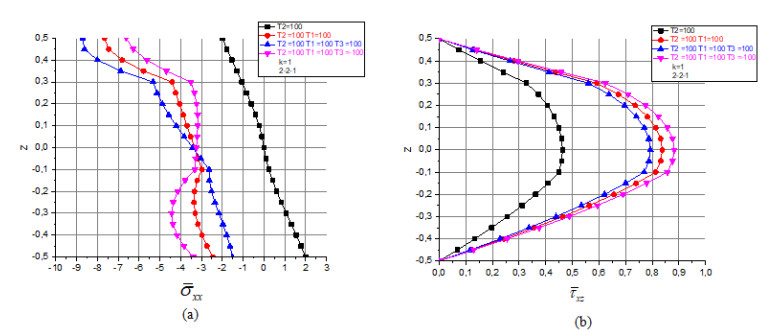
The principal goal of the current work is to study the impact of three homogenization models (Reuss, LRVE, Tamura) on the axial and shear stress of sandwich functionally graded plate materials subjected on linear and nonlinear thermal loads with static and elastic behavior and it is simply supported using an integral higher shear deformation theory (HSDT). The governing partial differential equations are solved in the spatial coordinate by Navier solution. Those Numerous micromechanical models have been examined to attain the effective material properties of the two-phase FGM plate. The numerical results are compared with those given by other model existing in the literature to confirm the accuracy of the (HSDT). The present results are in good agreement with all models studied of homogenization for all values of the material index and all geometry configurations of the FG-sandwich plates.
Citation: Rebai Billel. Contribution to study the effect of (Reuss, LRVE, Tamura) models on the axial and shear stress of sandwich FGM plate (Ti–6A1–4V/ZrO2) subjected on linear and nonlinear thermal loads[J]. AIMS Materials Science, 2023, 10(1): 26-39. doi: 10.3934/matersci.2023002
The principal goal of the current work is to study the impact of three homogenization models (Reuss, LRVE, Tamura) on the axial and shear stress of sandwich functionally graded plate materials subjected on linear and nonlinear thermal loads with static and elastic behavior and it is simply supported using an integral higher shear deformation theory (HSDT). The governing partial differential equations are solved in the spatial coordinate by Navier solution. Those Numerous micromechanical models have been examined to attain the effective material properties of the two-phase FGM plate. The numerical results are compared with those given by other model existing in the literature to confirm the accuracy of the (HSDT). The present results are in good agreement with all models studied of homogenization for all values of the material index and all geometry configurations of the FG-sandwich plates.

| [1] |
Venâncio MAS, Loja A (2016) A study on the behavior of laminated and sandwich composite plates using a layerwise theory. AIMS Mater Sci 3: 1587–1614. https://doi.org/10.3934/matersci.2016.4.1587 doi: 10.3934/matersci.2016.4.1587

|
| [2] |
Salleh Z, Islam MM, Epaarachchi JA, et al. (2016) Mechanical properties of sandwich composite made of syntactic foam core and GFRP skins. AIMS Mater Sci 3: 1704–1727. https://doi.org/10.3934/matersci.2016.4.1704 doi: 10.3934/matersci.2016.4.1704
|
| [3] |
Abood AM, Khazal H, Hassan AF (2022) On the determination of first-mode stress intensity factors and T-stress in a continuous functionally graded beam using digital image correlation method. AIMS Mater Sci 9: 56–70. https://doi.org/10.3934/matersci.2022004 doi: 10.3934/matersci.2022004
|
| [4] |
Bash AM, Mnawe SE, Salah SA (2020) Numerical buckling analysis of carbon fibre-epoxy composite plates with different cutouts number by finite element method. AIMS Mater Sci 7: 46–59. https://doi.org/10.3934/matersci.2020.1.46 doi: 10.3934/matersci.2020.1.46
|
| [5] |
Sánchez CA, Cardona-Maya Y, Morales AD, et al. (2021) Development and evaluation of polyvinyl alcohol films reinforced with carbon nanotubes and alumina for manufacturing hybrid metal matrix composites by the sandwich technique. AIMS Mater Sci 8: 149–165. https://doi.org/10.3934/matersci.2021011 doi: 10.3934/matersci.2021011
|
| [6] |
Saberi S, Abdollahi A, Inam F (2021) Reliability analysis of bistable composite laminates. AIMS Mater Sci 8: 29–41. https://doi.org/10.3934/matersci.2021003 doi: 10.3934/matersci.2021003
|
| [7] |
Ishchuk V, Kuzenko D, Sobolev V (2018) Piezoelectric and functional properties of materials with coexisting ferroelectric and antiferroelectric phases. AIMS Mater Sci 5: 711–741. https://doi.org/10.3934/matersci.2018.4.711 doi: 10.3934/matersci.2018.4.711
|
| [8] | Kozhakhmetov Y, Skakov M, Wieleba W, et al. (2020) Evolution of intermetallic compounds in Ti-Al-Nb system by the action of mechanoactivation and spark plasma sintering. AIMS Mater Sci 7: 182–191. |
| [9] |
Costa S, Souza MS, Braz-César MT, et al. (2021) Experimental and numerical study to minimize the residual stresses in welding of 6082-T6 aluminum alloy. AIMS Mater Sci 8: 271–282. https://doi.org/10.3934/matersci.2021018 doi: 10.3934/matersci.2021018
|
| [10] |
Abdellah MY, Alharthi H, Hassan MK, et al. (2020) Effect of specimen size on natural vibration of open hole copper/glass-reinforced epoxy laminate composites. AIMS Mater Sci 7: 499–517. https://doi.org/10.3934/matersci.2020.4.499 doi: 10.3934/matersci.2020.4.499
|
| [11] |
Soyama H, Okura Y (2018) The use of various peening methods to improve the fatigue strength of titanium alloy Ti6Al4V manufactured by electron beam melting. AIMS Mater Sci 5: 1000-1015. https://doi.org/10.3934/matersci.2018.5.1000 doi: 10.3934/matersci.2018.5.1000
|
| [12] |
Esquivel Merino MD, Van Der Voort P, Romero-Salguero F (2014) Designing advanced functional periodic mesoporous organosilicas for biomedical applications. AIMS Mater Sci 1: 70–86. https://doi.org/10.3934/matersci.2014.1.70 doi: 10.3934/matersci.2014.1.70
|
| [13] |
Nie G, Zhong Z (2010) Dynamic analysis of multi-directional functionally graded annular plates. Appl Math Model 34: 608–616. https://doi.org/10.1016/j.apm.2009.06.009 doi: 10.1016/j.apm.2009.06.009
|
| [14] |
Tucker Ⅲ, Charles L, Liang E (1999) Stiffness predictions for unidirectional short-fiber composites: Review and evaluation. Compos Sci Technol 59: 655–671. https://doi.org/10.1016/S0266-3538(98)00120-1 doi: 10.1016/S0266-3538(98)00120-1
|
| [15] |
Kim JH, Paulino GH (2003) An accurate scheme for mixed-mode fracture analysis of functionally graded materials using the interaction integral and micromechanics models. Int J Numer Meth Eng 58: 1457–1497. https://doi.org/10.1002/nme.819 doi: 10.1002/nme.819
|
| [16] |
Zuiker JR (1995) Functionally graded materials: Choice of micromechanics model and limitations in property variation. Comp Eng 5: 807–819. https://doi.org/10.1016/0961-9526(95)00031-H doi: 10.1016/0961-9526(95)00031-H
|
| [17] |
Gasik MM (1998) Micromechanical modelling of functionally graded materials. Comp Mater Sci 13: 42-55. https://doi.org/10.1016/S0927-0256(98)00044-5 doi: 10.1016/S0927-0256(98)00044-5
|
| [18] |
Akbarzadeh AH, Abedini A, Chen ZT (2015) Effect of micromechanical models on structural responses of functionally graded plates. Compos Struct 119: 598-609. https://doi.org/10.1016/j.compstruct.2014.09.031 doi: 10.1016/j.compstruct.2014.09.031
|
| [19] |
Praveen GN, Reddy JN (1998) Nonlinear transient thermoelastic analysis of functionally graded ceramic-metal plates. Int J Solids Struct 35: 4457–4476. https://doi.org/10.1016/S0020-7683(97)00253-9 doi: 10.1016/S0020-7683(97)00253-9
|
| [20] |
Jin X, Wu LZ, Guo LC, et al. (2009) Prediction of the variation of elastic modulus in ZrO2/NiCr functionally graded materials. Compos Sci Technol 69: 1587–1591. https://doi.org/10.1016/j.compscitech.2009.02.032 doi: 10.1016/j.compscitech.2009.02.032
|
| [21] |
Shen HS, Wang ZX (2012) Assessment of voigt and Mori-Tanaka models for vibration analysis of functionally graded plates. Compos Struct 94: 2197–2208. https://doi.org/10.1016/j.compstruct.2012.02.018 doi: 10.1016/j.compstruct.2012.02.018
|
| [22] |
Zenkour AM, Alghamdi NA (2008) Thermoelastic bending analysis of functionally graded sandwich plates. J Mater Sci 43: 2574–2589. https://doi.org/10.1007/s10853-008-2476-6 doi: 10.1007/s10853-008-2476-6
|
Figures(4) / Tables(3)

Rebai Billel. Contribution to study the effect of (Reuss, LRVE, Tamura) models on the axial and shear stress of sandwich FGM plate (Ti–6A1–4V/ZrO2) subjected on linear and nonlinear thermal loads[J]. AIMS Materials Science, 2023, 10(1): 26-39. doi: 10.3934/matersci.2023002


 DownLoad: