Citation: Li Ding, Yubing Wu, Xuechao Liu, Fenfen Liu, Harry Mei. Application of Microbial Geochemical Exploration Technology in Identifying Hydrocarbon Potential of Stratigraphic Traps in Junggar Basin, China[J]. AIMS Geosciences, 2017, 3(4): 576-589. doi: 10.3934/geosci.2017.4.576
| [1] | O. A. Oluwadare, M.T. Olowokere, F. Taoili, P.A. Enikanselu, R.M. Abraham-Adejumo . Application of time-frequency decomposition and seismic attributes for stratigraphic interpretation of thin reservoirs in "Jude Field", Offshore Niger Delta. AIMS Geosciences, 2020, 6(3): 378-396. doi: 10.3934/geosci.2020021 |
| [2] | Yasir Bashir, Muhammad Afiq Aiman Bin Zahari, Abdullah Karaman, Doğa Doğan, Zeynep Döner, Ali Mohammadi, Syed Haroon Ali . Artificial intelligence and 3D subsurface interpretation for bright spot and channel detections. AIMS Geosciences, 2024, 10(4): 662-683. doi: 10.3934/geosci.2024034 |
| [3] | Palavai Venkateswara Rao, Mangalampalli Subrahmanyam, Bakuru Anandagajapathi Raju . Groundwater exploration in hard rock terrains of East Godavari district, Andhra Pradesh, India using AHP and WIO analyses together with geoelectrical surveys. AIMS Geosciences, 2021, 7(2): 244-267. doi: 10.3934/geosci.2021015 |
| [4] | Anthony I Nzekwu, Richardson M Abraham-A . Reservoir sands characterisation involving capacity prediction in NZ oil and gas field, offshore Niger Delta, Nigeria. AIMS Geosciences, 2022, 8(2): 159-174. doi: 10.3934/geosci.2022010 |
| [5] | Khalid Ahmad, Umair Ali, Khalid Farooq, Syed Kamran Hussain Shah, Muhammad Umar . Assessing the stability of the reservoir rim in moraine deposits for a mega RCC dam. AIMS Geosciences, 2024, 10(2): 290-311. doi: 10.3934/geosci.2024017 |
| [6] | Jianzhao Yin, Haoyu Yin, Yuhong Chao, Hongyun Shi . Energy and tellurium deposits. AIMS Geosciences, 2024, 10(1): 28-42. doi: 10.3934/geosci.2024002 |
| [7] | Paolo Dell’Aversana, Gianluca Gabbriellini, Alfonso Iunio Marini, Alfonso Amendola . Application of Musical Information Retrieval (MIR) Techniques to Seismic Facies Classification. Examples in Hydrocarbon Exploration. AIMS Geosciences, 2016, 2(4): 413-425. doi: 10.3934/geosci.2016.4.413 |
| [8] | Seyed Mohsen Mousavi, Ali Golkarian, Seyed Amir Naghibi, Bahareh Kalantar, Biswajeet Pradhan . GIS-based Groundwater Spring Potential Mapping Using Data Mining Boosted Regression Tree and Probabilistic Frequency Ratio Models in Iran. AIMS Geosciences, 2017, 3(1): 91-115. doi: 10.3934/geosci.2017.1.91 |
| [9] | Tofig R. Akhmedov . 3D seismic survey data processing and interpretation by use of latest tools applied for discovery of new traps in Pleistocene deposits of Hovsan field. AIMS Geosciences, 2021, 7(1): 95-112. doi: 10.3934/geosci.2021005 |
| [10] | Paolo Dell'Aversana . Reservoir geophysical monitoring supported by artificial general intelligence and Q-Learning for oil production optimization. AIMS Geosciences, 2024, 10(3): 641-661. doi: 10.3934/geosci.2024033 |
Exploration activities in the petroliferous Junggar basin can be traced back to 1950's and the basin still has an annual production of 13 million tons of oil equivalent as reported in year 2016. As most of structural exploration targets which can be identified by seismic drilled and produced, new stratigraphic traps with horizonal changes become new focus for O & G companies in the area [1]. The eastern slope of Fukang sag largely developed favorable lithological traps and was taken as one of the three most potential areas in subtle reservoir exploration of Junggar basin [2]. In the past years, a few commercial discoveries, such as well F4 and well F5, have been made in the middle-Jurassic Tutunhe formation with reservoir of fluvial channel sandstones in this area. Yet out of surprise, additional 2 wells targeting the same layer turned out to be dry wells. It indicates that these channel sandstones can be effectively identified by seismic work but still seem risky to drill without reliable prediction of the existence of hydrocarbons [3]. The lack of effective hydrocarbon detection technology to complement 2D/3D seismic has become one of the main reasons of low drilling success rate in this region.
As a fast, highly sensitive and cost-effective hydrocarbon detection technology, Microbial geochemical exploration technology, so-called MGCE, has drawn wide attention in recent years. This article will introduce the application of MGCE and integrated 4G exploration in lithologic reservoir exploration on the eastern slope of Fukang depression.
Developed in the 1950s, Microbial hydrocarbon detection technology could predict the presence and the distribution of underlying reservoir by detecting the abundance of the specific Hydrocarbon Oxidizing Bacteria (HOB) in surface soil or sea sediment that consume specific hydrocarbon as the sole carbon source (food).The technology is based on the geological principle known as hydrocarbon micro-seepage in which molecules of light hydrocarbon (C1-C5) in the reservoir can penetrate the cap rock and migrate upward vertically or near vertically into the surface area [4,5,6]. When these molecules reached the surface area, a specific type of microbes known as the Hydrocarbon Oxidizing Bacteria (HOB) in surface soil or sea bottom sediment intend to consume them as their sole food and hence abnormal growth of HOB populations can be measured. During the process, a small proportion of the leaking hydrocarbons can be absorbed by clay minerals or wrapped in alternative carbonates which can also be measured in a laboratory as a geochemical parameter known as Sorbed Soil Gas. With positive correlation with petroleum accumulation at depth, High microbial population and sorbed soil gas anomalies are proven to be reliable indicators [7,8].
Microbial Geo-Chemical Exploration (MGCE) technology consists of geo-microbial hydrocarbon detection (GMHD) technique and geochemical hydrocarbon detection (GCHD) technique. GMHD is mainly used to identify and delineate hydrocarbon accumulations (or "sweet spots"). GCHD or absorbed gas technology is mainly used to predict the geochemical properties of the reservoir in depth (oil, condensate or gas etc.). The two methods complement each other and form a complete system of microbial prospecting of oil and gas technology (MGCE) [9,10,11,12].
MGCE is a fast, highly sensitive and cost-effective hydrocarbon detection technology. There is a direct, positive correlation between hydrocarbon microseepage intensity and the microbial population. The technology provides the industry with an additional dimension of data to predict the existence of hydrocarbon and hence can be used as a supplemental tool to the traditional G & G based exploration. Proper integration of multi-disciplinary information in Geology, Geophysics, Geochemistry and Geomicrobiology, so-called 4G integrated studies, can significantly improve the accuracy and reliability of prospect identification and hydrocarbon detection in complex geological settings, and eventually improve the exploration efficiency, reduce cost and increase drilling success rate [13,14,15].
The work area located in the eastern part of the central depression of Junggar basin with Beisantai salient in the east and Fukang sag in the west (Figure 1).
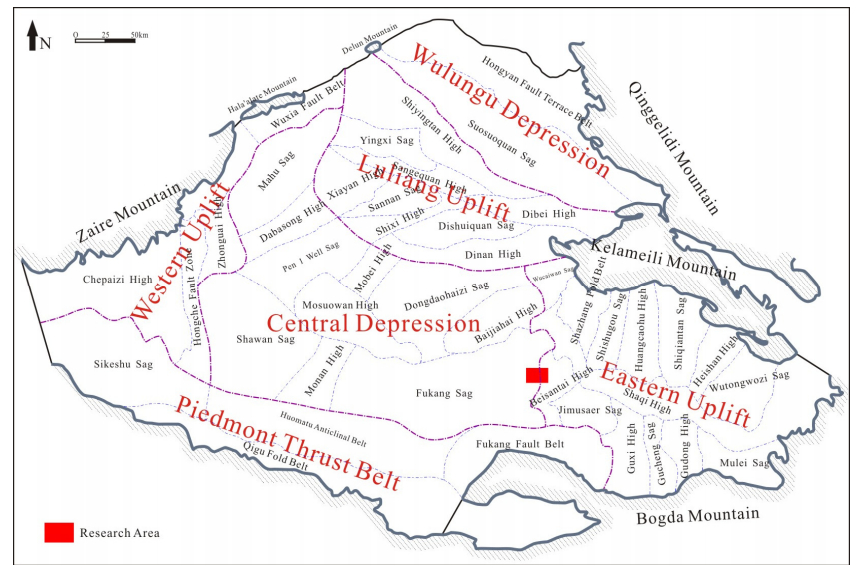 Figure 1. Tectonic units division of Junggar Basin (From Xinjiang oil filed company).
Beisantai salient is a continuous paleo high. It slowly began to uplift since the hercynian orogenic movement, then strongly uplifted during the scene Ⅰ, scene Ⅱ of the Yenshanian orogenic movement, and its structural movement is slowly abated until the cretaceous tectonic activity. As a result, a series of gradually pitching nostril structures were formed from the Beisantai salient to the west of Fukang sag [16].
The research area of 131 square kilometers is located on the western nose structure of Fukang eastern slope. The main exploration targets are channel sandstones of Jurassic Toutunhe group. The Toutunhe group is divided into three sections and the three sections thin out step by step from west to east due to tectonic uplift. The Paleogene strata in the high position of the Beisantai salient directly covered on the Xiaoquangou group of upper Triassic. The sedimentary facies of this area are delta front facies. A series of underwater distributary channels and mouth bar sandstone are widely distributed at the flanks and axis of the nose structure. The sandstones have the attributes of medium porosity, medium-low permeability, low dissolution, high displacement pressure, and high interconnection [17,18]. The area had good reservoir-seal assemblage and the reservoir has two sets of major source rocks in Permian and Jurassic formations. Two petroleum systems are either self-generation and self-storage or lower-generation and upper-storage. In addition, the normal fault of approximately east-west direction which is formed by tectonic movement contributes to the control the distribution of oil and gas [19,20].
In recent years, the Toutunhe group in Jurassic showed good exploration prospects with the successful drilling of Well FD 2 and FD 5. However, the appraisal wells FD 021 and FD 051, which were less than two kilometers away from those two discovery wells, turned out to be only water wells. It shows strong complexity of oil and water contact in this area. It made it difficult to decide the next drilling location. A MGCE survey was applied in the area with objectives to evaluate the hydrocarbon Potential of the traps and to high grade leads and prospects for drilling sites.
The lithologic traps, which are mainly of channel sand in this area, have the characteristics of small width and large closure. According to MGCE technical requirements, the even grid of 330 m by 330 m density was adopted, about 10 samples per square km (Figure 2).
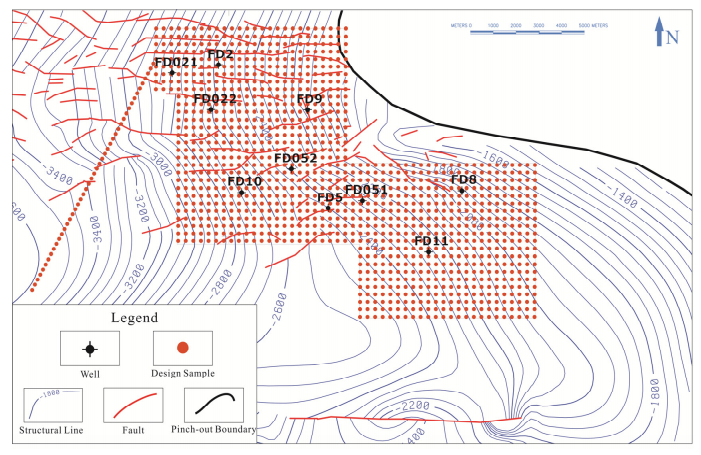 Figure 2. Map showing the distribution of MGCE sampling stations.
Handheld GPS was used to position each sample station with measuring accuracy within 5 meters. For each sample, a handful of surface soil (about 200g) was collected at approximately 20 cm depth. A total of 1351 soil samples was collected for microbial and sorbed soil gas analysis. In the survey area, soil samples were mainly clay and loam with a small amount of sandy loam and sandy soil.
GMHD and GCHD analysis are both completed by the analysis and testing center of AE & E. The method of plate culture was adopted for GMHD, the procedures include: weigh samples with electronic balance (cerlords dolly, BSA22S, China), dilute and inoculate weighed samples, and then cultivate samples in biochemical incubator (Boxun, SPX 250 BZ, China) with constant temperature and finally count the colonies to get microbial values [21,22].
270 samples with high microbial values were selected to conduct GCHD analysis. Weigh 50g of soil samples into a sealed glass bottle, evacuated to about -0.1MPa in a 40℃ water bath, then exposed to 1:5 hydrochloric acid (V/V) and decomposed. The gases released from the samples were absorbed by 300g/L potassium hydroxide solution to remove CO2, and then the light hydrocarbon components (C1-C5) of the desorbed gases were measured using a 7890A gas chromatography (Agilent Technologies, U.S.) which was equipped with a flame ionization detector. The scrubbed, liberated gases are collected and analyzed by flame ionization detector (FID) gas chromatography to determine light hydrocarbon concentrations in unit of parts per million (ppm) [23,24].
Microbial Value (MV) is a key index of MGCE technique. The absolute value reflects the microseepage intensity of the underlying active oil and gas system, which is the important quantitative indicator in discriminating the existence and distribution of the reservoirs. (Figure 3). During the procedure of data analysis, it is key to distinguish MV anomalies and background values for evaluation of favorable hydrocarbon prospects in the area of interest. In general, the MV threshold value is first calculated by mathematical statistics methods and a frequency histogram, and then integrated with analog wells calibration and a global database. Based on the above method, the calculated MV threshold value of 1351 is reasonable for the area of interest (Table 1). i.e. the value of the MV number above 30 is the abnormal value, which represents high microseepage, the MV values below 30 are low and the background value, which represent none or low microseepgae content (Table 1).
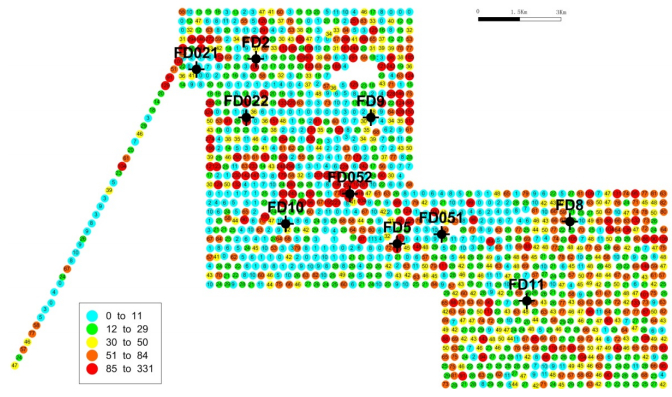 Figure 3. Microbial value(MV)distribution map.
| MGCE Survey | MV | |
| All data | 1351 | |
| All data:Maximum / Minimum | 331/0 | |
| All data: Average/Standard Deviation | 43/52 | |
| Background data: Average/Standard Deviation | 15/12 | |
| Microbial middle abnormal(threshold) | 30 | |
| Microbial abnormal Classification | Red (ultra-high abnormal) | 85-331 |
| Orange (high abnormal) | 51-84 | |
| Yellow (middle abnormal) | 30-50 | |
| Green (low abnormal) | 12-29 | |
| Blue(background) | 0-11 | |
 DownLoad: CSV
The MV distribution map is the primary map to interpret MGCE results. The "Warm" colors (yellow, orange and red) represent stable microbial anomalies. If the orange and red colors distributed in clustered pattern and surrounded with yellow (medium anomaly) and green (low anomaly) colors, it would represent high microseepage intensity and therefore high oil and gas potential, whereas "cold" colors (blue and green) distributed in cluster pattern, it would indicate the area with non-oil and gas accumulation.
The MGCE results of the eastern slope of Fukang sag show that the MV anomaly zones distributed in strip and continuous pattern, separating themselves distinctly from low and background areas. This indicates the study area consists of oil and gas accumulation region and non-accumulation region. Based on the microbial anomalies distribution, the study area can be divided into three favorable zones (Figure 4).
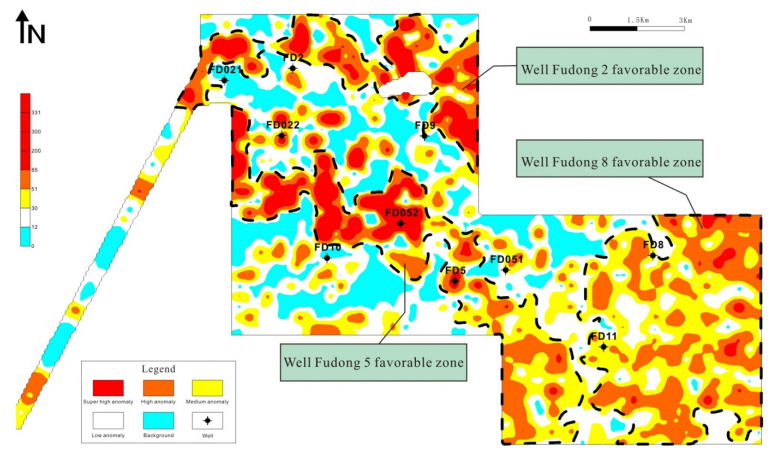 Figure 4. The map showing the delineation of MGCE favorable zones.
GCHD analysis is an important qualitative technique to complement microbial technique. It measures the anomaly of sorbed soil gas that are absorbed in clay minerals or wrapped in derivative carbonate cements, analyzes the ratio of light hydrocarbon composition and forecasts the type of reservoir at depths, namely oil, gas or condensate reservoirs. The sampling depth is 20cm, which is different from the 1m depth of conventional surface geochemical exploration. The latter mainly acts as a quantitative method and analyzes the hydrocarbon concentration in soil samples. Whereas the former besides the research on the hydrocarbon component concentration, focuses more on the characteristic of composition ratio, it is a qualitative method and use C1/(C2 + C3) - C2/(C3 + C4) cross plot to identify the geochemical properties of reservoir underneath microbial anomaly zones [24,25].
Mathematic statistics of 270 GCHD data show that e.g. the average of methane (C1) concentration is 105.5 ppm with a maximum of 625.2ppm and minimum of 50.7ppm; other ethane (C2), propane (C3) and butane (C4sum) concentrations can be read from Table 2 below.
| Items | C1 | C2 | C3 | C4 SUM | C1/(C2+ C3) | C2/(C3+ C4) |
| Average | 105.5 | 10.6 | 4.2 | 2.7 | 6.5 | 1.6 |
| Standard Deviation | 50.7 | 5.1 | 2.1 | 1.4 | 2.5 | 0.2 |
| Minimum value | 5.8 | 0.4 | 0.2 | 0 | 4.1 | 1.0 |
| Maximum value | 625.2 | 40.2 | 16.1 | 9.3 | 42.0 | 2.9 |
DownLoad: CSVThe results showed that most of the samples located in the area of oil, while a small number of samples were in the range of condensate (Figure 5), which reveals that the properties of reservoirs in the study area are oil and condensate. This conclusion is consistent with the drilling result, such as Well FD5, indicating that MGCE could correctly and reliably identify the geochemical property of reservoir.
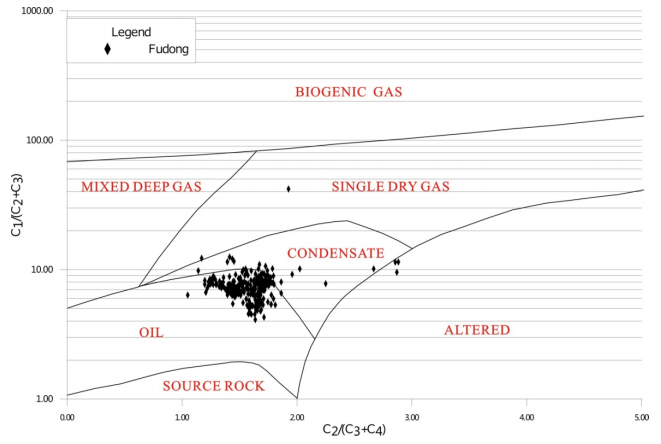 Figure 5. C1/(C2+ C3)
-C2/(C3+ C4) plot in the eastern slope of Fukang depression.
Figure 5. C1/(C2+ C3)
-C2/(C3+ C4) plot in the eastern slope of Fukang depression.Well FD5 favorable zone of 40 km2 shows high microbial anomaly intensity. Based on its anomaly intensity and distribution characteristics, it is the most favorable one of these 3 favorable zones. The lithologic trap drilled by Well FD 5 is the Toutunhe Formation 2nd section which is located in the south of the nose uplift in Eastern Fukang Slope. Series of small fractures in east-west direction are developed in the trap and the surrounding lithologic pinch out lines are acting as its' boundary lines. The thickness of the sand body is around 15 to 40m, thinner in the southwest direction and thicker in the northeast direction. The thickest sand body distributes in FD5-FD052 well zone. Directly above the subsurface trap, it is a clustered and continuous microbial anomaly area with majority of sample stations in high or super high anomaly level, indicating this area has strong hydrocarbon microseepage and good hydrocarbon potential.
Well FD052 was drilled after the submission of MGCE results, and it found the same sand body as Well FD5 did in Toutunhe formation. Commercial discoveries of high volumes were obtained after testing two layers of Toutunhe formation. This discovery was awarded the first prize for exploration achievement in China National Petroleum Company (CNPC) that year. The success also validated the reliability of MGCE results.
Well FD10, spud before MGCE survey, had good oil and gas shows, however MGCE result shows it is located at the edge of microbial anomaly area and covered mainly by low microbial values, indicating poor hydrocarbon potential. The drilling result came out after MGCE survey and confirmed it to be a dry hole, which matched very well with the MGCE prediction.
Well FD2 favorable zone is of 25 km2. Its anomaly distribution is rather scattered, the areal extent is smaller and the anomaly intensity is lower than those of Well FD 5 favorable zone. It can be observed that the microbial anomaly intensified from west to east, and the most favorable area located on structural high, towards the east of Well FD9 which is ready to be spud. The high anomalies appear to distribute in a continuous and clustered pattern, indicating rather high hydrocarbon microseepage intensity.
Well FD9 was drilled in the microbial anomaly to background transitional zone of Well FD2 favorable zone. Its hydrocarbon microseepage intensity is much lower than that of Well FD5 and FD052. MGCE results forecast that Well FD9 may have discoveries of limited scale and the best drilling target is located in the eastern side of the pre-determined well site. Later Well FD9 was drilled and had good oil and gas shows. It produced1.2 m3 oil after fracturing and testing Toutunhe formation, this drilling result agrees well with the MGCE prediction.
Well FD8 favorable zone of 30km2 is located in the structure high of a nostril uplift. The Toutunhe formation and Qigu formation pinched out in this area due to the influence of tectonic uplift. There are two existing wells in this area, well FD8 produced oil 6m3/day in Toutunhe formation, while well FD11 has good oil and gas shows in Toutunhe formation. High microbial anomaly distributes right above the existing wells and structural high, and appears to be within the areal extent of the identified trap, indicating very good hydrocarbon potential.
The microbial anomaly zone to the northeast of Well FD8 is a potential target in this area. This area is covered by continuous and clustered microbial anomalies, distributing from the east of well FD8 to the structure high along the structural slope and indicating strong hydrocarbon microseepage.
There was no well drilled in the stable anomaly zone which is to the east of Well FD8. When overlapping microbial data with seismic profile (Figure 6), no target can be found in the prime reservoirs which were focused by the oil company, namely the Middle Jurassic Toutunhe formation. However, a strong amplitude anomaly can be identified in Late Jurassic Qigu Formation, which has similar characteristics with that of well FD5. This amplitude pinched out to the Cretaceous unconformity surface in the updip direction. As a conclusion of the integrated study, this area may develop lithologic-stratigraphic trap with the area of 10 square km.
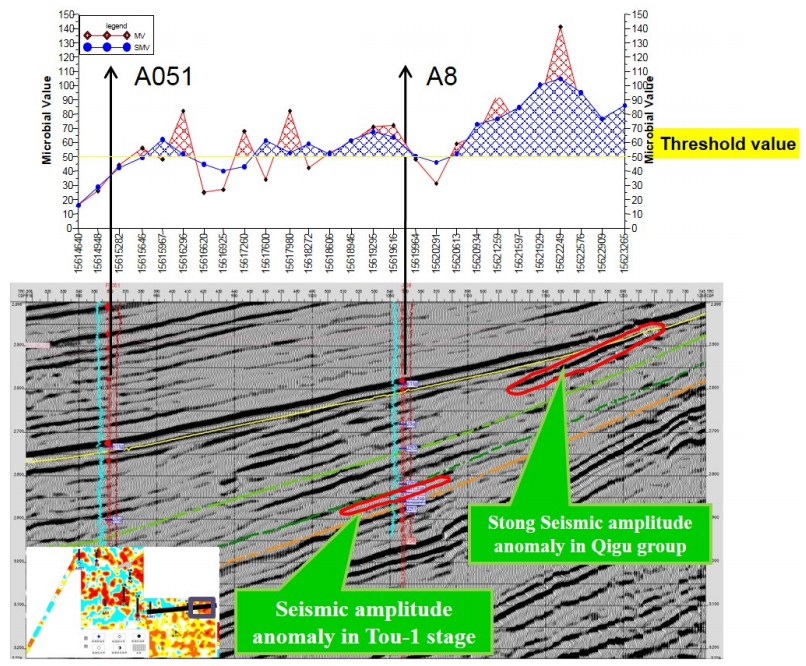 Figure 6. The integration of MGCE with seismic data results in new discoveries and new exploration target – Late Jurassic, Qigu Group channel sandstone.
This target was under-evaluated for two reasons. First of all, it is adjacent to Cretaceous regional unconformity surface, with sandstone and conglomerate developed in the bottom of Cretaceous Tugulu group. Previous study couldn't confirm whether the sealing condition is sufficient. Secondly, the sedimentary characteristics of Qigu group is similar with that of the Toutunhe group: underwater channel sand body of delta front sub-facies were well developed in Qigu formation which indicate a good reservoir condition, but in the same time its low resistance characteristics made it difficult to separate oil from water layer. As a result, no exploration breakthrough had been made in Qigu formation.
However, MGCE results showed that an obvious and stable anomaly zone was present to the east of Well FD8, which had a well corresponding relationship with the seismic anomaly body in Qigu formation, indicating that the oil and gas accumulation existed in the stratigraphic system. The Tugulu group formation in Cretaceous is the regional cap rock of Junggar basin, according to the statistic analysis of nearby dozens of wells in Beisantai salient, the Cretaceous bottom layer in this region is of basal conglomerates, its physical properties were poor, mostly dry layer, and therefore is considered to have fair sealing effect.
At last, based on the results of "4G" integrated studies, Well FD16 was designed and drilled to the targeted anomaly located in Qigu group. The well was tested by 3.5mm choke between well section 2022-2039m, and the natural oil flow of 17.25m3 per day was blew out from Qigu formation. This is a breakthrough discovery on Qigu lithologic reservoir in the whole region. The application of new technology provided new exploration model and opened up new exploration arena for explorationists.
Based on this result, some previous wells which have microbial anomalies on the surface were analyzed again. It was found that well FD022 failed in the lay of Toutunhe, but had oil and gas shows in Qigu formation. Further test of the layer of Qigu formation encountered an oil flow of 25.99m3 and gas flow of 7,6000 m3 per day. It once again confirmed that Qigu formation of Jurassic had good exploration potential.
From the application of Microbial Geochemical Exploration method in lithologic trap exploration in Junggar Basin, the following conclusions could be made:
Microbial hydrocarbon detection result indicates that the study area has good oil and gas potential, the geochemical nature of the reservoir is mainly of oil and condensate, which matches well with the drilling results, showing that MGCE technology can evaluate lithologic trap hydrocarbon potential and predict the properties of the reservoir, confirmed that the MGCE technology is applicable and effective in the exploration of the eastern slope of Fukang sag.
Microbial hydrocarbon detection results identify three favorable zones respectively around Well FD5, Well FD2 and WellFD8, and the oil and gas potential of post-MGCE survey wells of FD052, FD9 and FD10 were forecasted successfully, MGCE results provide scientific basis for next step exploration.
By applying the "4G" integrated studies which integrated information from geology, geophysics, geochemistry and geobiology, Well FD16 is successfully drilled and a breakthrough discovery on Qigu lithologic reservoir has been achieved. "4G" integrated studies provide a new model to the oil and gas exploration in Junggar basin, which is expected to become effective new approach to complex reservoir exploration.
This work was supported by PetroChina Xinjiang Oilfield Company.
All authors declared that, there is no conflict of interest in this paper.
| [1] | Jun Jin, Loujun Liu, Yu Shao, et al. (2002) Identification of lithologic traps in Junggar basin by comprehensive geophysical method. Oil Geophys Prospect 37: 287-290. |
| [2] | Mai Chang, Zhen Liu, Quansheng Liang, et al. (2007) Forming conditions and main controlling factors of the Middle-Upper Jurassic lithologic traps on East Fukang Slope, Junggar basin. Journal of Xi'an Shiyou University(Natural Science Edition) 22: 20-23. |
| [3] | Qin Zhang, Guiwen Wang, Xiaomin Zhu (2001) Well Logging Sedimentary facies of the Jurassic in east fukang slope of junggar basin. J Palaeogeogr 3: 41-47 |
| [4] | Saunders DF, Buraon KR, Thompson CK (1999) Model for hydrocarbon microseepage and related near-surface alterations. AAPG Bull 83: 1702185. |
| [5] | Brown A (2000) Evaluation of possible gas microseepage mechanisms. AAPG Bull 84: 177521789. |
| [6] |
Abrams MA (2005) Significance of hydrocarbon seepage relative to petroleum generation and entrapment. Mar Pet Geol 22: 457-477. doi: 10.1016/j.marpetgeo.2004.08.003

|
| [7] | Hai Mei, Renzi Lin, Bowen Mei, et al. (2008) Microbial Oil gas Detection Technologies: Theory, Practice and Application Prospect. Nat Gas Geosci 19: 888-893. |
| [8] | Renzi Lin, Hai Mei, Bowen Mei (2009) The application and prospects of Microbial Exploration technology. Mar Geol Lett 25: 36-42. |
| [9] | Chunlin Zhang, Xiongqi Pang, Hai Mei, et al. (2010)Application and Progress of Microbial Oil Survey Technique (MOST). Xinjiang Pet Geol 31: 310-315. |
| [10] | Mei BW, Wu M, Sun ZJ, et al. (2011) Microbial geochemical (MGCE) detection test of natural gas hydrate in permafrost of Muli area, Tianjun County, Qinghai Province. Geol Bull China 30: 1891-1895. |
| [11] |
Chao Peng, Hongchen Jiang, Liuqin Huang, et al. (2013) Abundance and Diversity of Ammonia-Oxidizing Bacteria and Archaea in Cold Springs on the Qinghai-Tibet Plateau. Geomicrobiol J 30: 530-539. doi: 10.1080/01490451.2012.737089
|
| [12] | Chunlin Zhang, Xiongqi Pang, Hai Mei, et al. (2010) Application and progress of microbial oil survey technique(MOST). Xinjiang Pet Geol 31: 320-322. |
| [13] | Chenzhi Yan, Hesheng Shi, et al. (2014) Applying a technique of microbiological geochemistry to hydrocarbon exploration in Baiyun sag deep water area. China Offshore Oil Gas 26:15-19. |
| [14] | Lijuan He (2015)Applying Microbial Geochemical Exploration Technology for hydrocarbon detection of Lingshui Sag in Deepwater area of Qiongdongnan Basin. China Offshore Oil Gas 27: 61-67 |
| [15] | Chun Hao (2015) Microbial Geochemical Exploration Technology and Prospect for Its Application in South China Sea Deepwater Exploration. China Pet Explor 20: 55-62. |
| [16] | Lu B, Zhang J, Li T, et al. (2008) Analysis of tectonic framework in Junggar Basin. Xinjiang Pet Geol 29: 283-289. |
| [17] | Yu Jingwei, Li Lulu, Qi Liqi, et al. (2014) Reservoir controlling factors of Toutunhe No.2 member in Fudong slope zone in eastern Junggar basin. Xinjiang Pet Geol 35: 34-38. |
| [18] | Yu Jingwei, Ren Wei, Wang Wuxue, et al. (2015) Formation Mechanism of Toutunhe Abnormal Pressure of Middle Jurassic in Fudong Slope Area, Junggar Basin. Xinjiang Pet Geol 36: 521-525 |
| [19] | Shang L, Dai JS, Liu X, et al. (2011) Sedimentary source analysis of Jurassic Toutunhe Formation in Beisantai area in Junggar Basin. Global Geol 30: 579-584. |
| [20] | Zhu XM, zhang YN, Yang JS, et al. (2008) Sedimentary characteristics of the shallow Jurassic braided revier delta, the Junggar Basin. Oil Gas Geol 29: 244-251. |
| [21] | Debnam AH (1969) Geochemical prospecting for petroleum and natural gas in Canada. Geol Surv Can Bull 177. |
| [22] | Tedesco SA (1995) Surface Geochemistry in Petroleum Exploration. J Geochem Explor 1: 43-44. |
| [23] |
Sun Zhongjun, Yang Zhibin, Mei Hai, et al. (2014). Geochemical characteristics of shallow soil above the Muli gas hydrate reservoir in the permafrost region of Geochemical Exploration. J Geochem Explor 139: 160-169. doi: 10.1016/j.gexplo.2013.10.006
|
| [24] | Chun Hao (2015) Microbial Geochemical Exploration and Research on Gas Hydrate in Sanlutian of Muli, Qinghai Province. Geosci 29: 1157-1163. |
| [25] | Jones VT, Drond RJ (1983) Predications of oil or gas potential by near surface geochemistry. AAPG Bull 67: 932-952. |
| 1. | Kewei Xu, Zhengfei Yan, Cheng Tao, Fang Wang, Xuying Zheng, Yuanyuan Ma, Yongge Sun, Yan Zheng, Zhongjun Jia, A novel bioprospecting strategy via 13C-based high-throughput probing of active methylotrophs inhabiting oil reservoir surface soil, 2024, 924, 00489697, 171686, 10.1016/j.scitotenv.2024.171686 |


Figures(6) / Tables(2)

Li Ding, Yubing Wu, Xuechao Liu, Fenfen Liu, Harry Mei. Application of Microbial Geochemical Exploration Technology in Identifying Hydrocarbon Potential of Stratigraphic Traps in Junggar Basin, China[J]. AIMS Geosciences, 2017, 3(4): 576-589. doi: 10.3934/geosci.2017.4.576

| MGCE Survey | MV | |
| All data | 1351 | |
| All data:Maximum / Minimum | 331/0 | |
| All data: Average/Standard Deviation | 43/52 | |
| Background data: Average/Standard Deviation | 15/12 | |
| Microbial middle abnormal(threshold) | 30 | |
| Microbial abnormal Classification | Red (ultra-high abnormal) | 85-331 |
| Orange (high abnormal) | 51-84 | |
| Yellow (middle abnormal) | 30-50 | |
| Green (low abnormal) | 12-29 | |
| Blue(background) | 0-11 | |
DownLoad: CSV| Items | C1 | C2 | C3 | C4 SUM | C1/(C2+ C3) | C2/(C3+ C4) |
| Average | 105.5 | 10.6 | 4.2 | 2.7 | 6.5 | 1.6 |
| Standard Deviation | 50.7 | 5.1 | 2.1 | 1.4 | 2.5 | 0.2 |
| Minimum value | 5.8 | 0.4 | 0.2 | 0 | 4.1 | 1.0 |
| Maximum value | 625.2 | 40.2 | 16.1 | 9.3 | 42.0 | 2.9 |
DownLoad: CSV| MGCE Survey | MV | |
| All data | 1351 | |
| All data:Maximum / Minimum | 331/0 | |
| All data: Average/Standard Deviation | 43/52 | |
| Background data: Average/Standard Deviation | 15/12 | |
| Microbial middle abnormal(threshold) | 30 | |
| Microbial abnormal Classification | Red (ultra-high abnormal) | 85-331 |
| Orange (high abnormal) | 51-84 | |
| Yellow (middle abnormal) | 30-50 | |
| Green (low abnormal) | 12-29 | |
| Blue(background) | 0-11 | |
| Items | C1 | C2 | C3 | C4 SUM | C1/(C2+ C3) | C2/(C3+ C4) |
| Average | 105.5 | 10.6 | 4.2 | 2.7 | 6.5 | 1.6 |
| Standard Deviation | 50.7 | 5.1 | 2.1 | 1.4 | 2.5 | 0.2 |
| Minimum value | 5.8 | 0.4 | 0.2 | 0 | 4.1 | 1.0 |
| Maximum value | 625.2 | 40.2 | 16.1 | 9.3 | 42.0 | 2.9 |


