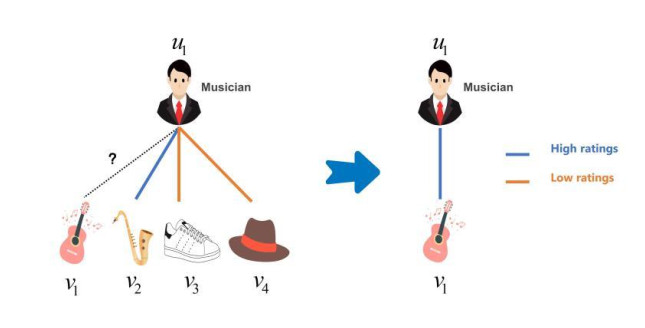
Collaborative filtering is one of the most widely used methods in recommender systems. In recent years, Graph Neural Networks (GNN) were naturally applied to collaborative filtering methods to model users' preference representation. However, empirical research has ignored the effects of different items on user representation, which prevented them from capturing fine-grained users' preferences. Besides, due to the problem of data sparsity in collaborative filtering, most GNN-based models conduct a large number of graph convolution operations in the user-item graph, resulting in an over-smoothing effect. To tackle these problems, Adaptive Preference Retention Graph Convolutional Collaborative Filtering Method (APR-GCCF) was proposed to distinguish the difference among the items and capture the fine-grained users' preferences. Specifically, the graph convolutional method was applied to model the high-order relationship on the user-item graph and an adaptive preference retention mechanism was used to capture the difference between items adaptively. To obtain a unified users' preferences representation and alleviate the over-smoothing effect, we employed a residual preference prediction mechanism to concatenate the representation of users' preferences generated by each layer of the graph neural network. Extensive experiments were conducted based on three real datasets and the experimental results demonstrate the effectiveness of the model.
Citation: Bingjie Zhang, Junchao Yu, Zhe Kang, Tianyu Wei, Xiaoyu Liu, Suhua Wang. An adaptive preference retention collaborative filtering algorithm based on graph convolutional method[J]. Electronic Research Archive, 2023, 31(2): 793-811. doi: 10.3934/era.2023040
Collaborative filtering is one of the most widely used methods in recommender systems. In recent years, Graph Neural Networks (GNN) were naturally applied to collaborative filtering methods to model users' preference representation. However, empirical research has ignored the effects of different items on user representation, which prevented them from capturing fine-grained users' preferences. Besides, due to the problem of data sparsity in collaborative filtering, most GNN-based models conduct a large number of graph convolution operations in the user-item graph, resulting in an over-smoothing effect. To tackle these problems, Adaptive Preference Retention Graph Convolutional Collaborative Filtering Method (APR-GCCF) was proposed to distinguish the difference among the items and capture the fine-grained users' preferences. Specifically, the graph convolutional method was applied to model the high-order relationship on the user-item graph and an adaptive preference retention mechanism was used to capture the difference between items adaptively. To obtain a unified users' preferences representation and alleviate the over-smoothing effect, we employed a residual preference prediction mechanism to concatenate the representation of users' preferences generated by each layer of the graph neural network. Extensive experiments were conducted based on three real datasets and the experimental results demonstrate the effectiveness of the model.

| [1] |
S. Milano, M. Taddeo, L. Floridi, Ethical aspects of multi-stakeholder recommendation systems, Inf. Soc., 37 (2021), 35-45. https://doi.org/10.1080/01972243.2020.1832636 doi: 10.1080/01972243.2020.1832636

|
| [2] |
H. Tang, G. Zhao, X. Bu, X. Qian, Dynamic evolution of multi-graph based collaborative filtering for recommendation systems, Knowledge-Based Syst., 228 (2021), 107251. https://doi.org/10.1016/j.knosys.2021.107251 doi: 10.1016/j.knosys.2021.107251
|
| [3] |
Y. Koren, R. Bell, C. Volinsky, Matrix factorization techniques for recommender systems, Computer, 42 (2009), 30-37. https://doi.org/10.1109/MC.2009.263 doi: 10.1109/MC.2009.263
|
| [4] | G. Datta, P. A. Beerel, Can deep neural networks be converted to ultra low-latency spiking neural networks, in 2022 Design, Automation & Test in Europe Conference & Exhibition (DATE), 2021. https://doi.org/10.23919/DATE54114.2022.9774704 |
| [5] | C. Gao, X. Wang, X. He, Y. Li, Graph neural networks for recommender system, in Proceedings of the Fifteenth ACM International Conference on Web Search and Data Mining, (2022), 1623-1625. https://doi.org/10.1145/3488560.3501396 |
| [6] | S. Jang, H. Lee, S. Cho, S. Woo, S. Lee, Ghost graph convolutional network for skeleton-based action recognition, in 2021 IEEE International Conference on Consumer Electronics-Asia (ICCE-Asia), 2021. https://doi.org/10.1109/ICCE-Asia53811.2021.9641919 |
| [7] | J. Xu, L. Chen, M. Lv, C. Zhan, S. Chen, J. Chang, HighAir: a hierarchical graph neural network-based air quality forecasting method, preprint, arXiv: 2101.04264. 86. |
| [8] | V. Kalofolias, X. Bresson, M. Bronstein, P. Vandergheynst, Matrix completion on graphs, preprint, arXiv: 14081717. |
| [9] | X. He, L. Liao, H. Zhang, L. Nie, X. Hu, T. Chua, Neural collaborative filtering, in Proceedings of the 26th International Conference on World Wide Web, (2017), 173-182. https://doi.org/10.1145/3038912.3052569 |
| [10] | X. Wei, J. Liu, Effects of nonlinear functions on knowledge graph convolutional networks for recommender systems with yelp knowledge graph, Lamar University, Beaumont, (2021), 185-199. https://doi.org/10.5121/csit.2021.110715 |
| [11] |
W. Li, L. Ni, J. Wang, C. Wang, Collaborative representation learning for nodes and relations via heterogeneous graph neural network, Knowledge-Based Syst., 255 (2022), 109673. https://doi.org/10.1016/j.knosys.2022.109673 doi: 10.1016/j.knosys.2022.109673
|
| [12] | C. Huang, Recent advances in heterogeneous relation learning for recommendation, preprint, arXiv: 211003455. |
| [13] | H. B. Kang, R. Kocielnik, A. Head, J. Yang, M. Latzke, A. Kittur, et al., From who you know to what you read: augmenting scientific recommendations with implicit social networks, in Proceedings of the 2022 CHI Conference on Human Factors in Computing Systems, (2022), 1-23. https://doi.org/10.1145/3491102.3517470 |
| [14] | T. N. Kipf, M. Welling, Semi-supervised classification with graph convolutional networks, preprint, arXiv: 1609.02907. |
| [15] | X. He, K. Deng, X. Wang, Y. Li, Y. Zhang, M. Wang, Lightgcn: simplifying and powering graph convolution network for recommendation, in Proceedings of the 43rd International ACM SIGIR Conference on Research and Development in Information Retrieval, (2020), 639-648. https://doi.org/10.1145/3397271.3401063 |
| [16] | B. Jin, C. Gao, X. He, D. Lin, Y. Li, Multi-behavior recommendation with graph convolutional networks, in Proceedings of the 43rd International ACM SIGIR Conference on Research and Development in Information Retrieval, (2020), 659-668. https://doi.org/10.1145/3397271.3401072 |
| [17] |
L. Ma, Y. Li, J. Li, W. Tan, Y. Yu, M. A. Chapman, Multi-scale point-wise convolutional neural networks for 3D object segmentation from LiDAR point clouds in large-scale environments, IEEE Trans. Intell. Transp. Syst., 22 (2019), 821-836. https://doi.org/10.1109/TITS.2019.2961060 doi: 10.1109/TITS.2019.2961060
|
| [18] | X. Wang, H. Jin, A. Zhang, X. He, T. Xu, T. Chua, Disentangled graph collaborative filtering, in Proceedings of the 43rd International ACM SIGIR Conference on Research and Development in Information Retrieval, (2020), 1001-1010. https://doi.org/10.1145/3397271.3401137 |
| [19] | Y. Zheng, C. Gao, L. Chen, D. Jin, Y. Li, DGCN: diversified recommendation with graph convolutional networks, in Proceedings of the Web Conference, (2021), 401-412. https://doi.org/10.1145/3442381.3449835 |
| [20] | R. Raziperchikolaei, Y. J. Chung, Simultaneous learning of the inputs and parameters in neural collaborative filtering, preprint, arXiv: 2203.07463. |
| [21] |
R. Yin, K. Li, G. Zhang, J. Lu, A deeper graph neural network for recommender systems. Knowledge-Based Syst., 185 (2019), 105020. https://doi.org/10.1016/j.knosys.2019.105020 doi: 10.1016/j.knosys.2019.105020
|
| [22] | R. R. Salakhutdinov, A. Mnih, Probabilistic matrix factorization, in Proceedings of the 20th International Conference on Neural Information Processing Systems, (2007), 1257-1264. |
| [23] | Y. Koren, Factorization meets the neighborhood: a multifaceted collaborative filtering model, in Proceedings of the 14th ACM SIGKDD International Conference on Knowledge Discovery and Data Mining, (2008), 426-434. https://doi.org/10.1145/1401890.1401944 |
| [24] |
J. Wei, J. He, K. Chen, Y. Zhou, Z. Tang, Collaborative filtering and deep learning based recommendation system for cold start items, Expert Syst. Appl., 69 (2017), 29-39. https://doi.org/10.1016/j.eswa.2016.09.040 doi: 10.1016/j.eswa.2016.09.040
|
| [25] | S. Sedhain, A. K. Menon, S. Sanner, L. Xie, Autorec: autoencoders meet collaborative filtering, in Proceedings of the 24th International Conference on World Wide Web, (2015), 111-112. https://doi.org/10.1145/2740908.2742726 |
| [26] | X. Wang, X. He, M. Wang, F. Feng, T. Chua, Neural graph collaborative filtering, in Proceedings of the 42nd International ACM SIGIR Conference on Research and Development in Information Retrieval, (2019), 165-174. https://doi.org/10.1145/3331184.3331267 |
| [27] | L. Chen, L. Wu, R. Hong, K. Zhang, M. Wang, Revisiting graph based collaborative filtering: a linear residual graph convolutional network approach, in Proceedings of the AAAI Conference on Artificial Intelligence, 34 (2020), 27-34. https://doi.org/10.1609/aaai.v34i01.5330 |
| [28] | X. Wang, R. Wang, C. Shi, G. Song, Q. Li, Multi-component graph convolutional collaborative filtering, in Proceedings of the AAAI Conference on Artificial Intelligence, 34 (2020), 6267-6274. https://doi.org/10.1609/aaai.v34i04.6094 |
| [29] |
C. Zhang, W. Li, D. Wei, Y. Liu, Z. Li, Network dynamic GCN influence maximization algorithm with leader fake labeling mechanism, IEEE Trans. Comput. Social Syst., 2022 (2022), 1-9. https://doi.org/10.1109/TCSS.2022.3193583 doi: 10.1109/TCSS.2022.3193583
|
| [30] |
F. Scarselli, M. Gori, A. C. Tsoi, M. Hagenbuchner, G. Monfardini, The graph neural network model, IEEE Trans. Neural Networks, 20 (2008), 61-80. https://doi.org/10.1109/TNN.2008.2005605 doi: 10.1109/TNN.2008.2005605
|
| [31] | M. Gori, G. Monfardini, F. Scarselli, A new model for learning in graph domains, in 2005 IEEE International Joint Conference on Neural Networks, (2005), 729-734. https://doi.org/10.1109/IJCNN.2005.1555942 |
| [32] | W. Hamilton, Z. Ying, J. Leskovec, Inductive representation learning on large graphs, in Proceedings of the 31st International Conference on Neural Information Processing Systems, (2017), 1025-1035. |
| [33] | P. Velikovi, G. Cucurull, A. Casanova, A. Romero, P. Liò, Y. Bengio, Graph attention networks, preprint, arXiv: 1710.10903. |
| [34] | A. Vaswani, N. Shazeer, N. Parmar, J. Uszkoreit, L. Jones, A. N. Gomez, et al., Attention is all you need, in 31st Conference on Neural Information Processing Systems (NIPS 2017), 2017. Available from: https://papers.nips.cc/paper/2017/file/3f5ee243547dee91fbd053c1c4a845aa-Paper.pdf. |
| [35] | K. Xu, W. Hu, J. Leskovec, S. Jegelka, How powerful are graph neural networks, preprint, arXiv: 181000826. |
| [36] | X. Wang, H. Ji, C. Shi, B. Wang, Y. Ye, P. Cui, et al., Heterogeneous graph attention network, in The World Wide Web Conference, (2019), 2022-2032. https://doi.org/10.1145/3308558.3313562 |
| [37] | F. Wu, T. Zhang, A. H. de Souza, C. Fifty, T. Yu, K. Q. Weinberger, Simplifying graph convolutional networks, 2019 (2019), 6861-6871. https://doi.org/10.48550/arXiv.1902.07153 |
| [38] | M. Liu, H. Gao, S. Ji, Towards deeper graph neural networks, in Proceedings of the 26th ACM SIGKDD International Conference on Knowledge Discovery & Data Mining, (2020), 338-348. https://doi.org/10.1145/3394486.3403076 |
| [39] | C. Louizos, M. Welling, D. P. Kingma, Learning sparse neural networks through $L_0$ regularization, preprint, arXiv: 171201312. |


Figures(7) / Tables(3)
Bingjie Zhang, Junchao Yu, Zhe Kang, Tianyu Wei, Xiaoyu Liu, Suhua Wang. An adaptive preference retention collaborative filtering algorithm based on graph convolutional method[J]. Electronic Research Archive, 2023, 31(2): 793-811. doi: 10.3934/era.2023040


 DownLoad: