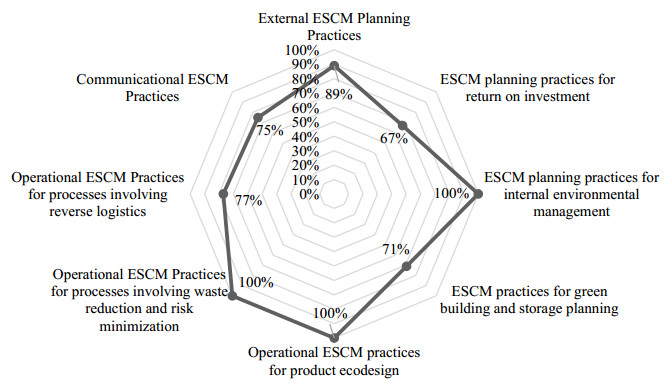
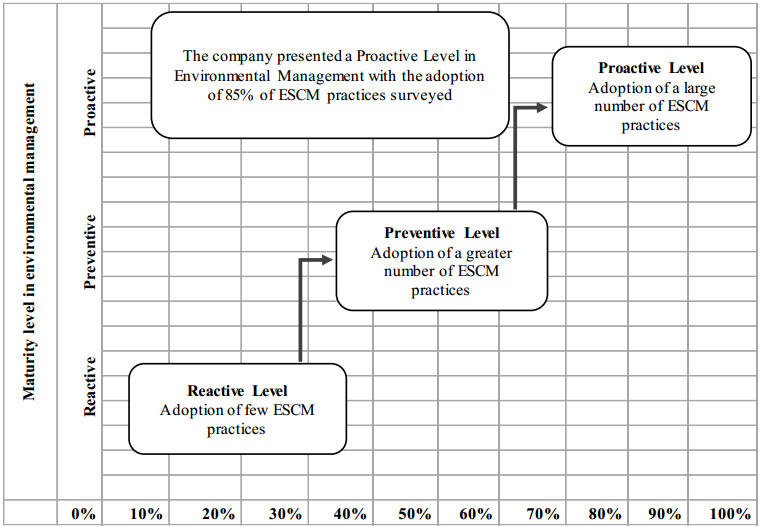
1.
Introduction
The paradigm of smart cities aims at increasing resource efficiency in several daily activities that citizens perform in urban environments. In the case of energy management, this aim is not only related to the amount of energy consumed, but also to the infrastructure required to distribute the energy [1]. The capacity of this infrastructure is often conditioned by peak consumption, as it should be able to distribute the energy during the periods of high demand without producing power outages. However, if consumption of a certain area is remarkably unbalanced (having important variations along the day), this would required a large investment in infrastructure that will be idle the most of the time [2].
Time-of-Use (ToU) pricing for households contributes to the overall efficiency of the electrical system. ToU incentives citizens to have a smoother consumption patron, shifting the usage of electric appliances from expensive peak hours to relatively cheaper off-peak hours. This behavior reduces the maximal instant power consumption of an urban area and, therefore, cuts back the required infrastructure investment to handle the peak and the risk of power outages [2]. However, usually off-peak hours, in which electricity is cheaper, are not preferred by users for using their appliances. This effect, which is known as inconvenience due to timing [3], can affect the well-being of the users. Therefore, there is a trade-off between both criteria, i.e., electricity cost and users satisfaction. Intelligent computer-aid tools may help users in the decision-making process of scheduling their deferrable appliances [4,5].
This article proposes a novel mixed integer programming model for scheduling deferrable electric appliances in households, which simultaneously considers minimizing the electricity cost and maximizing the users satisfaction. Users satisfaction measures to what extend the starting time and duration for appliances usage scheduled by the model match the users preferences, which is estimated through the analysis of historical data [6,7,8]. However, since this parameter can show certain variability between different days, stochastic resolution approaches that consider this uncertain behaviour are devised. Therefore, the main contributions of the research reported in this article include: i) a novel mathematical formulation for the household energy planning problem based on integer programming that improves upon previous work by reducing the number of variables and constraints, ii) two resolution approaches for handling uncertain users preferences and the conflicting goals of minimizing the electricity cost and maximizing the users satisfaction, which have not been used before in the context of this problem, and iii) experimental evaluation over instances based on real-world data and a thorough analysis of the results. This article extends our previous conference article "A simulation-optimization approach for the household energy planning problem considering uncertainty in users preferences", presented at 10th International Conference of Production Research-Americas. New content and contributions in this extension include a novel greedy heuristic for addressing the bi-objective household energy planning problem and extended experiments, including building-like instances. These instances consist of a unique building that has inside several housing units or users and, thus, besides of respecting the maximum power contracted per individual household, the energy planning of all the households of the building has to respect the overall power consumption contracted by the building.
The article is structured as follows. Section 2 presents the mathematical formulation of the problem, the resolution approaches and the related works. Section 3 presents the computational experimentation, including the description of the used instances, the implementation details and the obtained results. Section 4 discusses the main results obtained. Finally, Section 5 formulates the conclusions and describes the main lines of future research.
2.
Materials and methods
The household energy planning problem addressed in this article aims at reducing expenses of electricity in households while enhancing users satisfaction. This last objective was estimated by considering in which part of the day users prefer to use the appliances (inferred from historical data).
2.1. Mathematical formulation
The household energy planning problem addressed in this article is modelled as a mixed-integer programming (MIP) model considering the following elements:
Sets:
● a set of users U=(u1…u|U|), each user represents a household;
● a set of time slots T=(t1…t|T|) in the planning period;
● sets of domestic appliances Lu=(lu1…lu|L|) for each user u;
Parameters:
● a penalty term ρu applied to those users that surpass the maximum (electric) power contracted;
● a parameter Dul that indicates the average time of utilization for user u of appliance l∈Lu;
● a parameter Ct that indicates the cost of the power in time slot t in the ToU pricing system;
● a parameter Pul that indicates the power consumed by appliance l;
● a binary parameter UPult that is 1 if user u prefers to use the appliance l∈Lu at time slot t, 0 in other case;
● a parameter Eu that indicates the maximum power contracted by user u;
● a parameter Ejoint that indicates the maximum power that the (whole) set of users U are allowed to consume, which is used in building-like instances;
Variables:
● a binary variable xult that indicates if user u has appliance l∈Lu turn on at time slot t;
● a binary variable δult that indicates if the appliance l∈Lu of user u is turn on from time slot t up to a period of time that its at least equal to Dul;
● a binary variable ψut that indicates if user u is using more power than the maximum power contracted Eu.
● a binary variable Ψut that indicates if user u is using more power than 130% of the maximum power contracted Eu.
The problem aims at finding a planning function X={xult} for the use of each household appliance that simultaneously maximizes the users satisfaction (given the users preference functions) and minimizes the total cost of the power consumed. The mathematical formulation is outlined in Eqs (1)–(10).
Subject to
Equation (1) aims at maximizing the users satisfaction according to their preferences. Equation (2) aims at minimizing the energy expense budget, which include the charge for power consumption and the penalization for exceeding the maximum power contracted. Equation (3) enforces δult to be one when the length of time an appliance will be on is equal or larger than the required by the user. Equation (4) enforces ψut to be one if the user exceeds the maximum power contracted. Equation (5) enforces Ψut to be one if the user exceeds the maximum power contracted for more than 30%. For building-like instances, Eq (6) enforces that the joint electric consumption by the set of users do not surpass a the maximum power allowed to the building. Equations (7)–(10) establishes the binary nature of the variables.
2.2. A simulation-optimization resolution approach
Real-world data shows that considering users preferences (UP) as a deterministic parameter does not adjust to reality [9]. Users satisfaction is modelled more accurately if uncertainty is taken into account for preferences in the model. Therefore, this article develops a resolution approach that considers this stochastic behaviour.
2.2.1. Bi-objective optimization
In order to handle the bi-objective nature of the optimization problem presented in Section 2.1, a weighted sum optimization approach is applied. The weighted sum is a traditional method in the multiobjective optimization literature which has extensively been used in many applications, including other household energy planning related problems [3]. Applying this approach, Eqs (1) and (2) are jointly optimized with Eq (11), where α and wβ are the relative weights given to users satisfaction and cost criteria by the decision-maker.
One of the main drawbacks of this method is to know the actual best and worst values of each objective within the set of non-dominated solutions which are used for normalization (i.e., Fbest and Gbest, Fworst and Gworst in Eq (11), respectively). In this article, for addressing this issue, the procedure proposed in Rossit [10] and applied in Rossit et al. [11] is used. This is a two step procedure. In the first step, the best and worst values of each objective are approximated by solving the single objective problem of each of the criteria involved. These values, which are likely to be dominated, are improved in the second step of the procedure. In this second phase, these best and worst values are used in the weighted sum formula (Eq (11)) along with a biased combination of weights. This is, two different problems are solved, one problem using α>>β>0 and the other problem using β>>α>0. Finally, from the solutions of these last two multiobjective problems, the new best and worst values are obtained.
2.2.2. Sample Average Approximation method for considering stochastic users preferences
Formally, in a stochastic optimization problem with a probabilistic objective function, the expected value of this function should be optimized. In the case of the formulation described in Section 2.1, if parameters UP are considered stochastic, Eq (1) should be replaced by Eq (12).
In Eq (12), UP is the random vector of the stochastic users preferences and Δ is the vector of decision variables δ described in Section 2.1. In order to optimize Eq (12), all the possible realizations of vector UP with its corresponding probability should be considered. Taking into account that the model of Section 2.1 uses a finite set of time slots, the set of possible realizations of UP is also finite. Particularly, there are |T|∑u∈U|Lu| realizations of this vector, each one constituting a possible scenario for the stochastic problem. For example, consider an instance in which the day is split in intervals of 30 minutes, i.e., |T|=48, there are two users (households) and each user has only two appliances (|Lu1|=|Lu2|=2). Then, the number of possible scenarios would be 484=5,308,416.
For the cases in which the large number of scenarios of real-world instances makes impractical to compute the exact expected value of Eq (12), the expected value is approximated with an independently and identically distributed (i.i.d.) random sample. This technique is called the "sample-path optimizatio [12]" or "sample average approximation [13]". Thus, Eq (13) is an estimator of the expected value of Eq (12).
As aforementioned, the set of values UP1,...,UPN, is an i.i.d. random sample of N realizations of the stochastic vector parameter UP. The optimization problem obtained when Eq (13) is used instead of Eq (12), is the sample average approximation optimization problem (hereafter SAA) and can be solved deterministically with commercial solvers. Clearly, the solution of the SAA problem depends on the realizations UP that are included in the random sample. Moreover, the larger the size of the sample (N), the smaller is the difference between Eq (12) and its estimator Eq (13). Particularly, when N→∞, ˆe→e [14].
Different samples of size N (i.e., different set of realizations of the stochastic vector parameter UP) allow shaping different forms of Eq (13). Therefore, all algorithms based on sample average usually solve the SAA problem several times with different samples and after that the most promising solution is selected according to a given (predefined) criteria as the final solution.
Let ˆe1N,ˆe2N,...,ˆeMN be the values of Eq (13) when solving M SAA problems, each one with a different sample of size N. Moreover, considered that ˆs1N,ˆs2N,...,ˆsMN are the solution (values of decision values) obtained for each of the aforementioned M SAA problems. An intuitive criteria for selecting the final solution among the M possibilities, would be to pick the solution with the best ˆeN value. In this article, a more sophisticated procedure to select the final criteria, which was proposed in Norkin et al. [15] and implemented in Verweij et al. [16], is used. This procedure is described as follows. First, an independent sample of size N′ with N′>>N is built to evaluate the M solutions using this sample. Then, the solution with the best value as it is expressed in Eq (14) for a maximization problem is selected.
The previously described idea takes advantage from the fact that even though using the large sample size N′ for the optimization phase is very time consuming (specially in NP-hard problems as the one addressed in this paper), using it for just for evaluation of the objective function Eq (13) is achievable in reasonable computing time [14]. The pseudocode of the proposed SAA approach is outlined in Algorithm 1.
2.3. A greedy heuristic for household appliances planning
A greedy heuristic is proposed as reference baseline for results comparison. Greedy algorithms are conceived to heuristically obtain a global good solution to a problem by making locally optimal decisions by a repetitive procedure [17]. These heuristics have been efficiently applied in other energy planning problems by our research group [18,19,20]. The pseudocode of the greedy heuristic is outlined in Algorithm 2.
The main goal of the proposed greedy algorithm is to build low-cost solutions (according to Eq (2)). However, it also considers a threshold level of user satisfaction that must be fulfilled. For this reason, function BestPrefInterval() seeks the interval with the maximum user satisfaction for each appliance. Then, function BestCostInterval() seeks the interval that minimizes the cost given that the user satisfaction is not smaller than a percentage (0<π<1) of the maximum user satisfaction for the same user and appliance and that the maximum power contracted by the user is not exceeded. Thus, sets the appliance as switched ON starting from that time slot (up to the time slot in which expected duration is fulfilled). Within each user, appliances are processed in descending order of power consumption. Similarly to the SAA approach, BestPrefInterval() uses average user preferences (UP) given a certain number of realizations of this stochastic parameter. The greedy heuristic is also applied to M different samples of size N of the preferences vector and the final solution is selected using the same procedure as in the SAA.
2.4. Related work
Household energy planning has been considered as a complex problem in the related literature. This article focuses on the stochastic version of the problem. A more general review of the topic was presented by Lu et al. [21].
The deterministic version of the household energy planning problem is associated with bin packing [22], a well-known NP-hard problem. The inclusion of uncertainty increases the complexity of the problem [23]. Several articles have addressed stochastic versions of this problem, by considering uncertainty in different parameters. Chen et al. [24] considered uncertainties in the power consumed by the appliances and the renewable solar energy gathered by a photovoltaic array. A three-stages resolution process was proposed. First, Chen et al. solve a deterministic linear programming optimization model considering mean values for the appliances consumption and maximum solar power generation. Then, they apply a stochastic procedure based on Monte Carlo simulation was applied to the resulting solution. The simulation considers different energy consumption rates of appliances and selects the consumption rate that minimizes the probability of shortcuts, which occurs when the overall consumption of electricity surpass a certain threshold value. Finally, an online adjustment of the previous (offline) solution was applied, which monitors the instant solar power generation and the consumption of appliances in real-time, compensating the household electric balance of the offline solution with a larger power storage in the battery or purchase from the grid. Hemmati and Saboori [25] proposed a particle swarm optimization algorithm to deal with uncertainty of photovoltaic panels in a similar problem. Assuming that the energy generated in the panels has a Gaussian probabilistic distribution, a Monte Carlo simulation was used each time the stochastic function has to be evaluated to obtain a sample of the generation values.
Other researchers have used robust optimization, which aims at minimizing the impact of the worst-case scenario, considering that random parameters have a bounded probabilistic distribution [3]. Jacomino and Le [26] presented a robust optimization approach to simultaneously minimize energy cost and maximize the comfort of users. They considered uncertainty in two aspects: the outdoor temperature and the solar radiation related to weather forecast -that affect the energy to be consumed to satisfy the required indoor temperature-, and users decisions related to not programmable services, i.e., despite the scheduled starting time and duration of the appliances the user can modified these conditions when actually using them. For handling uncertainty on users behaviour, a decomposition approach based on estimating the probability of occurrence of each scenario was used. Wang et al. [27] proposed a robust optimization approach for dealing with photovoltaic energy generation in household planning by using a mixed integer quadratic programming model, and Wang et al. [28] for dealing with uncertainty in hot water utilization and outdoor temperature that influences the usage of heating and air conditioning systems. Judge et al. [29] proposed a robust optimization model to manage uncertainties associated with thermal loads such as heating and air conditioning and solved combining Harris Hawks' optimization [30] and linear programming. {Hosseini et al. [31] presented a robust optimization approach to minimize the energy cost while satisfying certain comfortability restrictions considering uncertainty from two different sources: the decisions of user of when using each appliance and the intermittency of renewable energy sources. Another work that uses robust optimization for handling uncertainty of renewable sources of energy was performed by Shi et al. [32]. Other published material deals with this problem as a control problem by using a closed-loop approach such as Scarabaggio et al. [33], who used a sample average approximation based on a probability density function to cope with uncertainty in wind power availability, or Nassourou et al. [34], in which a control strategy that is divided into an open-loop system that manage the dependent control inputs and a closed-loop system that uses local feedback control for the independent inputs.
From the analyzed works, it can be concluded that fine grained energy consumption data collection from smart homes considering uncertainty has shown to be a powerful tool to define more efficient and reliable electricity services. However, the collection and exchange of information raise concerns about consumer privacy. The collected data could be used to infer activities and behavior patterns of consumers or an attacker could create fake power information to jeopardize the power system [35]. In order to deal with these privacy issues, Tonyali et al. developed a meter data obfuscation scheme to protect consumer privacy from eavesdroppers and the utility companies while preserving the utility companies' ability to use the data for state estimation [36]. Mohammed et al. proposed an approach based on adding noise to the reading data so no one can obtain the meters' individual data, however, the total readings of the meters can be known by the utility [37]. In line with the work presented in this article, the problem of enhancing the decision making processes in demand-side management has been addressed by adding a specific optimization objective related to preserving users' privacy. Thus, there have been proposed multiobjective optimization approaches that have proposed the minimization of the energy consumption cost while maximizing users' privacy by masking the energy consumption profile of the user [38,39]. Chang et al. defined load variation as the privacy metric and scheduled inflexible and unshiftable appliances, flexible appliances, and shiftable appliances [38].
Other authors, although without considering uncertainty in their models, have explored the trade-off that usually exists between electricity cost and users satisfaction through linear mathematical programming approaches, as it is performed in this article. Among them, Yahia et al. [40] modeled a bi-objective problem considering these two objectives, which were combined by means of a linear weighted sum to form a unique objective function. Authors solved two single-household instances, i.e., a real South African case study and an artificial large instance, using LINGO. Additionally, they performed an extensive analysis of the sensitivity of the results to the modifications of certain parameters. Authors extended the approach by considering the reduction of the peak load as a third objective [41]. Moreover, an instance considering several households simultaneously was solved. Three different multiobjective approaches were compared: lexicographic optimization, normalized weighted sum and compromise programming. Our previous articles explored the trade-off between the users satisfaction and energy cost in a deterministic version of the problem using evolutionary algorithms [19,42].
This article contributes to the literature in several aspects. Firstly, a novel linear mathematical formulation of the household planning energy optimization problem that explicitly considers users satisfaction as an objective function is presented. Approaches like that are not common in the related literature [40]. Moreover, this is an novel mathematical formulation compared to the one presented in our previous article [19] for a similar conceptual model, but improving upon it by having a smaller number of variables and constraints that eases its solvability. Secondly, this article considers stochastic users preferences, which differentiates it from other linear programming applications in the related work [40,41]. This leads to a novel scientific contribution of the work, which is the application of the simulation-optimization Sample Average Approximation method to handle the uncertainty which has not been applied to this specific problem before.
3.
Results
This section presents the computation experimentation, including a description of the instances that were used, the experiment design and the main results of the experimentation.
3.1. Problem instances
The instances addressed were generated using realistic information and expanding the REDD dataset [9] via a urban data analysis approach [43]. One of the key parameters to estimate in the household energy planning model presented in this work are the users preferences. For estimating this, historical information retrieved from the REDD dataset about the power consumption of the selected appliances on each household was analyzed. This task involved cleaning the data from comparatively very small power consumption that are related to stand-by operation mode of each appliance, for example, small screen leds. After this, for each combination of user and appliance, a probability of usage for each time slot was estimated (pult). With this probability, M instances were constructed for each sample size N as is described in Section 3.2. Additionally, from the REDD dataset, the mean power consumption of each appliance in KW (Pul) and the duration of the average time of utilization of each appliance (Dul) were estimated. The weekend period was considered to introduce noticeable differences in the instances, a behaviour that is usual for household users [44]. Thus, instances were grouped into two categories: weekdays and weekends. Parameters Eu (maximum electric power contracted for each household) and Ct were obtained from the National Electricity Company, Uruguay, as reported in the ECD-UY dataset [45].
Besides the weekly separation (noted as wd and we for weekday and weekend, respectively), instances with increasing sizes were also defined, as already described in the methodology of the experimental evaluation of previous works [18]:
● small (s.wd and s.we), modeling scenarios with one household with seven deferrable appliances.
● large (l.wd and l.we), modeling scenarios having two households with six and seven deferrable appliances, respectively.
● building (b.wd and b.we), modeling scenarios with four households with six and seven deferrable appliances, respectively.
Electric appliances are classified in deferrable and non-deferrable appliances [46]. Deferrable appliances are those devices that can be controlled by the user and deferred to be switched on in different time-slots on the scheduling horizon, without a critical result in the comfort of users [47]. Conversely, non-deferrable appliances are those which its standard operation time cannot be shifted without a significant impact on the comfort of users, since they are critical for users to accomplish basic everyday activities, such as lighting. The scheduling approach proposed in this article considers deferrable appliances. Few works in the related literature have included non-deferrable appliances in smart home planning systems, mainly because they do not provide flexibility to compute accurate schedules, and even slight shifts of their operation times cause severe penalizations on user-comfort related objectives. This article considers both non-interruptable deferrable appliances, i.e., microwave, washer dryer, dishwasher and refrigerator, and interruptable deferrable appliances, i.e., electric stove and air conditioning.
In both small and large size instances, the constraint defined by Eq (6) was not applied, since the considered households are independent and, thus, the constraints in Eqs (4) and (5) already allow limiting the maximum consumed power. The instances b.wd and b.we have to meet not only the maximum power contracted per individual household, but also the overall power consumption contracted by the building.
3.2. Experimental results
After preliminary calibration experiments, the following sample sizes were chosen N = 1000, 2000, 3000, 5000, and 10000. Within each sample size, the number of independent samples (M) was set to 100. The evaluation sample size (N′) was set to 100, 000.
In order to apply the SAA approach, the bi-objective optimization procedure introduced in Section 2.2 was used. This optimization procedure requires estimating both the ideal and nadir values for the weighted sum function defined in Eq (11). The estimation of the ideal and nadir value was performed for each sample size N applying the two step procedure presented in Section 2.2: initially they are estimated through single-objective optimization and, later, they are improved applying the weighting sum method with a biased combination of weights. Then, five weight vectors (α,β) were used for exploring different trade-off combinations between the objectives of energy cost and users satisfaction: (0.99, 0.01), (0.25, 0.75), (0.5, 0.5), (0.75, 0.25), and (0.01, 0.99). In the SAA method, for each weight vector a MIP problem is solved using Gurobi [48] through Pyomo as modelling language [49]. In the case of the greedy heuristic three aspiration levels were considered (π): 0.60, 0.75, and 0.90.
The experiment was divided in two parts. Firstly, the random realizations or samples of vector UP were generated and secondly the optimization algorithms were applied to these random samples. This separation was performed because of two reasons: i) to study the impact of the generation of random samples of vector UP in the overall efficiency of the algorithm and ii) to apply both algorithms over the same set of random samples to provide a more fair comparison avoiding differences in the results because of this random procedure. Then, for each instance and size N, a set of 100 (M) independent realizations of vector UP were generated. Table 1 reports the computational times demanded for generating the realizations of vector UP. The execution times indicate that the average time increases linearly with the sample size N. This is connected to the trade-off between having a large sample size N which is computationally expensive but provides a better estimation of the real expected value (Eq (12)) by Eq (13) or a smaller sample size N which is lees time-consuming but provides a worse approximation of the real expected value.
This section presents the main results of the computational experimentation with SAA and the greedy heuristic. Detailed results about all the runs performed can be depicted in the Appendix B. To condense the outcome of the proposed approach into a suitable indicator that measures the quality of the results, the deviation to the ideal vector is used. This is computed using the L2 distance norm according to Eq (15).
In the definition of the Σ metric in Eq (15), O is the set of objectives, (for the considered problem, O={F,G}), and besto is the best value achieved for each objective evaluated over N′ in all the experiments performed for that instance. Thus, from all the solutions, the solution with the smallest distance is the best comprising solution, as graphically represented in Figure 1.
Another relevant aspect that should be analyzed when controllable deferrable loads are shifted collectively, is the peak rebound effect that can be associated to a drastic increment of the consumption during low priced hours. The metric of the load factor is usually used in the related works to measure this aspect [50,51]. The load factor is defined as the ratio of the average energy consumption to the maximum energy consumption in the planning horizon. A higher load factor implies a more stable consumption which can help to avoid problems in the electric grid [50]. Thus, the load factor for all the users (Lf) is reported for the presented solutions, calculated according to Eq (16).
The results of the SAA are presented in Table 2. This table reports for each instance, the sample size N, the combination of weights (α,β), the average execution time in seconds, the values of F and G of the best solution, i.e., the solution that has the minimal value of function H (Eq (11)), and the deviation of the solution to the ideal vector Σ (Eq (15)). In turn, the experimental results of the the greedy heuristic are reported in Table 3. The table presents for each instance, the sample size N and the aspiration preference level π, the same results as for the SAA. As aforementioned, the computing times in Tables 2 and 3 do not include the time to generate the N random realizations of the user preferences vector UP.
4.
Discussion
This section discusses the results obtained in the computational experimentation, considering different aspects, including the impact of sample size and objective biased in algorithms efficiency and the quality and distribution of solutions in the Pareto front. Finally, the analysis of an illustrative case study is presented, to proper evaluate the quality of service provided to citizens.
4.1. Impact of sample size and objective biased in algorithms efficiency
The obtained experimental results allow concluding that the methods are robust with respect to the size of the sample, since the increment of N has a limited effect on the performance. In both objectives, the increment in N generally reduces the standard deviation of the computed values. However, the average and best value only varies slightly (Tables A1 and A2). Moreover, results of the greedy heuristic using larger sizes of N are systematically worse in terms of distance to the ideal vector than than those computed using smaller sample sizes.
The SAA problems were solved to optimality by Gurobi, being able to find solutions with 0% MIPGap for the compact mathematical formulation presented in Section 2.1 in relatively short computing times (less than 1 s for all instances). The analysis of execution time shows that schedules that are biased towards minimizing the cost objective (with higher values of β) are more difficult to solve for Gurobi, which requires a much larger computing time to solve the instances. In regard to the greedy heuristic, the algorithm is very fast to solve the instances, as all average computing times are less than 0.1 s. Moreover, unlike SAA, which is sensitive to the bias among objectives, the computing times of the greedy heuristic are independent of the aspiration level used since computing times do not vary.
Another relevant aspect is that when considering the computing time of the whole resolution process, i.e., the generation of the random samples of the user preferences (reported in Table 1) and solving the optimization problem (either by the greedy heuristic or the SAA), the most time consuming stage is the generation of the random samples. Additionally, the time of generating the random sample increases approximately proportional to the size of N, whereas the average time of solving the optimization problem is almost constant for any size of N.
4.2. Quality and distribution of solutions
Regarding solution quality, Table 4 reports the minimum, average and maximum value of the distance to the ideal vector for each instance and each algorithm.
Results in Table 4 indicate that SAA is able to obtain, on average, better solutions than the greedy heuristic. SA computed the smallest average distance on instance s.wd (20.72%). The best average distance for the greedy heuristic was obtained on the same instance s.wd (25.63%). Both algorithms obtained the worst results in terms of distance to the ideal vector for the building like instances. Results show that instances in which different users have to coordinate the use of appliances to not surpass the overall power consumption contracted by the building are more difficult to solve than those instances where a single user is considered. Regarding the best compromise solution, i.e., the solution that has the smallest distance to the ideal vector, it was obtained in instance s.wd in both algorithms. The smallest distance to the ideal vector computed by SAA was 10.94%, achieved using two different weights vectors, (0.5, 0.5) and (0.75, 0.25) for all the sample sizes N. Finally, regarding the greedy heuristic, the smallest computed distance is 11.52%, computed using π=0.75 and sample size N=1000.
Regarding the load factor, Table 5 indicates that the greedy heuristic is able to obtain better results in all the instances either considering the average or the maximum load factor. Although maximizing the load factor was not part of the optimization problem, it is a relevant characteristic of the greedy heuristic since, as aforementioned, higher load factors are associated with a more stable functioning of the electric grid.
For better depicting the distribution and trade-off between the objective function values of the computed solutions, the Pareto fronts of the experiments with the larger sample size are presented in Figure 2. For the SAA, a total of 100 solutions are computed. These solutions were calculated using evenly separated weight vectors (α, β) with α+β=1. Regarding the greedy heuristic, 35 solutions with evenly separated aspiration level π with π∈[0.6,0.95] were computed. The SAA is able to better explore the search space, whereas the greedy heuristic finds, in general, solutions that have relatively large costs. From the analysis of the figures, it can be inferred that several runs of the SAA obtain similar solution (or even the same solution). The possibility of obtaining repeated solutions, i.e., obtaining the same solution for two different weight vectors, is a known disadvantage of using the weighting sum method for handling the multiobjective nature of an optimization problem [11]. To overcome this problem, more sophisticated multiobjective approaches, such as the augmented ε-constraint method, can be used. In regard to Pareto dominance, the solutions of the SAA usually dominates the solutions of the greedy heuristic.
4.3. Power consumption analysis for an illustrative case study
This subsection presents an illustrative case study for one of the solved problem instances, to provide an insight on the scheduled power consumption in each time slot of the planning period, computed by the two studied methods. Figures 3 and 4 report the power consumption (in KW) in each time slot of representative solutions computed by the proposed approaches of the building-like scenario discriminated per user on weekday (b.wd) and weekend (b.we), respectively. Each time slot represents an interval of thirty minutes and they are numbered subsequently (e.g., time slot 0 represents the first thirty minutes of the day, and so on). Additionally, the cost of electricity foe each time slot is plotted as a line in the Figures (expressed in Uruguayan pesos per KW). Three solutions of the SAA and one solution of the greedy heuristic are presented. Selected solutions for the SAA correspond to the two extreme solutions and a balanced solution: one solution biased towards users satisfaction using vector (0.99, 0.01), a second solution biased towards cost reduction using vector (0.01, 0.99), and the third solution equally weighting the problem objectives, using vector (0.5, 0.5). The selected solution of the greedy heuristic is the one with an aspiration level of 0.75. These solutions are representative of different optimization results for both studied methods and provides diverse trade-offs between the problem objectives.
The analysis of Figure 3 allows concluding that users have a preference for using electric appliances at the end of the day. Thus, the solution that prioritizes user satisfaction has a large power consumption during the evening and night (Figure 3(a)). This is a common habit when users return to their homes after work at the end of the day, and they perform the majority of the activities in these hours. However, this part of the day corresponds to the peak hours, in which electricity price is more expensive and, thus, the solution presented in Figure 3(a) is rather expensive. Conversely, solutions that have a smaller total cost are biased towards using the appliances at the beginning of the day (as presented in Figure 3(c)). As expected, the solution presented in Figure 3(c), which was computed using a more balanced weight vector, defers the use of some appliances to the middle hours of the day. However, the cost objective has a greater influence than the user preferences, since a large part of the consumption is still allocated at early hours, where the electricity price is lower. Regarding the solution computed by the greedy heuristic (presented in Figure 3(d)), the energy consumption patter is rather similar to the one proposed by the solution of the SAA using a large weight for the user satisfaction objective (Figure 3(a)). However, the utilization of appliances is more distributed throughout the day. As a consequence, the peak consumption, i.e., the time slot with the highest consumption, is smaller for the greedy solution (8 KW) than for the SAA solution (10 KW).
In any problem considering the scheduling or planning of human-related activities, the normal lifestyle and the timeline of daily actions limit the possibility of displacing the considered activities to some convenient, but dead periods. This is also the case for the studied problem, since deferring the use of electric appliances from peak hours to off-peak hours with lower electricity prices is not always possible, since several off-peak hours usually coincide with the time the users are resting at night. Another element that prevents users from taking advantage of lower electricity prices of off-peak hours are the normal working timetables, since usually during the morning and the noon the user is out of home, at work. However, a different scenario happens during weekends, when users remain more time at home and, therefore, they can perform some household tasks during off-peak hours.
Regarding the computed solutions, the different situation that happens during weekends is depicted when performing pairwise comparisons between the four representative solutions of the weekend scenario (Figure 4) and the corresponding solutions of the weekday scenario (Figure 3). In the four cases, the solutions of the weekend scenario have a more distributed power consumption throughout the day, having a larger consumption in the middle hours of the day and a smaller peak consumption. The reduction of the peak consumption is particularly important for the greedy solution, i.e. from 8KW in the weekday solution (Figure 3(d)) to 4KW in the weekend solution (Figure 4(d)). Since the ToU pricing bill applied by the electricity company is the same for weekdays and weekends, the reason of the differences among weekdays and weekends solutions relies on the differences in users preferences. Although users still prefer to use appliances at the evening (as is evidenced in the solution that prioritizes user satisfaction of Figure 4(a)), users are also more willing to use the appliances in the middle of the day, allowing the resolution algorithms to better distribute the power consumption.
As aforementioned, a more distributed power consumption throughout the day as occurs on the weekends results, benefits both users and electric companies. On the one hand, users are able to take advantage of the relatively cheaper off-peak hours. On the other hand, the reduction in the peak consumption, when considered in the city aggregated level, allows reducing the required infrastructure investment that electric companies have to perform to handle peak consumption and also allows significantly reducing the risk of power outages. In line with these benefits for the system, the recent rise of home office that has occurred due to the COVID-19 pandemic is as a great opportunity to balance the energy utilization by households, since users remain more time at home. However, to better analyze this possibility, new datasets should be gathered to incorporate the changes on the lifestyle of users of the pandemic. In line with this goal, the project 'Computational intelligence for the analysis of residential electricity consumption' is carried out in Uruguay, to gather relevant data from residential customers. The most relevant result of this project has been the generated ECD-UY dataset [45].
5.
Conclusions
Energy management is a crucial issue in modern societies, since an increasingly number of urban activities rely on an efficient electricity service. In order to improve energy management, it is not only required to improve the offer of electricity supply by companies, but also to enhance the demand-side of the system.
This article addressed the household energy planning problem, aiming at improving the efficiency of the consumed energy. For achieving this goal, an optimization model was proposed for scheduling deferrable appliances considering two conflicting objectives: reducing the total cost of electricity paid by households (in a context of ToU pricing in electricity bills) and enhancing the users satisfaction with the energy consumed. To account for a realistic model, able to be implemented in practice, the restriction of the maximum allowable power consumption contracted by the user (to the electric company) was incorporated.
The users satisfaction was estimated through a data-analysis model, studying historical data of households in order to determine the preferred time slots for using each appliance. Since considerable variations of these preferences were identified for different users, a stochastic resolution approach was applied to consider the uncertainty of this parameter.
For solving the problem, two different algorithms were devised: a Sample Average Approximation method, which is a simulation-optimization approach that combines Monte Carlo simulation and deterministic mixed integer programming, and a greedy heuristic, which attempts at obtaining good global solutions by making locally optimal decisions repeatedly. The algorithms were tested on realistic instances. The instances comprehend scenarios with a single household, several households and building-like scenarios (in which diverse households or users has to coordinate the usage of appliances so the overall power consumption of the building does not surpass a certain joint threshold value). The results of the computational experimentation show the competitiveness of the proposed approach which are able to compute different compromising solutions accounting for the trade-off between these two conflicting optimization criteria in reasonable computing times The Sample Average Approximation method systematically outperformed the solutions obtained by the the greedy heuristic. However, the heuristic is much faster. The building-like instances were the more challenging for both algorithms requiring larger computing times. At least, for the analyzed cases, the size of the sample of the user preferences seems to not affect largely the performance of the algorithm. The results also allowed analyzing the different users behaviour between the weekdays and the weekend, finding that during weekends the appliance usage is more distributed throughout the day.
The main lines for future work are related to expand the computational experimentation of the proposed model and algorithms, by including more households, e.g., instances that represent an apartment building or a gated community. In turn, the proposed model can be expanded by considering non-controllable appliances and renewable power generators within the household, e.g., solar or wind power generators. In relation to the input data, it would be useful to gather updated information in order to analyze if the variations in the lifestyle of users due to the pandemic and home office have substantially alter the user preferences, and compute accurate planning for this new situation too. Regarding the resolution algorithms, two future lines of work are will be consider. On the one hand, SAA can be improved by replacing the bi-objective approach based on weighting sum with a more advanced exact multiobjective method (e.g., augmented ε-constraint method) to avoid obtaining repeated solutions. On the other hand, population-based explicit multiobjective optimization methods, such as multiobjective evolutionary algorithms, can be implemented to better explore the trade-off among objectives. {Regarding preserving users' privacy, the proposed model can be extended by including appliance shifting and scheduling to control battery charging and discharging. Finally, an interesting research line to explore in the future is the comparison with other stochastic and/or robust resolution approaches.
Acknowledgements
D. Rossit was supported by the program "Estancias de investigadores de reconocido prestigio en la UMA'' (ayuda D.3) of the Vicerrectorado de Investigación y Transferencia of the Universidad de Málaga and the research projects 24/J084 and 24/J086 of the Universidad Nacional del Sur. The work of S. Nesmachnow is partly funded by ANII and PEDECIBA, Uruguay. J. Toutouh was funded by European Union's Horizon 2020 research under the Marie Skłodowska-Curie grant agreement No. 799078. We would like to thank the anonymous reviewers for their insightful comments that led us to improve the article.
Conflict of interest
All authors declare no conflicts of interest in this paper.
Appendix
Computational experimentation details
This Section presents the detailed experimental results of the SAA and the Greedy heuristic. The details of the SAA are presented in Table A1. This table reports for each instance, the sample size N, the combination of weights (α,β), and the average and standard deviation of five relevant metrics:
● the execution time;
● the users satisfaction function F evaluated over N′;
● the cost function G evaluated over N′;
● the values of F and G of the best solution, i.e., the solution that has the minimal value of function H, as defined in Eq (11);
● the deviation of the solution to the ideal vector Σ, computed using the L2 distance norm, according to Eq (15).
In turn, the detailed experimental results of the the greedy heuristic are reported in Table A2. This table presents for each instance, the sample size N, the aspiration preference level π, and the average and standard deviation of the five metrics also reported for the SAA. The computing times in Tables A1 and A2 do not include the time to generate the N random realizations of vector UP.