


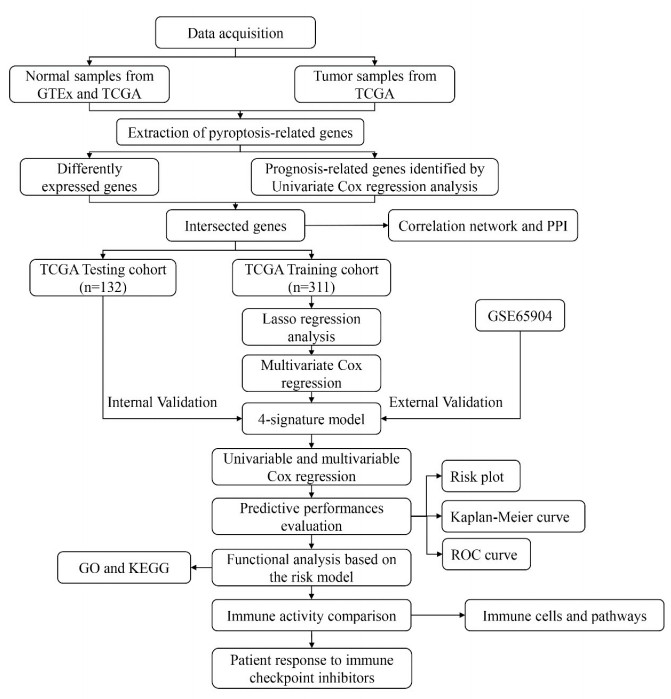
Figure 1.
Workflow diagram for analyzing pyroptosis-related genes in SKCM.
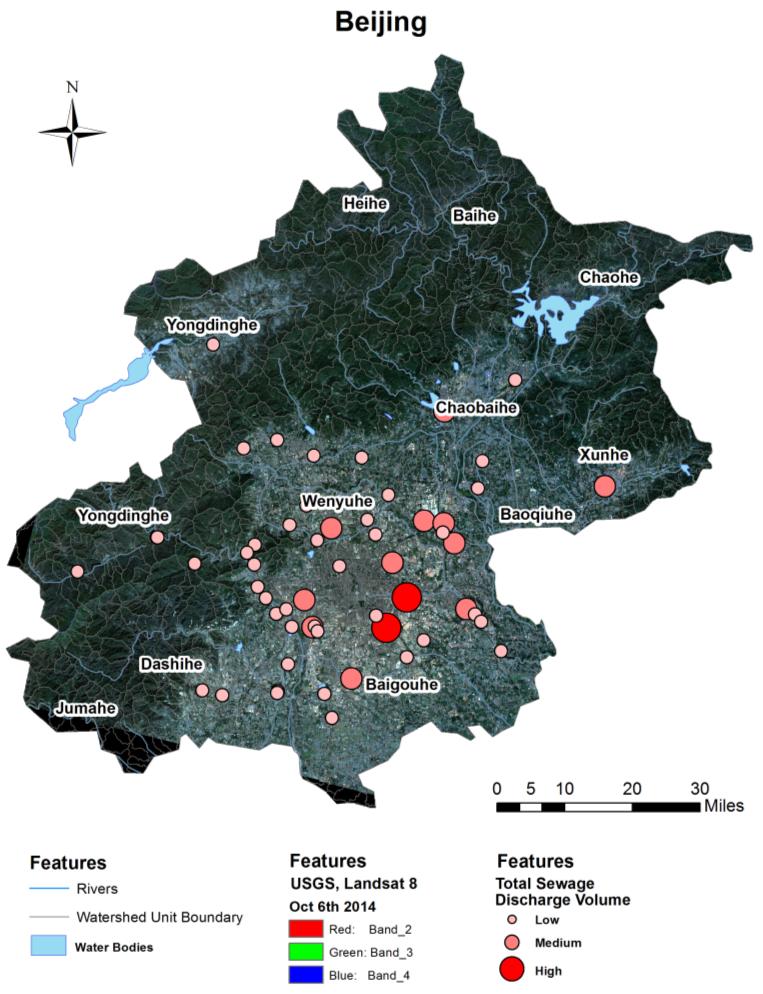
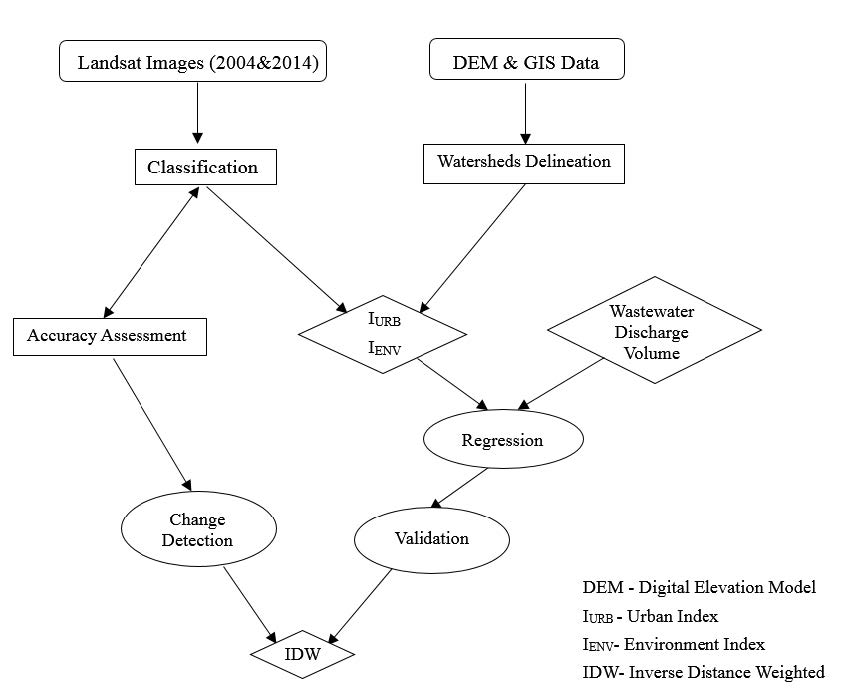
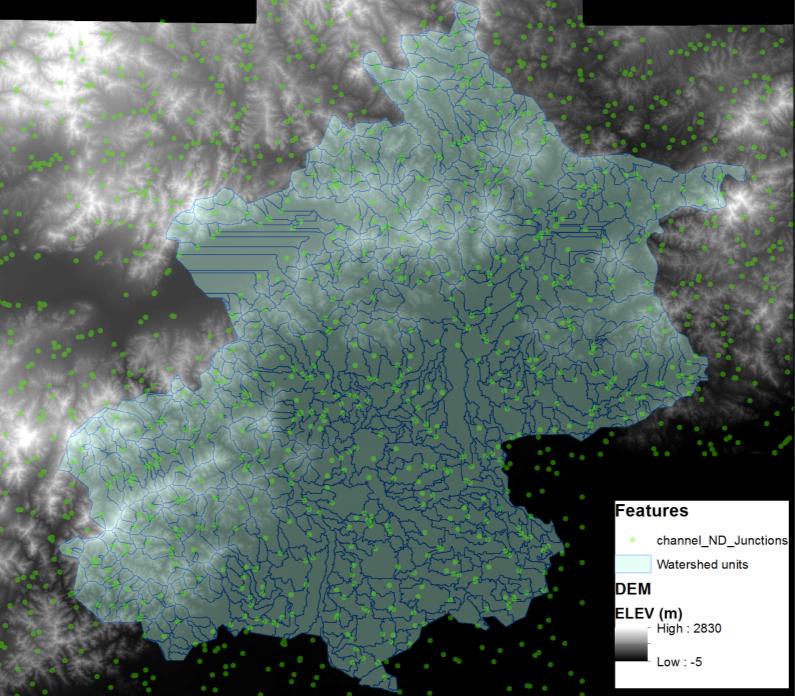
Citation: Huixuan Li, Cuizhen Wang, Yuqin Jiang, Andrew Hug, Yingru Li. Spatial assessment of sewage discharge with urbanization in 2004–2014, Beijing, China[J]. AIMS Environmental Science, 2016, 3(4): 842-857. doi: 10.3934/environsci.2016.4.842
| [1] | Feng You, Yunbo Gong, Xiaolong Li, Haiwei Wang . R2DS: A novel hierarchical framework for driver fatigue detection in mountain freeway. Mathematical Biosciences and Engineering, 2020, 17(4): 3356-3381. doi: 10.3934/mbe.2020190 |
| [2] | Jing Zhang, Ting Fan, Ding Lang, Yuguang Xu, Hong-an Li, Xuewen Li . Intelligent crowd sensing pickpocketing group identification using remote sensing data for secure smart cities. Mathematical Biosciences and Engineering, 2023, 20(8): 13777-13797. doi: 10.3934/mbe.2023613 |
| [3] | Qi Cui, Ruohan Meng, Zhili Zhou, Xingming Sun, Kaiwen Zhu . An anti-forensic scheme on computer graphic images and natural images using generative adversarial networks. Mathematical Biosciences and Engineering, 2019, 16(5): 4923-4935. doi: 10.3934/mbe.2019248 |
| [4] | Tingxi Wen, Hanxiao Wu, Yu Du, Chuanbo Huang . Faster R-CNN with improved anchor box for cell recognition. Mathematical Biosciences and Engineering, 2020, 17(6): 7772-7786. doi: 10.3934/mbe.2020395 |
| [5] | Muhammad Hassan Jamal, Muazzam A Khan, Safi Ullah, Mohammed S. Alshehri, Sultan Almakdi, Umer Rashid, Abdulwahab Alazeb, Jawad Ahmad . Multi-step attack detection in industrial networks using a hybrid deep learning architecture. Mathematical Biosciences and Engineering, 2023, 20(8): 13824-13848. doi: 10.3934/mbe.2023615 |
| [6] | Qihan Feng, Xinzheng Xu, Zhixiao Wang . Deep learning-based small object detection: A survey. Mathematical Biosciences and Engineering, 2023, 20(4): 6551-6590. doi: 10.3934/mbe.2023282 |
| [7] | C Willson Joseph, G. Jaspher Willsie Kathrine, Shanmuganathan Vimal, S Sumathi., Danilo Pelusi, Xiomara Patricia Blanco Valencia, Elena Verdú . Improved optimizer with deep learning model for emotion detection and classification. Mathematical Biosciences and Engineering, 2024, 21(7): 6631-6657. doi: 10.3934/mbe.2024290 |
| [8] | Lixiang Zhang, Yian Zhu, Jie Ren, Wei Lu, Ye Yao . A method for detecting abnormal behavior of ships based on multi-dimensional density distance and an abnormal isolation mechanism. Mathematical Biosciences and Engineering, 2023, 20(8): 13921-13946. doi: 10.3934/mbe.2023620 |
| [9] | Jin Zhang, Nan Ma, Zhixuan Wu, Cheng Wang, Yongqiang Yao . Intelligent control of self-driving vehicles based on adaptive sampling supervised actor-critic and human driving experience. Mathematical Biosciences and Engineering, 2024, 21(5): 6077-6096. doi: 10.3934/mbe.2024267 |
| [10] | Giuseppe Ciaburro . Machine fault detection methods based on machine learning algorithms: A review. Mathematical Biosciences and Engineering, 2022, 19(11): 11453-11490. doi: 10.3934/mbe.2022534 |
Skin cutaneous melanoma (SKCM) is the most malignant cutaneous tumor and accounts for the majority of skin cancer-related deaths [1]. According to the 2019 cancer treatment and survivorship statistics [2], SKCM is one of the top five prevalent cancers (684,470 cases among males and 672,140 cases among females). Early stage SKCM is curable with extended resection treatment [3]. However, a large number of high-risk SKCM patients develop metastasis and have poor prognosis. For patients diagnosed with metastatic SKCM, the 5-year survival probability is only 19% [2,3,4]. However, it is difficult to identify high-risk patients and intervene accordingly. Thus, it is urgent to build a reliable prognostic model to predict patients' survival.
Pyroptosis, a form of programmed cell death (PCD) [5], is characterized by consecutive cell expansion until membrane breaks down and cell contents leakage, leading to the activation of intense immune response [6]. Recent studies showed that some key pyroptosis mediators, such as Gasdermin (GSDM) family [7], NOD-like receptor (NLRs) family [8] and cysteinyl aspartate protease (CASP) family [9], are dysfunctional in multiple cancers. For example, Wei et al. [10] noted that NLRP3 was downregulated or even completely absent in hepatocellular carcinoma. Hergueta et al. [11] reported that GSDMB was associated with invasion and metastasis in breast cancer cells. Wang et al. [12] found that GSDMD could promote gastric cancer proliferation and regulate cell cycle-related proteins. Ye et al. [13] summarized pyroptosis-related genes (PRGs) and constructed a novel model for predicting the prognosis of ovarian cancer.
The role of pyroptosis in the development and progression of SKCM has also been investigated. For example, Dan et al. [14] reported that combined use of BRAFi and MEKi targeted therapies promoted cleavage of GSDME and induced pyroptosis in SKCM. Moreover, Zhou et al. [15] reported that iron-activated ROS signaling could cleave GSDME and promote melanoma cell pyroptosis. Combination of iron and ROS-inducing drugs could inhibit SKCM growth by activating GSDME-dependent pyroptosis. However, the predictive ability of PRGs for the survival of CM patients has not been elucidated. Thus, this study was intended to construct a PRG signature to predict the prognosis of SKCM patients and their response to immunotherapy.
The flow chart of this study is shown in Figure 1.
Due to the lack of normal samples in TCGA dataset, GTEx dataset was used as normal control. GTEx datasets (FPKM, log2(x+0.001) transformed) were downloaded from the University of California Santa Cruz (UCSC) Xena website (https://xenabrowser.net/datapages/) on 20 February 2021. Gene expression data of TCGA-SKCM (FPKM) and corresponding clinical features were downloaded from TCGA database (https://portal.gdc.cancer.gov/repository). Patients with incomplete clinical data or follow-up time < 90 days were deleted. The gene expression data from TCGA database were log2(x+0.001) transformed and merged with gene expression data from GTEx database using "limma" package in R software (v4.0.3). In total, 443 patients (all from TCGA dataset) and 813 normal controls (all from GTEx dataset, including not sun exposed skin from suprapubic and sun exposed skin from lower leg) were included in this study. Then, 443 patients in the tumor group were randomly divided into the training cohort and validation cohort at a ratio of 7:3. Specifically, 311 patients were set as the training cohort and 132 patients were set as the validation cohort. Subsequently, GSE65904 containing 214 patients was downloaded from GEO (Gene Expression Omnibus, https://www.ncbi.nlm.nih.gov/geo/) as an external validation cohort.
PRGs were extracted according to previous studies [13]. Differently expressed genes (DEGs) between the cancer group and normal control were identified using the "limma" package. P value < 0.05 and Log2(|fold change|) > 0.586 was considered the cut-off.
To explore the prognostic value of these PRGs, Cox regression analysis was conducted. Survival time and survival states were merged with mRNA expression data. P value < 0.05 was considered the cut-off. Prognosis-related genes were intersected with DEGs for further analysis. The protein-protein interaction (PPI) network was constructed and visualized using online tool at (https://string-db.org/). The correlation network of these intersected genes was constructed using the "igraph" package in R software.
The LASSO regression analysis was performed to eliminate genes that might overfit the model. In the training cohort, LASSO analysis was conducted by using the "glmnet" package in R software. The best penalty parameter lambda was chosen based on 10 cross-validation. Then, a multivariate Cox regression was performed to evaluate the contribution of each gene to prognosis prediction [16,17]. Finally, an algorithm for the risk score was established. The risk score was generated with a normalized expression value multiplied by corresponding regression coefficients (β). Each patient was assigned to a low-risk or high-risk group according to the median risk score. Overall survival (OS) time difference between the two groups was studied using Kaplan-Meier analysis. The receiver operating characteristic curve (ROC) and the area under the curve (AUC) were drawn using "survival", "survminer" and "timeROC" packages. Clinical data were combined with each patient' risk score. The correlations between the risk score and clinical features, such as T, N, M stage and age, were evaluated and visualized using "limma" and "ggpubr" packages. For internal validation studies, risk scores in the TCGA validation cohort was calculated using the same formula. Patients were divided into the low-risk and high-risk group before Kaplan-Meier analysis and the ROC curve were also used to assess the prognostic value of the model. For external validation, GSE65904 downloaded from GEO database was used as an external validation cohort. Expression profiles of each gene were normalized using the "sva" package in R. Risk score of each patient was calculated according to the formula of the model. Finally, training and testing cohorts from TCGA dataset were merged. The signature was validated in the entire cohort. A ROC curve, including clinical characteristics, was constructed, and the AUC was compared with the signature.
Univariate and multivariable Cox regression analyses were used to find out whether the risk score could serve as an independent prognostic factor. Clinical data, including age, gender, stage, T, M, N, were analyzed in combination with the risk score in both training and validation groups.
We further explored the DEGs between low- and high- risk groups in TCGA training cohort. Log2(|fold change|) ≥ 1 and FDR < 0.05 were considered the cutoff. GO function enrichment and KEGG pathway enrichment analysis were performed using "clusterProfiler" package. As indicated by previous literature, pyroptosis has some connections with immune response. Thus, we continued to calculate the scores of infiltrating immune cells and evaluate the activity of immune-related pathways by using the "gsva" package in R software.
Given that immune therapy is currently widely used for melanoma patients, we evaluated patients' response to anti-cytotoxic T lymphocyte antigen-4 (CTLA-4) and anti-programmed cell death protein 1 (anti-PD-1) antibodies by immunophenoscore. The immunophenoscore (obtained from https://tcia.at/) was developed by Charoentong et al. [18] and has been proven to be a superior predictor of response to immune therapies. Expressions of checkpoint molecules, including PD-1, PD-L1, PD-L2 and CTLA-4 were analyzed.
R (v 4.0.3) was used in statistical analysis. The expression difference between melanoma and normal samples was compared using single-factor analysis of variance. Kaplan-Meier method was used to compare the overall survival time between high and low risk patients. The univariate and multivariate Cox regression model was used to access the independent prognostic value of the model.
All pyroptosis-related genes were expressed differently between normal and tumor samples with P value < 0.05. Among them, 24 genes with Log2(|fold change|) ≥ 0.586 (fold change ≥ 1.5) were qualified for further studies. As shown in Figure 2A, 14 genes (ELANE, GSDMC, NLRP1, IL18, GSDMB, GSDMA, IL6, NOD2, PJVK, CASP4, NOD1, SCAF11, NLRP2, PLCG1) were downregulated, while 10 genes (CASP9, TNF, CASP3, IL1B, NLRP3, CASP5, NLRP6, NLRC4, NLRP7, AIM2) were up-regulated.

As shown in the forest plot (Figure 2B), in univariate Cox regression analysis, 9 genes were risk factors (HR > 1) while the others were protective factors (HR < 1). Among them, 16 genes met the preset threshold (P value < 0.05) and were included into further studies. A total of 14 intersected genes were qualified for further study (Figure 2C). PPI analysis and correlation network of these intersected genes are shown in Figure 2D and E. The PPI network revealed the potential connection between these intersected genes. The PPI network contained 14 nodes and 49 edges, with an average node degree of 7 (Figure. 2D). More degree of proteins interacted with each other indicated more critical roles. Among them, IL18 (11 interactions), AIM2 (10 interactions), CASP5 (10 interactions) and NLPR4 (10 interactions) were at the center of the network, indicating these genes may play an important role in cutaneous melanoma. Correlation network revealed the similar findings (Figure 2E).
After primary filtration, LASSO regression analysis was used to further narrow down the genes that may be put into the prognostic model. As shown in Figure 3A, B, eight genes (AIM2, CASP3, CASP5, GSDMA, GSDMC, IL18, NLRP6, NOD2) were identified according to the optimal lambda. Then, a stepwise multivariate Cox regression analysis was performed. Finally, a four-gene (GSDMA, GSDMC, AIM2, NOD2) signature was finally selected to construct a prognostic model. The risk score was calculated using the following formula: risk score = (0.038 × GSDMA exp.) + (0.310 × GSDMC exp.) + (−0.028 × AIM2 exp.) + (−0.437 × NOD2 exp.). According to the calculated risk score, patients in the training group were divided into the high-risk group (n = 155) and low-risk groups (n = 156) (Figure 3C). As shown in Figure 3D, more patients in the high-risk group were clustered at the bottom of the scatter diagram, which meant they had a shorter survival time. In the survival curve (Figure 3E), there were more deaths in the high-risk group than in the low-risk group. The prognostic capacity of the model was assessed by calculating the AUC of the ROC curve. It was found that the AUCs of the model were 0.680, 0.664 and 0.669 for 2-year, 3-year and 5-year survival (Figure 3F) respectively. In cox regression analyses (Figure 3G, H), the risk score had a significant relationship with OS both in univariate Cox regression and multivariate Cox regression. (HR = 1.083, 95% CI = 1.045−1.122, P < 0.001; HR = 1.082, 95% CI = 1.043−1.122, P < 0.001).

A total of 132 patients from TCGA dataset were set as the internal validation cohort, whose risk scores were calculated by using the same formula that was obtained from the training cohort and divided into the high-risk group (n = 62) and low-risk group (n = 62) (Figure 4A). Similarly, patients in the high-risk group had a much worse prognosis (Figure 4B, C). In addition, the AUC values were 0.703, 0.635 and 0.661 for 2-year, 3-year and 5-year survival (Figure 4D) respectively. In univariate and multivariate Cox regression analysis (Figure 4E, F), the risk score could serve as an independent prognostic factor after adjusting for confounding factors (HR = 1.393 95% CI = 1.157−1.676, P < 0.001; HR = 1.252, 95% CI = 1.023−1.533, P < 0.05 respectively). GSE65904 was set as the external validation cohort. Patients were divided into low-risk and high-risk groups based on the calculated risk scores (Figure 4G). The OS in the high-risk group was significantly poorer than it in the low-risk group (Figure 4H, I). AUC values from the ROC curves were 0.627, 0.649 and 0.622 for two, three, and five years, respectively. Then, TCGA training and testing cohorts were merged, the signature was validated in the entire cohort. Similar results were shown in Figures 5A-F. Specifically, the AUC values were 0.682, 0.665 and 0.673 for 2-year, 3-year and 5-year survival. These results indicated that the risk score could serve as an independent prognostic factor for melanoma patients.

A ROC curve of clinicopathological features (age, gender, stage, TMN stage) was shown in Figure 5G. The AUC of risk core was higher than the AUC of age (0.523), gender (0.528), stage (0.671), T (0.690) and M stage (0.517), and was very close to the AUC of N stage (0.701). As shown in Figure 5H, combined these clinical factors with the risk score could improve the AUC of prediction model to over 0.75. Specifically, a prediction model including risk score, T, and N was 0.794, indicating that the novel risk score significantly increased the predictive accuracy.

GO analysis and KEGG analysis were implemented based on the DEGs between high-risk and low-risk groups. In total, 1049 genes were identified by the preset criteria. Among them, 928 genes were down-regulated while 121 genes were up-regulated in the low-risk group. As shown in Figure 6A, the BP terms were mainly enriched in immune-related pathways, such as immune response-activating cell surface receptor signaling pathway and immune response-activating signal transduction. The CC term was mainly enriched on the external side of plasma membrane, immunoglobulin complex and plasma membrane signaling receptor complex. The MF term was also related to immune response, such as antigen binding, immunoglobulin receptor binding and immune receptor activity. The results of KEGG analysis are shown in Figure 6B. Most genes were enriched in cytokine-cytokine receptor interaction, cell adhesion molecules and chemokine signaling pathway.

Comparisons of the immune activity between the two groups in the entire TCGA cohort are shown in Figure 6C, D. Except mast cells, almost all the other types of cells were highly infiltrated in the low-risk group (all P value < 0.001). All immune pathways were significantly up-regulated in the low-risk group. Similar conclusions were drawn in the external validation group (Figure 6E, F).
Patient response to immune therapies was evaluated by immunophenoscore. As shown in Figure 7A-D, the IPS-PD1, IPS-CTL4 and IPS-PD1 and CTL4 were significantly higher in the low risk score group. Meanwhile, we evaluated the expression pattern of PD-1 (PDCD1), PD-L1 (CD274), PD-L2 (PDCD1LG2) and CTLA4 in melanoma patients. Unsurprisingly, both of them were highly expressed in the low risk score group (Figures 7E-H). These results indicated that patients with low risk score had a better opportunity for immune checkpoint inhibitors therapy.

In this study, we began by identifying differently expressed pyroptosis-related genes. Then, prognosis values of each gene were accessed by univariate Cox regression analysis. Intersected genes were included to perform LASSO regression analysis and multivariate Cox regression analysis to build a prognostic model in the training cohort. This model was further validated in the internal validation cohort and external validation cohort. The functional analyses showed that most DEGs were enriched in immune-related pathways. Immune cell infiltration and immune-related pathway analysis showed that the low-risk group had increased levels of infiltrating immune cells and increased activation of immune-related pathways. Patient response to immune therapies was evaluated and the results showed that patients with low risk score had a better opportunity for immune checkpoint inhibitors therapy.
Recently, molecular biomarkers have provided some insights into the prognosis-predicting process. A large number of genes have been proven to have prognostic potential. For example, higher expressions of Cytoplasmic Pin1 (Pin1) [19], Cell division cycle associated 8 (CDCA8) [20] and T-Box Transcription Factor Protein 21 (TBX21) [21] were believed to be related to poorer prognosis in SKCM. However, prognostic models based on single gene expression usually have low reliability. Thus, models based on specific features and biological functions, such as immune response [22] and metastasis [23], have become a hot spot in the process of predicting patients' survival. These models also further illustrated several underlying mechanisms of SKCM at the same time. In this study, we constructed a novel model based on pyroptosis-related genes which have not been fully illustrated in SKCM.
Pyroptosis is a form of programmed cell death (PCD), which is triggered by the activation of inflammasomes [24,25]. Inflammasomes were reported to have wide connections with defense of cells against infections, cell death, obesity and cancers [26]. Generally, inflammasomes contain an adaptor protein apoptosis-associated speck-like protein which is binding to caspase-1 and sensors which could recognize cell injury products. The sensors could be categorized into nucleotide−binding domain-like receptors (NLRs) and absent in melanoma 2 (AIM2)-like receptors (ALRs). Downstream of activating inflammasomes is activating caspase-1, IL-1β, IL-18 and cleaving proteins of gasdermin family, thus, result in the activation of pyroptosis [27]. During these years, the importance of inflammasomes in melanoma progression and treatment have been well illustrated. Al Emran et al. [25] compared the expression pattern of several inflammasome mediators and found that low expression of inflammasome mediators is associated with poor prognosis in melanoma. Segovia et al. [28] found that targeting transmembrane protein 176B could enhance the efficacy of immune checkpoint blockers by unleashing inflammasome activation. Ahmed et al. [29] reported that BRAFi resistant melanoma lines can be killed by activators of AIM2 and NLRP3 inflammasomes.
Pyroptosis bears some similarity with apoptosis (another form of PCD) such as DNA damage, nuclear condensation and caspase independence [30]. It also has some distinctive morphological features [5,24,31]. Firstly, membranes of pyroptostic cells remain intact while their DNAs have been fragmented. Therefore, these cells are positive to TUNEL staining. Secondly, inflammation-induced pore formation results in cell swelling and osmotic lysis. It seems that pyroptosis serves as a double-edged sword in tumor formation [5]. On one hand, leakage of cell contains is responsible for the inflammation microenvironment which is a promoter for tumor genesis [32]. On the other hand, as a form of PCD, pyroptosis can inhibit tumor formation and proliferation [33]. Given the role of pyroptosis in tumor, Ye et al. [13] built a prognostic model in ovarian cancer based on 34 pyroptosis-related genes. Unlike their findings, we found pyroptosis may be more critical to SKCM. Firstly, as shown in Figure 2B, almost all intersected genes were closely related to SKCM prognosis (threshold was set as P < 0.05). Secondly, the AUC of our model was 0.664 at 1 year, 0.666 at 2 years and 0.641 at 3 years. All of them were higher than in the model of ovarian cancer.
There were four genes included in the model, namely GSDMA, GSDMC, AIM2 and NOD2. GSDMA belongs to gasdermins protein family (GSDM), which is a group of pore-forming proteins [34]. In 2016, Ding et al. [35] reported the crystal structure of full length GSDMA. It adopts an auto-inhibited conformation, which means that the N-terminal domain is inhibited by the C-terminal domain. GSDMA functions as a pore-forming protein and is associated with the formation of oligomer on the membrane surface, known as the "pre-pore stage" in pyroptosis [36]. In humans, GSDMA is expressed in the esophagus, lower gastrointestinal tract, mammary gland and skin [37]. As indicated by Saeki et al. [38], it was a cell-growth inhibitor in gastric cancers (GC). However, some researchers [5] also reported that GSDMA was not expressed in normal colorectal epithelial cells and overexerted in carcinoma cells. In this study, we found an intriguing outcome related to the function of GSDMA in SKCM. Although it was down-regulated in melanoma samples, Cox regression analyses showed that the lower expression of GSDMA was associated with better survival states. This might have occurred for two reasons. Firstly, the expression of GSDMA might be affected by several factors, such as the cancer microenvironment, inflammatory and immune cell infiltration. Secondly, DEGs were filtered by combining TCGA and GTEx database for lack of normal samples. Given the limited data, the function of GSDMA still needs to be further studied. GSDMC, also known as MLZE, is isolated by Watabe et al. [39] It is also a member of GSDM family. In humans, GSDMC is expressed in the trachea, spleen and metastatic melanoma cells [39]. Hou et al. [40] noted that higher expression of GSDMC was correlated with poorer survival in breast cancer. The oncogene property of GSDMC was also noted in lung adenocarcinoma and colorectal cancer [41,42]. The function of GSDMC in tumors has been controversial because it is also down regulated in many esophageal and gastric cancer cells [38]. In this study, we found that higher expression of GSDMC was associated with poorer survival states, which is similar to Ito et al. [43] and Watabe et al. [39]. The mechanism by which GSDMC was down-regulated in tumor samples remains to be elucidated. Full name of AIM2 is absent in melanoma 2. It works as a cytosolic innate immune receptor by recognizing double-stranded DNA (dsDNA) released during cellular perturbation and pathogenic assault [44]. After recognition of dsDNA, AIM2 could lead the formation of inflammasome and induce pyroptosis. It is well illustrated that AIM2 played a double role in tumor formation and proliferation. Xu et al. [45] reported that AIM2 could inhibit colorectal cancer cell proliferation and migration. In contrast, Martínez-Cardona et al. reported that AIM2 deficiency reduced the development of hepatocellular carcinoma (HCC). Tumor promotion properties of AIM2 were also found in cutaneous squamous cell carcinoma [46]. In this study, we found that AIM2 was highly expressed however it was recognized as a protective factor in univariate Cox regression analysis. We speculated that this inconsistence was caused by the complex expression regulation. The role of AIM2 in melanoma patients still need further explorations. NOD2 is a member of intracellular NOD-like receptor family, which senses conserved motifs in bacterial peptidoglycan and induces pro-inflammatory and anti-microbial responses [47]. So far, the role of NOD2 in tumor formation has not been fully illustrated. NOD2 could serve as a protective factor in hepatocellular carcinoma [48,49]. However, Zhou et al. [50]. illustrated that hepatic NOD2 could promote hepatocarcinogenesis. NOD2 seems to be a tumor suppressor in melanoma. Fujimura et al. [51] reported that a synthetic NOD2 agonist could suppress melanoma growth. Our findings are similar to Fujimura et al. we also found NOD2 was down regulated in tumor samples and positively related to patients' survival. Although the prognostic model based on these four genes has achieved fair outcomes in training and validation groups, we still found some controversial findings in this study. We speculated that these contradictions are inevitable because the underlying mechanism and interactions between these genes are largely unknown. Further in-depth studies are still needed.
In this study, we divided patients into the high-risk and low-risk group and found that the differences between the two groups are mainly enriched in immune-related pathways. Surprisingly, we also found the levels of key antitumor infiltrating immune cells were higher in the low-risk group. Previous studies have proven that high infiltration of T cells, B cells and NK cells was a good prognosis factor for SKCM survival [52,53,54]. Except for the type Ⅱ IFN response pathway, other immune pathways were highly activated in the low-risk group. These findings indicated that pyroptosis might inhibit tumor malignance by activating immune response, which is similar to Zhang et al. [55] and Wang et al. [56] These two studies reported that tumor cells undergoing pyroptosis recruit tumor suppressed immune cells. Wang et al. [56] revealed that less than 15% tumor cell pyroptosis could clear entire grafted tumor in vivo studies. Another study conducted by Zhang et al. [55] indicated that CD8+ T cells and NK cells were infiltrated in a pyroptosis-activated immune microenvironment. In turn, CD8+ T cells and NK cells could induce tumor cell pyroptosis and form a positive feedback loop.
Pyroptosis could affect the efficacy of immune checkpoint inhibitors (ICIs) therapies. ICIs were a landscape of metastasis melanoma and significantly improved patients' survival. However, there are still patients who are resistant to ICIs, which was known as "cold" [57]. Wang et al. [56] reported that combined use of ICIs and pyroptosis inducers could effectively kill these "cold" cells. Currently, drugs targeted enhancing pyroptosis and immune response have shown great potential in tumor therapy. For example, Zhang et al. [58] reported that paclitaxel could induce pyroptosis by activating caspase-3/GSDME in lung cancer cells. Yue et al. [59] reported that anthocyanin could induce pyroptosis in oral squamous cell carcinoma. These pyroptosis inducers were also used in SKCM therapy [60−62]. The underlying mechanisms need to be further studied to provide more effective therapies for patients. Several biomarkers, including PD-1 CTLA-4 and T cell exhaustion genes could be used to predict the response to ICBs. PD-1 is one the critical checkpoint in T cells and B cells. After engagement with its ligands PD-L1 or PD-L2, PD-1 is activated, leading to the inhibition of T cell proliferation, activation and cytokine production [63]. Kleffel et al. [64] reported that melanoma cell-intrinsic PD-1 could promote tumor growth whereas PD-L1 inhibition or knockout of host-PD-L1 could attenuate growth of melanoma cells. CTLA-4 is also an inhibitor of T cell activation by binding to CD80 or CD86 on the surface of antigen-presenting cells (APCs) [65]. In 2010, ipilimumab (CTLA-4 blocker) [66] was approved for the treatment of advanced melanoma. Since then, numerous ICBs have been tested in clinical trials [67]. In this study, we found PD-1, PD-L1, PD-L2 and CTLA-4 were highly expressed in the low risk score group. Correspondingly, they are more sensitive to PD-1 blocker, CTLA-4 blocker and PD-1 and CTLA-4 blocker as indicated by immunophenoscore.
Undeniably, our studies shave several limitations. Firstly, this model was established based on TCGA training database and validated in one internal cohort and one external cohort. Consequently, high quality external validation cohorts are needed to test these findings. Secondly, the mechanisms of pyroptosis in SKCM need to be further explored. Even with these limitations, our study had several potential implications in patients' survival prediction.
In conclusion, our study demonstrated that pyroptosis was closely related to SKCM. Almost all pyroptosis related genes were differently expressed between SKCM and normal tissues. The risk score based on this model could serve as an independent prognosis-predicting factor. DEGs between high-risk and low-risk groups were mainly enriched in immune-related pathways and more immune cells were infiltrated in low-risk group patients. In addition, patients with low risk score had a better opportunity for immune checkpoint inhibitors therapy. Our study provided an insight into the function and prognostic value of pyroptosis in SKCM.
The authors declare no competing interests
| [1] | World Resource Institute, 2007. Available from: http://www.wri.org/publication/wri-annualreport-2006–2007 (accessed on 21 April 2015). |
| [2] | Bao LJ, Maruya KA, Snyder SA, et al. (2012) China’s water pollution by persistent organic pollutants. Environ Pollut 163: 100-108. |
| [3] |
Li H, Li Y, Lee MK, et al. (2015) Spatiotemporal analysis of heavy metal water pollution in transitional China. Sustainability 7: 9067-9087. doi: 10.3390/su7079067

|
| [4] |
Li Y, Li H, Liu Z, et al. (2016) Spatial Assessment of Cancer Incidences and the Risks of Industrial Wastewater Emission in China. Sustainability 8: 480. doi: 10.3390/su8050480
|
| [5] | Zhang R, HamerlinckJD, Gloss SP, et al. (1996) Determination of Nonpoint-Source Pollution Using GIS and Numerical Models. J Environ Qual 25: 411-418. |
| [6] |
Ebenstein A (2012) The consequences of industrialization: Envidence from water pollution and digestive cancers in China. Rev Econ Stat 94: 186-201. doi: 10.1162/REST_a_00150
|
| [7] | National Academy of Sciences, 2007. Available from: https://www.koshland-science-museum.org/water/html/en/Treatment/Agricultural-and-Industrial-Pollution-in-China.html. |
| [8] | Chen S (2015) Beijing drinking water reservoir had lead levels’20 times WHO standard’ for at least three years. Available from: http://www.scmp.com/news/china/article/1839337/beijing-drinking-water-reservoir-found-contain-levels-lead-20-times-who. |
| [9] | Meng W, Qin Y, Zhang B, et al. (2008) Heavy metal pollution in Tainjin Bohai Bay, China. J Environ Sci 7: 814-819. |
| [10] | Huang F, Wang X, Lou L, et al. (2010) Spatial Variation and source apportionment of water pollution in Qiantang River (China) using statistical techniques. Water res 44: 1562-1572. |
| [11] | Jiang J, Wang P, Lung W, et al. (2012) A GIS-based generic real-time risk assessment framework and decision tools for chemical spills in the river basin. J Hazard Mater 227: 280-291. |
| [12] | Sheng J, Wang X, Gong P, et al. (2012) Heavy metals of the Tibetan top soils. Environ Sci Pollut Res 19: 3362-3370. |
| [13] | Wang Y, Wang P, Bai Y, et al. (2013) Assessment of surface water quality via multivariate statistical techniques: A case study of the Songhua River Harbin region, China. J Hydro-environ Res 7: 30-40. |
| [14] | Coskun HG, Gulergun O, Yilmaz L (2006) Monitoring of protected bands of Terkos drinking water reservoir of metropolitan Istanbul near the Black Sea coast using satellite data. Int J Appl Earth Observ Geoinfor 8: 49-60. |
| [15] | Asadi SS, Vuppala P, Anji Reddy M (2007) Remote Sensing and GIS Techniques for Evalution of Groundwater Quality in Municipal Corporation of Hyderabad (Zone-V), India. Int J Environ Res Public Health 4: 45-52. |
| [16] | Satapathy DR, Salve PR, Katpatal YB (2009) Spatial distribution of metals in ground/surface waters in the Chandrapur district (Central India) and their plausible sources. Environ Geol 56: 1323-1352. |
| [17] |
Dede OT, Telci IT, Aral MM (2013) The use of water quality index models for the evaluation of surface water quality: a case study for Kirmir Basin, Ankara, Turkey. Water Qual, Expos Health 5: 41-56. doi: 10.1007/s12403-013-0085-3
|
| [18] | Wang M, Webber M, Finlayson B, et al. (2008) Rural industries and water pollution in China. J Environ Manage 86: 648-659. |
| [19] |
Ou Y, Wang X (2008) Identification of critical source areas for non-point source pollution in Miyun reservoir watershed near Beijing, China. Water Sci Technol 58: 2235-2241. doi: 10.2166/wst.2008.831
|
| [20] |
Wang X, Wang Y, Li T, et al. (2002) Characteristics of non-point source pollution in the watershed of Miyun Reservoir, Beijing, China. Chinese J Geochem 21: 89-96. doi: 10.1007/BF02838057
|
| [21] |
Wang X, Ou Y, Dou P, et al. (2009) Relationship between the variation of water quality in rivers and the characteristics of watershed at Miyun, Beijing, China. Chinese J Geochem 28: 112-118. doi: 10.1007/s11631-009-0112-z
|
| [22] |
Zhu X, Ji H, Chen Y, et al. (2013) Assessment and sources of heavy metals in surface sediments of Miyun Reservoir, Beijing. Environ monitor assess 185: 6049-6062. doi: 10.1007/s10661-012-3005-2
|
| [23] | Li Z, Li X, Xu Z (2010) Impacts of water conservancy and soil conservation measures on annual runoff in the Chaohe River Basin during 1961–2005. J GeographSci 20: 947-960. |
| [24] |
Zhao H, Li X, Wang X, et al. (2010) Grain size distribution of road-deposited sediment and its contribution to heavy metal pollution in urban runoff in Beijing, China. J hazard mater 183: 203-210. doi: 10.1016/j.jhazmat.2010.07.012
|
| [25] | Foster JA, McDonald AT (2000) Assessing pollution risks to water supply intakes using geographical information systems (GIS). Environ Model Software 15: 225-234. |
| [26] | Yang T, Liu J (2012) Health Risk Assessment and Spatial Distribution Characteristic on Heavy Metals Pollution of Haihe River Basin. J Environ Analy Toxicol 2: 152. |
| [27] | Soil and Water Assessment Tool, SWAT. Available from: http://swat.tamu.edu/ |
| [28] | Zhang J, Mauzerall D, Zhu T, et al. (2010) Environmental health in China: progress towards clean air and safe water. Lanset 375: 1110-1119. |
| [29] | Liu Q, Xie W, Xia J (2013) Using Semivariogram and Moran’s I Techniques to Evaluate Spatial Distribution of Soil Micronutrients. Commun Soil Sci Plan 44: 1182-1192. |
| [30] | Lee CC, Chiu YB, Sun CH (2010) The environmental Kuznets curve hypothesis for water pollution: Do regions matter? Energy Policy 38: 12-23. |
| [31] | Liu J, Zhang X, Tran H, et al. (2011) Heavy metal contamination and risk assessment in water, paddy soil, and rice around an electroplating plant. Environ Sci Pollut Res 18: 1623-1632. |
| [32] |
Zhou F, Guo H, Liu Y, et al. (2007) Identification and spatial patterns of coastal water pollution sources based on GIS and chemometric approach. J Environ Sci 19: 805-810. doi: 10.1016/S1001-0742(07)60135-1
|
| [33] | Murphy RR, Curriero FC, Ball WP (2009) Comparison of spatial interpolation methods for water quality evaluation in the Chesapeake Bay. J Envirol Engineer 136: 160-171. |
| [34] | Schwarzenbach RP, Egli T, Hofstetter TB, et al. (2010) Global water pollution and human health. Annu Rev Environ Resour 35: 109-136. |
| [35] |
Alexander RB, Boyer EW, Smith RA, et al. (2007) The role of headwater streams in downstream water quality. JAWRA J Am Water Resour Assoc 43: 41-59. doi: 10.1111/j.1752-1688.2007.00005.x
|
| [36] | Liu Z, Li Y, Li Z (2009) Surface water quality and land use in Wisconsin, USA- a GIS approach. J Integr Environ Sci 6: 69-89. |
| [37] | Huang W, Liu H, Luan Q, et al. (2008) Detection and prediction of land use change in Beijing based on remote sensing and GIS. The Intern Archi of the Photogram, Rem Sens and Spat Inform Sci 37: 75-82. |
| [38] | China. ORG. CN. China’s Political system, 2013. Available from: http://www.china.org.cn/english/Political/28842.htm |
| [39] | Li S (2013) All Five of Beijing’s Major Water Systems Seriously Polluted. Available from: http://www.theepochtimes.com/n3/251030-all-five-of-beijings-major-water-systems-seriously-polluted/. |
| [40] | United States Geological Survey, 2008. Available online: http://earthexplorer.usgs.gov/ |
| [41] | Yearbook CS, China Statistical Yearbook; Beijing, China, 2015. |
| [42] | The Central People’s Government of the People’s Republic of China, The People’s Republic Of China Yearbook, 2005. Available from: http://www.gov.cn/test/2005-07/27/content_17403.htm. |
| [43] |
Wang C, Bentivegna DJ, Smeda RJ, et al. (2010) Comparing classification approaches for mapping cut-leaved teasel in highway environments. Photogramm Eng Rem S 76: 567-575. doi: 10.14358/PERS.76.5.567
|
| [44] |
Rozenstein O, Karnieli A (2011) Comparison of methods for land-use classification incorporating remote sensing and GIS inputs. Appl Geogr 31: 533-544. doi: 10.1016/j.apgeog.2010.11.006
|
| [45] | Sina News, 2016. Available from: http://news.sina.com.cn/green/roll/2016-08-24/doc-ifxvcsrn9082407.shtml |
| 1. | Jiayi Yu, Ye Tao, Huan Zhang, Zhibiao Wang, Wenhua Cui, Tianwei Shi, Age estimation algorithm based on deep learning and its application in fall detection, 2023, 31, 2688-1594, 4907, 10.3934/era.2023251 | |
| 2. | Ayan Bin Rafaih, Kaso Ari, Artificial Intelligence-Driven Approaches to Managing Surgeon Fatigue and Improving Performance, 2024, 2168-8184, 10.7759/cureus.75717 | |
| 3. | Yanfan Duan, Zheng Li, Yanchen Gao, Diancai Yang, 2024, Lightweight YOLOv8n with Cross-Scale Feature Fusion for Driver Fatigue Detection, 979-8-3503-6828-4, 191, 10.1109/ICHCI63580.2024.10808105 | |
| 4. | Shanmeng Zhao, Yaxue Peng, Yaqing Wang, Gang Li, Mohammed Al-Mahbashi, Lightweight YOLOM-Net for Automatic Identification and Real-Time Detection of Fatigue Driving, 2025, 82, 1546-2226, 4995, 10.32604/cmc.2025.059972 |
Figures(7) / Tables(5)

Huixuan Li, Cuizhen Wang, Yuqin Jiang, Andrew Hug, Yingru Li. Spatial assessment of sewage discharge with urbanization in 2004–2014, Beijing, China[J]. AIMS Environmental Science, 2016, 3(4): 842-857. doi: 10.3934/environsci.2016.4.842

 DownLoad:
