Review Special Issues

A review of emerging design concepts in applied microgrid technology

  • Received: 06 May 2022 Revised: 16 June 2022 Accepted: 28 June 2022 Published: 07 July 2022
  • Most of the research in distributed generation focuses on power flow optimization and control algorithm development and related fields. However, microgrids are evolving on multiple levels with respect to the chemical processes used to manufacture the underlying technologies, deployment strategies, physical architecture (which is important to the economic factor) as well as environmental impact mitigation of microgrids. Special use cases and paradigms of deploying Distributed Generation (DG) in harmony with agricultural or decorative purposes for existing spaces are emerging, propelled by research in frontiers that the DG engineer would benefit from being aware of. Also, offshore photovoltaic (PV) has emerged as an increasingly important research area. Many nascent technologies and concepts have not been techno-economically analyzed to determine and optimize their benefits. These provide ample research opportunities from a big-picture perspective regarding microgrid development. This also provides the avenue for research in distributed generation from a physical integration and space use perspective. This study reviews a selection of developments in microgrid technology with the themes of manufacturing technology, optimal deployment techniques in physical spaces, and impact mitigation approaches to the deployment of renewable energy from a qualitative perspective.

    Citation: Paul K. Olulope, Oyinlolu A. Odetoye, Matthew O. Olanrewaju. A review of emerging design concepts in applied microgrid technology[J]. AIMS Energy, 2022, 10(4): 776-800. doi: 10.3934/energy.2022035

    Related Papers:

    [1] Moses Khumalo, Hopolang Mashele, Modisane Seitshiro . Quantification of the stock market value at risk by using FIAPARCH, HYGARCH and FIGARCH models. Data Science in Finance and Economics, 2023, 3(4): 380-400. doi: 10.3934/DSFE.2023022
    [2] Samuel Asante Gyamerah, Collins Abaitey . Modelling and forecasting the volatility of bitcoin futures: the role of distributional assumption in GARCH models. Data Science in Finance and Economics, 2022, 2(3): 321-334. doi: 10.3934/DSFE.2022016
    [3] Nitesha Dwarika . Asset pricing models in South Africa: A comparative of regression analysis and the Bayesian approach. Data Science in Finance and Economics, 2023, 3(1): 55-75. doi: 10.3934/DSFE.2023004
    [4] Kasra Pourkermani . VaR calculation by binary response models. Data Science in Finance and Economics, 2024, 4(3): 350-361. doi: 10.3934/DSFE.2024015
    [5] Alejandro Rodriguez Dominguez, Om Hari Yadav . A causal interactions indicator between two time series using extreme variations in the first eigenvalue of lagged correlation matrices. Data Science in Finance and Economics, 2024, 4(3): 422-445. doi: 10.3934/DSFE.2024018
    [6] Katleho Makatjane, Ntebogang Moroke . Examining stylized facts and trends of FTSE/JSE TOP40: a parametric and Non-Parametric approach. Data Science in Finance and Economics, 2022, 2(3): 294-320. doi: 10.3934/DSFE.2022015
    [7] Kazuo Sano . Intelligence and global bias in the stock market. Data Science in Finance and Economics, 2023, 3(2): 184-195. doi: 10.3934/DSFE.2023011
    [8] Tahir Afzal, Muhammad Asim Afridi, Muhammad Naveed Jan . Integrating LSTM with Fama-French six factor model for predicting portfolio returns: Evidence from Shenzhen stock market China. Data Science in Finance and Economics, 2025, 5(2): 177-204. doi: 10.3934/DSFE.2025009
    [9] Obinna D. Adubisi, Ahmed Abdulkadir, Chidi. E. Adubisi . A new hybrid form of the skew-t distribution: estimation methods comparison via Monte Carlo simulation and GARCH model application. Data Science in Finance and Economics, 2022, 2(2): 54-79. doi: 10.3934/DSFE.2022003
    [10] Changlin Wang . Different GARCH model analysis on returns and volatility in Bitcoin. Data Science in Finance and Economics, 2021, 1(1): 37-59. doi: 10.3934/DSFE.2021003
  • Most of the research in distributed generation focuses on power flow optimization and control algorithm development and related fields. However, microgrids are evolving on multiple levels with respect to the chemical processes used to manufacture the underlying technologies, deployment strategies, physical architecture (which is important to the economic factor) as well as environmental impact mitigation of microgrids. Special use cases and paradigms of deploying Distributed Generation (DG) in harmony with agricultural or decorative purposes for existing spaces are emerging, propelled by research in frontiers that the DG engineer would benefit from being aware of. Also, offshore photovoltaic (PV) has emerged as an increasingly important research area. Many nascent technologies and concepts have not been techno-economically analyzed to determine and optimize their benefits. These provide ample research opportunities from a big-picture perspective regarding microgrid development. This also provides the avenue for research in distributed generation from a physical integration and space use perspective. This study reviews a selection of developments in microgrid technology with the themes of manufacturing technology, optimal deployment techniques in physical spaces, and impact mitigation approaches to the deployment of renewable energy from a qualitative perspective.


    The risk-return relationship topic has been studied from as early as the 1950s, with growing enthusiasm to date (Ma et al. 2020). The foremost model used to capture the risk premium is the Generalized Autoregressive Conditional Heteroscedasticity-in-Mean (GARCH-M) by Engle et al. (1987). The GARCH approach, originated by Engle (1982), assumes that price data and innovations follow a normal distribution. However, such an assumption is based on "simplicity and convenience" because in the real world, the nature of the financial market is subject to nonlinear properties, such as asymmetric volatility and asymmetric effects (Kuang, 2020; Ayed et al. 2020). As a result, the standard GARCH model evolved to asymmetric GARCH models such as EGARCH, APARCH and GJR, to capture asymmetric volatility and the asymmetric effects - volatility feedback and the leverage effect. While the GARCH approach has the ability to capture the volatile nature of financial data, the model is unable to effectively capture asymmetry, as sufficed by Mangani (2008), Mandimika and Chinzara (2012), Ilupeju (2016), Naradh et al. (2021) and Dwarika et al. (2021).

    Another extension that has gained popularity over the years, to assist with capturing asymmetry, is the combination of GARCH models with various innovation distributions (Delis et al. 2021; Kuang, 2020). According to Alqaralleh et al. (2020), innovation distributions that capture the empirical nature of returns, such as higher moment properties, skewness and excess kurtosis, make "excellent tools" in the estimation of accurate forecasts. While there is existing literature on different probability distributions, only one study by Delis et al. (2021), to the best of the authors knowledge, applied a different distribution to investigate the risk-return relationship. Drawn from Ma et al. (2020) and Tsay (2013), a reason for the lack of literature is the limited ability to manipulate the modelling of the time-varying risk-return relationship. According to Tsay (2013), when modelling the GARCH approach in R, if the model is invalid by failing to converge or is insignificant, the mean and/ or constant can be dropped to make the model valid. Since the GARCH-M, as the name suggests, contains the risk premium within the mean, it cannot be dropped (Ma et al. 2020; Tsay, 2013). Hence, this presents a gap in literature for the exploration of different innovation distributions with the GARCH-M approach to investigate the risk-return relationship.

    By targeting this specific issue, this can improve the overall efficiency of the risk estimation ability of the GARCH approach. The problem statement is that due to the GARCH modelling assumption of normality, the risk-return relationship is underestimated, leading to inaccurate forecasts. This is especially relevant in the case of an emerging market, such as South Africa, which is subject to heavy tails due to high and persistent levels of market volatility (Dwarika et al. 2021; Naradh et al. 2021). At the same time, such a market presents "huge investment opportunities" for investors that seek a superior return (Ayed et al. 2020). In other words, the higher the risk taken, the higher the expected rate of return. The relationship between risk and return provides valuable information to structure investment strategies, assist budget plans and allocate resources. Given the wide use of the GARCH approach in risk management, as documented by Saddah and Sitanggang (2020) and Ayed et al. (2020), acknowledging and implementing improvements in stochastic volatility models can improve forecast accuracy and lead to more financially sound decisions.

    There is no existing study, to the best of the authors knowledge, that has conducted a comparative analysis of different innovation distributions in the context of the GARCH-M approach. Therefore, the aim of this study is to investigate the optimal GARCH-M model and innovation distribution, to determine the risk-return relationship. Hence, the primary aim is to determine the optimal GARCH-M type model to investigate the risk-return relationship. The secondary aim is to find an innovation distribution to optimize the GARCH-M tails, i.e., optimally capture risk. To ensure optimal model diagnostics, this study follows the international standard procedure, established by the regulatory framework - the Basel Accords. The Basel Accord I recommends Value at Risk (VaR) and backtesting methods to ensure the GARCH model's efficiency (Ayed et al. 2020; Kuang, 2020). VaR computes the maximum loss of a portfolio over a specific period of time for a given confidence interval (Kuang, 2020). The backtesting procedure is used to test whether the actual losses are in line with the forecasted values (Ayed et al. 2020). Essentially, it is used as a tool to determine the optimal forecast power of the VaR estimates.

    This study consists of five sections. First, the Introduction provides an overview of the background and what this study aims to achieve. Second, the Literature Review outlines existing South African studies on the GARCH-M approach with different innovation distributions and then extends to international work. This section is concluded by identifying gaps found in the body of literature. Third, the Methodology covers the data, GARCH type models and innovation distributions employed in this study. Fourth, the Empirical Results and Discussion consist of the implications of the results alongside the model output. Finally, the key findings of this study are summed up in the Conclusions.

    According to Markowitz (1952), risk and return hold a positive and linear relationship in theory. Therefore, when an investor makes an investment in an emerging market that is characterized by high-risk, the investor expects a higher rate of potential return, in compensation for investing in a volatile environment that does not guarantee a superior return. However, early studies by Mangani (2008), Mandimika and Chinzara (2012) and Adu et al. (2015) found no risk-return relationship in the largest South African stock market at the time - the Johannesburg Stock Exchange (JSE). All three studies employed the GARCH approach, but found limitations in the model's ability to efficiently capture risk, especially by the model's innovations.

    Dwarika et al. (2021) consolidated several limitations of the GARCH approach. The study analyzed the daily JSE All Share Index (ALSI) returns for the sample period from 15 October 2009 to 15 October 2019. The models employed were GARCH (1, 1), EGARCH, GJR and APARCH, with the standard normal (NORM), Student-t (Stud-t), Skewed Student-t (Skew-t) and the Generalized Error distribution (GED). The study found EGARCH to be the optimal model, but the innovations showed that asymmetry remained uncaptured, in line with Mangani (2008), Mandimika and Chinzara (2012) and Ilupeju (2016). While the overall finding was a positive risk-return relationship, contrasting results were found for the Skew-t distribution, as GARCH-M found no relationship, whereas EGARCH-M found a positive relationship. Emenogu et al. (2020) also found that the Skew-t performance varied with the different GARCH models. Thus, this inconsistency highlighted the significance of the innovation distribution choice, as it has the ability to affect parameter estimation.

    Ayed et al. (2020) investigated the optimal GARCH model and innovation distribution by analyzing daily data, over the sample period from 10 August 2006 to 14 December 2014, of the Islamic stock market. The study employed the standard GARCH and APARCH with the distributions - the NORM, Stud-t and Skew-t. The study found APARCH and the Skew-t to be optimal. From the VaR and backtesting procedure, at a 99% level of VaR, the Stud-t and Skew-t were optimal, whereas for a 95% VaR, the forecast of NORM was more robust. However, the GARCH (1, 1) is critiqued by Saddah and Sitanggang (2020) for underestimating risk. This is because a simple GARCH model is unable to effectively capture higher moment properties (Mandimika and Chinzara, 2012; Kuang, 2020). Similarly, applying GARCH type models with the conventional and normal type distributions, to a volatile emerging market, is considered ineffective (Ayed et al. 2020; Bautista and Mora, 2020; Saddah and Sitanggang, 2020). Thus, other asymmetric properties need to be taken into account.

    For instance, Delis et al. (2021) found a positive risk-return relationship, in line with theoretical expectations, confirming the significance of accounting for skewness to assist with capturing asymmetry. The authors modelled the daily returns of the S & P500 index, over the sample period from 02 January 1980 to 14 October 2020, using GARCH-M with a Skewed GED. The study concluded that skewness is vital in the estimation of the risk-return relationship, especially during periods of excess volatility such as the COVID-19 pandemic. However, Khan et al. (2021) investigated the recent effects of the pandemic on the Indian stock market using a different approach, namely, the Extreme Value Theory (EVT). This approach specifically focuses on tail behavior, where extreme events such as the 2008 financial crisis and COVID-19 occur. Khan et al. (2021) used the Generalized Pareto distribution (GPD) to model the high-frequency 5-min data of the NIFTY 50 returns for the sample period 11 March 2020 to 30 September 2020. During the pandemic, it was found that returns dropped by 9%, and that 5% of the data was above the specified threshold, indicating an asymmetric return distribution, in line with empirical expectations. Khan et al. (2021) concluded the efficiency of the GPD in the field of EVT to provide useful information during the period of a crisis.

    In contrast, Kuang (2020) found that the Pearson Type Ⅳ distribution (PIVD) outperformed the Stud-t, Generalized Extreme Value distribution (GEVD) and GPD using VaR. The GEVD is another innovation distribution from the EVT. The PIVD is flexible due to its ability to account for higher moment properties, particularly skewness and excess kurtosis. The author analyzed the daily data of the indices S & P500, FTSE100, CAC40, and DAX30 from 03 May 2002 to 31 December 2009. The study concluded the superiority of the PIVD in capturing skewness, which affects the accuracy of risk estimation, in line with Delis et al. (2021). Although not investigated in the study by Kuang (2020), the author mentioned another robust distribution, the Stable distribution, which accounts for heavy tails, skewness and excess kurtosis. Bautista and Mora (2020) applied VaR to the oil sector using GARCH with the distributions - NORM, Generalized Stud-t and Stable. The authors found that the NORM underperformed because the oil returns followed a heavy-tailed distribution. The Generalized Stud-t was more optimal than the NORM, but overall Stable was the most robust distribution, in line with Ilupeju (2016), Bautista and Mata (2020) and Naradh et al. (2021).

    In conclusion, it can be noted that there are two major research gaps in literature. Firstly, the South African studies are limited to the conventional innovation distributions: NORM, Stud-t, Skew-t and GED, in the context of the risk-return relationship, as sufficed by Mangani (2008), Mandimika and Chinzara (2012) and Dwarika et al. (2021). While the Stud-t, Skew-t and GED can account for some degree of asymmetry, it is vital to consider more flexible distributions that can take into account heavy tails and other higher moment properties such as skewness and excess kurtosis. In turn, this will enhance the risk efficiency of the GARCH approach and improve the forecast accuracy of the risk-return relationship. Secondly, only one existing study by Delis et al. (2021), investigated the GARCH-M with a different innovation distribution - the Skewed GED. A possible reason for the lack of literature is due to limited model manipulation arising from software constraints. To overcome this limitation, it would be advisable to investigate several GARCH type models. In line with international literature, this study extends to the VaR and backtesting procedure since none of the South African studies employed this international regulatory framework, in the context of the GARCH-M approach.

    Figure 1 shows a flow chart diagram of the methodology employed in this study to determine the optimal GARCH-M and innovation distribution.

    Figure 1.  Methodological steps to find the optimal GARCH-M and innovation distribution.
    Source: Authors own

    The JSE ALSI market returns are modelled by the GARCH-M (1, 1) type models - standard GARCH, GJR, EGARCH and APARCH with the innovation distributions: NORM, Stud-t, Skew-t and GED. The optimal GARCH-M model is selected by information criteria. The innovations are then extracted to determine if risk remains uncaptured by the "risk check". If risk remains uncaptured, the more robust innovation distributions are employed: PIVD, GEVD, GPD and Stable. Model diagnostics are used to determine if the distributions are adequate in capturing asymmetry. Thereafter, the VaR and backtesting methods are employed to determine the optimal innovation distribution.

    Following Dwarika et al. (2021) and Naradh et al. (2021), this study will obtain the daily price data of the JSE ALSI from the Integrated Real-time Equity System (IRESS) database, previously known as the McGregor Bureau for Financial Analysis (BFA). The IRESS database is a reliable source of obtaining data and is hosted on the IRESS Research Domain, where market data is available for financial analysis and academic research purposes (IRESS, 2022).

    Following Emenogu et al. (2020), this study investigates a duration of 17 years made up of a total of 4251 observations. The updated sample period analyzed is from 05 October 2004 to 05 October 2021. This period included the 2008 financial crises and COVID-19 pandemic. These are global economic events, but more importantly, extreme events that affect tail behavior which this study takes into account, in line with Kuang (2020) and Khan et al. (2021).

    Following Dwarika et al. (2021), the risk-free rate proxy is the South African T-bill, which shall be obtained from the South African Reserve Bank (SARB). The ALSI price data is converted to returns by Rm=ln(P­tPt1)­, where Rm = market returns and Pt = share price for the current day t and Pt1 = share price for the previous day t1. The annual risk-free rate is converted to a daily value by Daily Rf=(1+yearly Rf)(1365)1, given by Brooks (2014). Excess returns are computed as the difference between market returns and the risk-free rate (Delis et al. 2021).

    Following convention in literature, the data is tested for stationarity to ensure a valid time series, by employing the Augmented Dickey-Fuller (ADF), Phillips-Perron (PP) and Kwiatkowski, Phillips, Schmidt and Shin (KPSS) test. The data is also tested for normality and heteroscedasticity to show the asymmetric nature of returns. Thus, substantiating the employment of the GARCH extensions which can account for such higher moment properties and consequentially improve forecast accuracy.

    Following Dwarika et al. (2021), Naradh et al. (2021), Ilupeju (2016) and Mandimika and Chinzara (2012), the foremost GARCH-M type models are estimated by the Maximum Likelihood (ML) method, in combination with the four conventional innovation distributions: NORM, Stud-t, Skew-t and GED. The GARCH-M models follow the mean model of the standard GARCH by Engle (1982):

    yt=μ+pj=1δjσ2tj+ut (1)

    where yt = conditional mean, μ = constant, δj = risk premium, σ2tj = variance and ut = innovation term.

    The conditional variance of the asymmetric GARCH-M models is listed respectively. GJR by Glosten et al. (1993):

    σt2=α0+qi=1αiu2t1+pj=1βjσ2tj+γu2t1It1 (2.1)

    where α0 = constant term, u2t1 = squared lagged innovation term, α1 = ARCH effect (short-term volatility persistence), βj = GARCH effect (long-term volatility persistence), γ = asymmetry parameter (to capture asymmetric volatility and asymmetric effects) and It1 = interaction variable (accounts for positive and negative shocks).

    EGARCH by Nelson (1991):

    ln(σt2)=α0+qi=1αi[|ut1|E|ut|]+pj=1βjln(σ2tj)+γut1 (2.2)

    where α1[|zt1|E|zt|] = magnitude of the innovation and γzt1 = sign effect (accounts for positive and negative shocks).

    APARCH by Ding et al. (1993):

    σδt=α0+pi=1αi(|uti|γiu­ti)δ+qj1βjσδtj (2.3)

    where δ = is an exponent that allows the APARCH model to take on several GARCH models. For example, in this study, the GJR-GARCH is implemented by setting δ of the APARCH model to 2, in line with Tsay (2013).

    The optimal GARCH-M is selected by model diagnostics, information criteria, Akaike Information Criterion (AIC) and the Bayesian Information Criterion (BIC), following standard literature. The standardized innovations of the optimal GARCH-M and innovation distribution are then extracted.

    Following Dwarika et al. (2021), which built on Mangani (2008), Mandimika and Chinzara (2012) and Ilupeju (2016), the standardized innovations of the optimal GARCH-M are tested for normality, heteroscedasticity and randomness by a framework of preliminary tests. This study will formalize such testing as a "risk check" to determine the extent of uncaptured risk, more specifically, due to which property of risk is being underestimated (the asymmetric, volatile or random nature of the innovations). Table 1 shows the "risk check" framework.

    Table 1.  Risk check.
    Test Name Abbreviation
    Normality Shapiro-Wilk SW
    Jarque-Bera JB
    Anderson-Darling AD
    Heteroscedasticity Ljung-Box LB2
    Autoregressive Conditional
    Heteroscedastic-Lagrange Multiplier
    ARCH-LM
    Randomness Bartels rank Bartels rank
    Cox-Stuart Cox-Stuart
    Brock, Dechert and Scheinkman BDS
    Source: Authors own formalization

     | Show Table
    DownLoad: CSV

    Based on the aforementioned South African studies, the GARCH-M model's innovations are expected to show uncaptured risk, to substantiate the application of the more robust probability distributions: PIVD, GEVD, GPD and Stable. Following Bautista and Mora (2020), Bautista and Mata (2020), Naradh et al. (2021) and Ilupeju (2016), the innovation distributions are estimated by the ML method.

    According to Kuang (2020), the PIVD is described as flexible due to its ability to account for higher moment properties, particularly skewness. The PIVD is given as:

    f(x)=k(m,ν,θ)(1+(xλθ)2)mexp[νtan1(xλθ)],(m>12) (3)

    where λ = location, θ = scale, k = normalization constant, m = kurtosis and ν = skewness.

    The location parameter λ is the mean and the scale θ is the standard deviation. The scale determines the width, whereas the location represents the shift of the mode of the distribution. The sign indicates the direction in which the distribution shifted. For example, if positive, then the distribution is shifted to the right. The purpose of the normalization constant k is to ensure the function is a probability distribution function.

    In the context of this study, focus is placed on the higher moment properties of the distributions. The kurtosis parameter m controls the tail thickness, where low values indicate thin tails and large values indicate heavy tails. Specifically, values more than 2.5 indicate heavy tails (Ilupeju, 2016). The direction of skewness is indicated by the sign of the parameter ν, where ν>0 is positively skewed and ν<0 is negatively skewed (Kuang, 2020).

    The aim of the EVT is to examine the behavior of outliers (extreme values) of a random variable. The advantage is that focus is placed on tail behavior instead of the entire distribution (Echaust and Just, 2020). Such an approach is relevant, given the recent COVID-19 pandemic, as sufficed by Omari et al. (2020), Khan et al. (2021) and Delis et al. (2021).

    Following Echaust and Just (2020), Kuang (2020) and Khan et al. (2021), the EVT is characterized by two modelling approaches, the Block Maxima Model (BMM) and Peaks Over Threshold (POT). The POT approach uses a predetermined threshold to determine extreme values, whereas the BMM chooses a maximum value for a given block which is defined as a specified period of time. The GEVD falls under the BMM, whereby the innovations are divided into equal lengths, representing consecutive blocks. The maximum innovation values are then selected from each block. The choice of block size is vital as a small value can indicate estimation bias, whereas a large value can result in estimation variance. A block value of five or ten is sufficient to ensure accurate results (Ilupeju, 2016). Echaust and Just (2020) give the GEVD as:

    f(x)={θ1exp(xλθ)exp(exp(xλθ)),ξ=0,θ1(1+ξ(xλθ))1ξ1exp((1+ξ(xλθ))ξ1),ξ0. (4)

    where λ = location, θ = scale and ξ = shape.

    The shape ξ, also known as the tail index, describes the nature of the distribution. If ξ<0, this indicates a Weibull distribution, a short-tailed distribution defined as having a finite right tail. If ξ>0, the distribution is a Frechet type (inverse Weibull distribution) that is heavy-tailed, where examples include Stud-t and Stable. If ξ=0, this indicates a thin-tailed distribution such as NORM and log-NORM.

    Following Khan et al. (2021), model diagnostics in the form of normality tests are employed to determine whether the GEVD is an adequate fit for the innovations. This study employs the Anderson Darling (AD) test, probability plot (PP), quantile-quantile (QQ) plot, return level plot and density plot. The AD normality test focuses on tail behavior. If the AD test statistic is greater than the critical value, the null hypothesis that the innovations are normally distributed can be rejected. With respect to the plots, a major deviation between the empirical and theoretical distribution, would indicate nonnormality, thus an inadequate fit of the GEVD.

    According to Echaust and Just (2020), the POT approach is considered more advantageous than the BMM, because it focuses on all possible events greater than the threshold and not just the largest events. The aim of POT is to assess the data and model all the data points that are above the specified threshold u. Making an accurate selection of the threshold is vital for analysis.

    The conventional approach is to use graphical analysis - mean residual life plot and parameter stability plot - to determine the threshold value. The mean residual life plot shows the mean excesses against the threshold of the standardized innovations for both tails. The selected threshold would occur where there is an upward linear trend in the slope of the mean excess values (Khan et al. 2021). A parameter stability plot is employed to show the optimal shape and scale parameters against the threshold values that range from 1.0 to 2.0 (Naradh et al. 2021). Such methods consist of identifying stable regions in the graphs which are considered highly subjective, by Echaust and Just (2020). In order to confirm the threshold, a Pareto quantile plot is employed to state the respective number of positive and negative innovations above the threshold. The innovations are fitted to the GPD and then the shape and scale parameters are estimated by the ML method. Echaust and Just (2020) give the GPD as:

    G­ξ,θ(x){1(1+ξxθ)1ξ,ξ01exp(xθ),ξ=0 (5)

    where θ>0, x0 for ξ0 and 0xxξ for ξ<0. The GPD has just two parameters, θ = scale and ξ = shape.

    A thin-tailed distribution is indicated by ξ<0, whereas a heavy-tailed distribution such as Stable, is indicated by ξ>0. Similar to the GEVD procedure, the model diagnostics employed are a PP, QQ, return level and density plot.

    The school of α-Stable or Stable distributions is a widely documented class of probability distributions that can effectively model excess kurtosis, skewness, volatility clustering, asymmetry and heavy tails (Bautista and Mata, 2020; Kuang, 2020). Bautista and Mora (2020) give the Stable distribution as:

    E[exp(itX)]={exp(θα|t|α[1ivsign(t)tan(πα2)]+iλt),α1exp(θ|t|[1+iv2πsign(t)ln|t|]+iλt),α=1 (6)

    where λR = location, θ>0 = scale, 1v1 = skewness, and 0<α2 = tail exponent.

    The sign of v indicates the direction of skewness and is subject to the given constraint above. The tail exponent, also known as the index of stability, represents the rate at which the tails diminish or come to an end. When α>2, the mean is equivalent to the location λ, but no mean exists when α<1. If α<2, this results in an infinite variance and the tails are thus heavy.

    Following Bautista and Mata (2020) and Naradh et al. (2021), the model diagnostics include the Kolmogorov-Smirnov (KS) and AD normality tests. KS computes the difference between the theoretical and empirical distribution, whereas AD computes the mean of square differences. A variance stabilized PP plot and density plot are employed to show a graphical analysis of the distribution fit.

    The four fitted innovation distributions are analyzed by model diagnostics, thereafter the optimal distribution is determined by VaR and backtesting methods.

    VaR is a well-known measure of market risk and is used in the fields of portfolio management and risk management (Bautista and Mata, 2020; Emenogu et al. 2020; Omari et al. 2020). Following Kuang (2020), the estimation of the VaR is made up of the GARCH-M in combination with the innovation distributions. VaR is given as P(RRtVaR­t(α))=α, which is defined as the probability of the risk-return relationship RR at time t less than or equal to the VaR estimate at the percentage of time α. Delis et al. (2021) stated that there are both upper and lower tails of a distribution that correspond to α. In the context of this study, the upper tails are known as the short position, associated with gains, where the confidence intervals are defined as 97.5 and 99%. Similarly, the lower tails are known as the long position, associated with losses and are defined as 1 and 2.5%. The highest VaR estimates indicate high-risk potential losses and biased values, where the distribution is inadequate; the lowest VaR estimates indicate the opposite (Ayed et al. 2020; Bautista and Mata, 2020).

    Following several studies, such as Kuang (2020), Ayed et al. (2020) and Echaust and Just (2020), the backtesting procedure is used to analyze the forecast power of the VaR estimates. In this study, the backtesting procedure consists of the violation ratio (VR), the Kupiec unconditional coverage test, Christoffersen conditional coverage test and VaR duration-based test. The calculation of the violation ratio (VR) is given by Emenogu et al. (2020) as:

    VR=Actual number of violationsExpected number of violations (7)

    where if VR < 1, risk is underestimated and if VR > 1, risk is overestimated. If 0.8 ≤ VR ≤ 1.2, the forecasted risk is optimal, whereas 0.5 < VR < 1.5 is inadequate.

    The VR serves as a preliminary test as it is a very simple method to check model adequacy; therefore, more powerful tests are employed. According to Kuang (2020) and Ayed et al. (2020), an optimal VaR model satisfies the unconditional and conditional coverage properties. The unconditional property states that the observed number of violations should be in line with expected values at a given confidence interval. If the observed and expected values are inconsistent, this phenomenon would be referred to as the failure rate which is defined as the number of violations. The conditional property states that such violations are independent of each other. Thus, the more robust tests of the backtesting evaluation criteria consist of the Kupiec unconditional coverage test and Christoffersen conditional coverage test.

    To investigate the unconditional property, the proportion of failure test by Kupiec (1995) is employed. The null hypothesis is that the observed number of violations is consistent with the expected values at a given confidence interval. The Kupiec test statistic is given as:

    KUC=2ln[(1p)nm]+2ln[(1mn)nm(mn)m] (8)

    where p = the assumed probability of occurrence, m = number of hits of the model (number of times the loss is greater than the VaR estimate) and n = number of tests.

    The test statistic KUC follows a chi-squared distribution with one degree of freedom (X2(1)). If KUC is less than the critical value, do not reject the null hypothesis and conclude model adequacy. If KUC is greater than the critical value, reject the null and conclude model inadequacy.

    To investigate the conditional property, the conditional joint test by Christoffersen (1998) is employed, where the test statistic is given as:

    LCC=KUC+CIND (9)

    The test statistic consists of the Kupiec unconditional test and Christoffersen (1998) independence test. For the latter, the null hypothesis is that the failure rate is independent, indicating model adequacy. The test statistic is given as:

    CIND=2ln[(1ˆπ2)n00+n01ˆπ2n01+n11]+2ln[(1ˆπ01)n00ˆπn0101(1ˆπ11)n10ˆπn1111],ˆπ01=n01n01+n01, ˆπ11=n11n10+n11 and ˆπ2=n01+n11n00+n10+n01+n11 (10)

    where ˆπij = number of times that state i follows state j, state 0 = independence and state 1 = dependence.

    The decision procedure for the test statistic CIND follows the Kupiec unconditional test. It should be noted that for the joint decision procedure, the test statistic LCC follows a chi-squared distribution with two degrees of freedom (X2(2)). A limitation of the independence test is that it only tests for one-day violations instead of over multiple days (Echaust and Just, 2020). Thus, a VaR duration-based test is employed to investigate the time dynamics between the past and future violations.

    For the VaR duration-based test by Christoffersen and Pelletier (2004), the expectation is that given any day, future violations should not occur because of the past. The null hypothesis is that the probability of a violation on any day is subject to the no memory property, whereby it is independent of the effects of the previous day(s) and has a mean distribution of 1/p.

    To explain the latter, consider the Weibull parameter = b, where the Weibull distribution is of a school of continuous probability distributions that can take on several shapes. When b=1, it follows an exponential distribution which is the only distribution that is memory free. Thus, if the time between violations has no memory of each other, the average is 1/p as defined by the exponential distribution. The Weibull distribution is a function of the failure rate to an index of time, given as:

    f(d)=abbdb1exp{(ad)b} (11)

    where d = number of days, b = shape parameter and a = scale parameter.

    The test statistic is defined as:

    D=2(logL(ˆa)logL(p)) (12)

    where L = likelihood, ˆa = estimated scale parameter and p = probability of no memory violation.

    The decision procedure for the test statistic D follows the Kupiec unconditional test.

    Following standard literature, this study uses the estimated p-values to make the decisions for the hypothesis tests. The highest p-value indicates the optimal model (Ayed et al. 2020; Omari et al. 2020).

    Following Dwarika et al. (2021) and Naradh et al. (2021), the daily closing price data of the JSE ALSI are obtained from IRESS for the sample period from 04 October 2004 to 05 October 2021. The ALSI price data is converted to market returns by taking the natural log form of the difference between closing prices of the current and previous day. Following Dwarika et al. (2021), the annual T-bill obtained from the SARB is converted to a daily value to compute excess returns. The ALSI (excess) return data is made up of a total of 4251 observations. The ALSI returns is confirmed to be stationary, by the ADF, PP and KPSS tests, to avoid a spurious regression and ensure a valid time series. The statistical properties of the ALSI returns are investigated by standard preliminary tests. Table 2 shows the preliminary test results of the ALSI returns.

    Table 2.  Preliminary tests of the ALSI returns.
    Property Tests Test Statistic p-value
    Normality JB 5703.8000 < 0.0001
    SW 0.9436 < 0.0001
    AD 39.5940 < 0.0001
    Heteroscedasticity LB2 5397.4000 < 0.0001
    ARCH-LM 931.4000 < 0.0001

     | Show Table
    DownLoad: CSV

    From Table 2, since the p-values are less than 5%, the null hypothesis that the ALSI returns follow a normal distribution is rejected at a 5% level of significance. The null hypothesis that the ARCH effect is absent within the ALSI return series is also rejected at a 5% level of significance. In conclusion, the series of the ALSI returns are asymmetric, nonnormal and volatile in nature; thus, substantiating the employment of the GARCH-M type models.

    Following Dwarika et al. (2021), Naradh et al. (2021), Ilupeju (2016) and Mandimika and Chinzara (2012), the foremost GARCH-M type models and innovation distributions are investigated. The GARCH-M models are shown for the four innovation distributions: NORM, Stud-t, Skew-t and the GED. Table 3 shows the relevant significant ML parameter estimates of the GARCH-M (1, 1) models with the different innovation distributions.

    Table 3.  ML parameter estimates of the GARCH-M models with different innovation distributions.
    Model Estimates NORM Stud-t Skew-t GED
    GARCH-M ˆα1 0.0952 *** 0.0734 *** 0.0883 *** 0.0739 ***
    ˆβ1 0.8897 *** 0.9256 *** 0.8976 *** 0.9251 ***
    ˆδ 0.1165 ** 0.0964 ** 0.1116 ** 0.0999 **
    GJR-GARCH-M ˆα1 0.0450 *** 0.0396 *** 0.0359 *** 0.0416 ***
    ˆβ1 0.9066 *** 0.9410 *** 0.9108 *** 0.9075 ***
    ˆγ 0.7425 *** 0.6829 *** 0.9186 *** 0.7971 ***
    ˆδ 0.0921 *** −0.0850 ** 0.0984 *** 0.1071 ***
    EGARCH-M ˆα1 −0.1069 *** −0.1048 *** −0.1045 *** −0.1051 ***
    ˆβ1 0.9777 *** 0.9793 *** 0.9799 *** 0.9781 ***
    ˆγ 0.1329 *** 0.1294 *** 0.1257 *** 0.1320 ***
    ˆδ 0.0744 *** 0.0902 *** 0.0699 *** 0.0928 ***
    APARCH-M ˆα1 0.0700 *** 0.0672 *** 0.0634 *** 0.0691 ***
    ˆβ1 0.9200 *** 0.9228 *** 0.9494 *** 0.9204 ***
    ˆγ 0.8637 *** 0.8817 *** 0.8047 *** 0.8617 ***
    ˆδ 0.1008 *** 0.1163 *** −0.1078 *** 0.1163 ***
    NOTE: *, **, *** means the p-value is significant at a 10%, 5% and 1% level of significance, respectively

     | Show Table
    DownLoad: CSV

    From Table 3, the GARCH-M models are valid since the ARCH and GARCH effects are significant at all the levels of significance (1, 5 and 10%). The sum of the ARCH and GARCH effects (ˆα1+ˆβ1) is positive and high, indicating strong and persistent levels of volatility in the South African market. The only exception is for APARCH-M Skew-t, with a sum greater than one, indicative of an overestimation of risk, in line with Dwarika et al. (2021). All the models have an asymmetry parameter ˆγ>0, which indicates the presence of asymmetric volatility and asymmetric effects. The presence of high levels of volatility, asymmetric volatility and asymmetric effects are in line with the empirical expectations of an emerging market and prior South African studies.

    The risk premium ˆδ is statistically significant at a 5 and 10% level of significance for the GARCH-M approach. The majority of the GARCH-M models have a positive ˆδ, indicating a positive risk-return relationship. This finding is in line with Dwarika et al. (2021) but contrasts to earlier studies, by Mangani (2008), Mandimika and Chinzara (2012) and Adu et al. (2015), who found no relationship. The significance of the risk premium of the asymmetric GARCH-M models improved in comparison to the standard GARCH-M. This is due to the more robust fit of the asymmetric GARCH-M models to the asymmetric nature of the financial data, as suggested by Saddah and Sitanggang (2020).

    In terms of theoretical expectations, it follows that a positive risk-return relationship will exist. That is, since the South African market is characterized as high-risk, an investor can expect a superior rate of return. This was confirmed by the positive risk premium found by the majority of the GARCH-M test results. The only exceptions are GJR-M Stud-t and APARCH-M Skew-t, where the risk premium is negative. The change in sign is due to modelling adjustments made, such as the dropping of a constant, to ensure the model is valid. The optimal GARCH-M is investigated by model diagnostics. Table 4 shows the information criteria of the GARCH-M models with the different innovation distributions.

    Table 4.  ML parameter estimates of the GARCH-M models with different innovation distributions.
    Model Criteria NORM Stud-t Skew-t GED
    GARCH-M AIC −6.3132 −6.3138 −6.3391 −6.3099
    BIC −6.3057 −6.3064 −6.3286 −6.3024
    GJR-GARCH-M AIC −6.3380 −6.3323 −6.3631 −6.3440
    BIC −6.3290 −6.3233 −6.3511 −6.3335
    EGARCH-M AIC −6.3397 −6.3482 −6.3642 −6.3453
    BIC −6.3308 −6.3377 −6.3523 −6.3348
    APARCH-M AIC −6.3412 −6.3500 −6.3519 −6.3468
    BIC −6.3322 −6.3395 −6.3414 −6.3363

     | Show Table
    DownLoad: CSV

    From Table 4, the consistent optimal fitting innovation distribution to the respective GARCH-M models is Skew-t, in line with Dwarika et al. (2021), Ayed et al. (2020) and Omari et al. (2020). This finding is in contrast to Emenogu et al. (2020), who found that the Skew-t performance varied with different GARCH type models. The NORM is the least optimal fit for EGARCH and APARCH, as expected by Mandimika and Chinzara (2012), Kuang (2020) and Saddah and Sitanggang (2020). The asymmetric financial data would make a more robust fit with distributions designed to account for heavy tails and other higher moment properties.

    EGARCH is found to be the optimal model in this study, in line with Dwarika et al. (2021), Naradh et al. (2021), Saddah and Sitanggang (2020) and Omari et al. (2020). This is in contrast to APARCH which was found to be optimal by Ilupeju (2016) and Ayed et al. (2020). Overall, Skew-t is the optimal fitting innovation distribution in combination with EGARCH-M, in line with Dwarika et al. (2021) and Omari et al. (2020). The risk check is employed to investigate the properties of uncaptured risk.

    Following Dwarika et al. (2021), which built on Mangani (2008), Mandimika and Chinzara (2012) and Ilupeju (2016), the standardized innovations of the EGARCH-M Skew-t model are investigated by the risk check to determine the extent of uncaptured risk. Table 5 shows the risk check test results for the innovations of the EGARCH-M Skew-t model.

    Table 5.  Risk check for the innovations of EGARCH-M Skew-t.
    Test Name Results
    Normality SW 0.9912 ***
    JB 172.6900 ***
    AD 7.6300 ***
    Heteroscedasticity LB2 32.1690 **
    ARCH-LM 99.6250 ***
    Randomness Bartels rank −0.9442
    Cox-Stuart 1033.0000
    BDS 0.4998
    NOTE: *, **, *** means the p-value is significant at a 10%, 5% and 1% level of significance, respectively

     | Show Table
    DownLoad: CSV

    From Table 5, the normality tests show that the innovations are asymmetric in nature, indicating that asymmetry has been inadequately captured. Since the p-values of the heteroscedasticity tests are significant, this means that volatility is present within the innovations and remains uncaptured. This finding is in contrast to Dwarika et al. (2021) and Ilupeju (2016). It could be due to this study's selected sample period, which included highly volatile periods, such as the 2008 financial crisis and recent COVID-19 pandemic.

    The randomness tests reveal that the innovations exhibit random behavior, hence, an indication of uncaptured risk. In conclusion, the asymmetric, volatile and random nature of the innovations is inadequately captured by EGARCH-M Skew-t. The overall finding of uncaptured risk is in line with Mangani (2008), Mandimika and Chinzara (2012), Ilupeju (2016) and Dwarika et al. (2021). The failed risk check motivates the employment of more robust nonnormal innovation distributions

    The different innovation distributions are fitted to the standardized innovations extracted from EGARCH-M Skew-t. Table 6 shows the ML parameter estimates of the PIVD.

    Table 6.  ML parameter estimates of the PIVD.
    ˆm ˆv ˆλ ˆθ AD test
    (p-value)
    8.9423 6.3842 1.4370 3.5814 0.2370
    (0.9768)

     | Show Table
    DownLoad: CSV

    From Table 6, ˆm is 8.9423 which indicates a positive and high kurtosis value. More specifically, a heavy-tailed distribution, as expected, in line with a PIVD and the market characteristics of an emerging market. The sign of the skewness parameter 6.3842 indicates a positively skewed distribution. The AD test indicates that the innovations follow a normal distribution. Thus, it can be concluded that the PIVD outperforms the Skew-t distribution and is a more robust fit for the innovations, in line with Ilupeju (2016) and Kuang (2020).

    Following Ilupeju (2016), the block size used in this study is five to ensure accurate results. Table 7 shows the ML parameter estimates of the GEVD with the Standard Errors (SE) in brackets. Let zt = positive innovations and zt=zt = negative innovations.

    Table 7.  ML parameter estimates of the GEVD.
    Maxima (m) (ˆξ)
    SE(ξ)
    (ˆθ)
    SE(ˆθ)
    (ˆλ)
    SE(ˆλ)
    AD test
    (p-value)
    zt 850.2000 −0.1441
    (0.0133)
    0.8652
    (0.0204)
    0.5538
    (0.0139)
    1.7572
    (0.1254)
    zt 850.2000 −0.0795
    (0.0210)
    0.8556
    (0.0257)
    0.6796
    (0.0181)
    0.2291
    (0.9803)
    zt = positive innovations and zt=zt = negative innovations

     | Show Table
    DownLoad: CSV

    From Table 7, the tail index represented by the shape parameter ˆξ is less than zero for both the positive and negative innovations. This indicates a Weibull distribution, a short-tailed distribution defined as having a finite right tail. The AD test confirms that the GEVD is an adequate fit, since the innovations follow a normal distribution, in line with the PIVD above. Figures 2 and 3 show the model diagnostics of the GEVD for the standardized innovations.

    Figure 2.  GEVD diagnostic plots of the positive innovations.
    Figure 3.  GEVD diagnostic plots of the negative innovations.

    From Figures 2 and 3, the PP plot shows a perfect fit of the innovations to the GEVD. However, from the QQ plots, the data points do show some departure from the theoretical straight line. From the return level plots, most of the points that deviate from the straight line still fall on or within the confidence bands; therefore, the fit is adequate. The density plot confirms the adequate fit as most of the points lie on the GEVD. According to Echaust and Just (2020), the GPD is considered more advantageous than the GEVD, because it focuses on all possible events greater than the threshold and not just the largest events.

    The threshold selection is made, by graphical methods, before the GPD analysis. Figures 4 and 5 show the mean innovation life plots for the standardized innovations.

    Figure 4.  Mean innovation life plot of the positive innovations.
    Figure 5.  Mean innovation life plot of the negative innovations.

    From Figures 4 and 5, the selected threshold is estimated to be approximately 2. The parameter stability plots are further employed to explore the selected threshold values. Figures 6 and 7 show the parameter stability plots for the standardized innovations.

    Figure 6.  Parameter stability plot for the positive innovations.
    Figure 7.  Parameter stability plot for the negative innovations.

    From Figures 6 and 7, the stable region is from the threshold values 1.1 to 1.4, respectively. The Pareto quantile plots are employed to confirm the threshold values. Figures 8 and 9 show the Pareto quantile plot for the standardized innovations.

    Figure 8.  Pareto quantile plot for the positive innovations.
    Figure 9.  Pareto quantile plot for the negative innovations.

    From Figures 8 and 9, the threshold for zt is u = exp (0.1782694) = 1.1951 and zt, u = exp (0.3915099) = 1.4792. The selected threshold values are used to estimate the ML parameter estimates of the GPD. Table 8 shows the ML parameter estimates of the GPD.

    Table 8.  ML parameter estimates of the GPD.
    Threshold
    (u)
    No of violations
    (Y)
    (ˆξ)
    SE(ˆξ)
    (ˆθ)
    SE(ˆθ)
    zt 1.1951 438 −0.0459
    (0.0442)
    0.4282
    (0.0279)
    zt 1.4792 326 −0.0351
    (0.0544)
    0.5989
    (0.0465)

     | Show Table
    DownLoad: CSV

    From Table 8, the number of observations above the threshold values is 438 and 326, respectively. These values are higher than those found in the studies by Naradh et al. (2021), Omari et al. (2020) and Ilupeju (2016), due to a larger sample period analyzed in this study. The scale parameters are significant and positive, in line with Naradh et al. (2021), Omari et al. (2020) and Ilupeju (2016). The shape parameters are negative, ˆξ<0, indicating a thin-tailed Weibull distribution. This finding contrasts with the empirical expectations of an emerging market and the result of Naradh et al. (2021). However, such an exception was also found in the studies by Omari et al. (2020) and Ilupeju (2016). Figures 10 and 11 show the model diagnostics of the GPD for the standardized innovations.

    Figure 10.  GPD diagnostic plots of the positive innovations.
    Figure 11.  GPD diagnostic plots of the negative innovations.

    From Figures 10 and 11, the PP plot shows that the empirical and theoretical distributions are in alignment. However, similar to the case of the GEVD above, the data points from the QQ plots show deviation from the theoretical straight line, especially for the negative innovations. From the return level plots, the data points either lie on or fall within the confidence bands, indicating an adequate fit. The density plot confirms the adequate fit as most points lie along the GPD. In conclusion, the model diagnostics of the EVT distributions, the GEVD and GPD, are in line with Naradh et al. (2021), Khan et al. (2021) and Ilupeju (2016).

    Table 9 shows the ML parameter estimates of the Stable distribution and the normality test statistics.

    Table 9.  ML parameter estimates of the Stable distribution.
    ˆα ˆv ˆθ ˆλ AD test
    (p-value)
    KS test
    (p-value)
    1.9104 −0.9571 0.6742 0.0715 1.3003
    (0.2323)
    0.0137
    (0.3993)

     | Show Table
    DownLoad: CSV

    From Table 9, skewness represented by ˆv is negative, indicating that the innovations are negatively skewed. Since ˆα < 2, this results in an infinite variance and heavy tails, in line with empirical expectations. Both normality tests show that the innovations follow a normal, or rather, a Stable distribution. Hence, Stable is a robust fitting probability distribution to the ALSI returns. Figures 12 and 13 show the graphical model diagnostics of the Stable distribution.

    Figure 12.  Stable density plot of the innovations.
    Figure 13.  Variance stabilized PP plot of the innovations.

    From Figure 12, there appears to be an almost perfect fit between the empirical and theoretical fit of the innovations to the Stable distribution. Figure 13 confirms an adequate fitting distribution by the empirical and theoretical lines being in perfect alignment. The optimal fit of Stable is in line with Naradh et al. (2021), Bautista and Mora (2020), Bautista and Mata (2020) and Ilupeju (2016).

    Following several studies, such as Kuang (2020), Ayed et al. (2020) and Echaust and Just (2020), the forecast power of the VaR estimates of EGARCH-M with the different innovation distributions are analyzed by the backtesting procedure, which consists of the VR, Kupiec unconditional test, Christoffersen conditional test and VaR duration test. Table 10 shows the relevant VaR estimates for different levels (1, 2.5, 97.5 and 99%).

    Table 10.  VaR estimates for the different levels.
    Position Short Long
    Level 1% 2.5% 97.5% 99%
    EGARCH-M PIVD −2.6831 −2.1488 1.8037 2.1325
    EGARCH-M GEVD −0.2479 −0.0792 2.4455 2.7275
    EGARCH-M GPD 0.0060 0.0152 1.4532 1.7777
    EGARCH-M Stable −2.7607 −2.1076 1.8418 2.1738

     | Show Table
    DownLoad: CSV

    From Table 10, the highest VaR estimates are produced by the GPD and GEVD at the short and long positions, respectively. In contrast, the robust VaR estimates are produced by Stable at 1%, PIVD at 2.5% and the GPD at the long position. Overall, GEVD has the highest VaR estimate and Stable the lowest. The EVT distributions are considered inadequate in fitting the innovations for the short position. Khan et al. (2021) examined only the long position and found the highest VaR estimate for the GPD at 95% in the Indian stock market. With respect to South Africa, this finding is in line with Naradh et al. (2021), who found that the GPD had the highest VaR estimate, in the short position and long position, for the JSE Mining Index and ALSI, respectively.

    This finding supports Ilupeju (2016), who found the highest VaR estimate for the GPD at 1%, but contrasts to GEVD which had the lowest VaR estimates at 2.5%. In the study by Bautista and Mata (2020), the authors found that Stable had the lowest VaR estimates at the examined long position for the Mexican Stock Exchange. Naradh et al. (2021) also found Stable to be optimal at the short and long positions. This contrasts with Ilupeju (2016), who found Stable with the highest VaR with the exception of the 1% level. The VaR estimates are examined by the backtesting procedure, as recommended by the Basel Accord, to determine the optimal innovation distribution. Table 11 shows the VR estimates for the different levels.

    Table 11.  VR estimates for the different levels.
    Position Short Long
    Level 1% 2.5% 97.5% 99%
    EGARCH-M PIVD 0.9286 0.9811 0.9998 1.0005
    EGARCH-M GEVD 42.5476 19.7264 1.0203 1.0090
    EGARCH-M GPD 53.0476 21.1981 0.9681 0.9829
    EGARCH-M Stable 0.8333 1.0283 1.0024 1.0021

     | Show Table
    DownLoad: CSV

    From Table 11, the majority of the VRs indicate an optimal forecast since they are between 0.8 and 1.2. The GEVD and GPD in the short position are the exceptions, as the VRs are well above 1, indicating that risk has been overestimated. This is in line with the robustness of the EVT distributions as indicated by the VaR estimates above. Tables 12 and 13 show the p-values of the Kupiec unconditional and Christoffersen conditional joint tests, respectively. Table 14 shows the p-values of the VaR duration-based test.

    Table 12.  p-values of the unconditional test.
    Position Short Long
    Level 1% 2.5% 97.5% 99%
    EGARCH-M PIVD 0.5832 0.8225 0.8658 0.8149
    EGARCH-M GEVD X X - < 0.0001
    EGARCH-M GPD X X X -
    EGARCH-M Stable 0.2324 0.7898 0.3552 0.1741
    NOTE: "X" = VaR-GARCH-M models that are inadequate, "-" = Kupiec unconditional test statistic is rejected at the 5% level of significance due to an underestimation of the realized values

     | Show Table
    DownLoad: CSV
    Table 13.  p-values of the conditional test.
    Position Short Long
    Level 1% 2.5% 97.5% 99%
    EGARCH-M PIVD 0.5995 0.9364 0.4592 0.6526
    EGARCH-M GEVD X X - < 0.0001
    EGARCH-M GPD X X X -
    EGARCH-M Stable 0.3665 0.9577 0.4222 0.3018
    NOTE: "X" = VaR-GARCH-M models that are inadequate, "-" = Christoffersen conditional joint test statistic is rejected at the 5% level of significance due to an underestimation of the realized values

     | Show Table
    DownLoad: CSV
    Table 14.  p-values of the duration-based test.
    Position Short Long
    Level 1% 2.5% 97.5% 99%
    EGARCH-M PIVD 0.9546 0.8800 - -
    EGARCH-M GEVD - - - -
    EGARCH-M GPD - - - -
    EGARCH-M Stable 0.6607 0.8288 - -
    NOTE: "-" = duration-based test is rejected at the 5% level of significance due to an underestimation of the realized values

     | Show Table
    DownLoad: CSV

    From Tables 12 and 13, it can be seen that the values of the conditional joint test and unconditional test are present for the same levels. Both the PIVD and Stable passed the conditional and unconditional coverage tests at the given levels of 1, 2.5, 97.5 and 99%. The optimal performance of Stable is in line with Naradh et al. (2021), Bautista and Mata (2020) and Ilupeju (2016). However, since the p-values for the PIVD are the highest relative to Stable, PIVD is the optimal innovation distribution. Model inadequacy is indicated for the remaining levels, as well as both the EVT distributions for the overall short and long position, due to an over or underestimation of the realized values. The null hypothesis is rejected for the long position of the GEVD and 99% level of GPD, consolidating model inadequacy of the EVT distributions.

    From Table 14, the null hypothesis that the time between violations has no memory is rejected for all the innovation distributions of the long position. The same decision is made for both the GEVD and GPD in the short position, meaning that the EVT innovation distributions are incorrectly specified. The null is not rejected for the levels 1 and 2.5%, indicating model adequacy, where the majority of the p-values for the PIVD are higher than Stable.

    In conclusion of the backtesting procedure, the PIVD is the optimal innovation distribution due to higher p-values relative to Stable and the EVT distributions which are found to be inadequate. The outperformance of the PIVD and Stable compared to the EVT distributions are in line with Naradh et al. (2021), Kuang (2020) and Ilupeju (2016). This is in contrast to Khan et al. (2021), who concluded the GPD is efficient and Omari et al. (2020), who concluded that the GARCH approach in the context of the EVT distributions is optimal. The sample periods used in the study by Khan et al. (2021) and Omari et al. (2020), were less than a year and fourteen and a half years, respectively. Therefore, the EVT distributions are considered more optimal in studies with smaller sample periods. In addition, it is vital to consider several innovation distributions and the backtesting procedure to determine which distribution optimizes the tails of any GARCH model.

    The only known study, to the best of the authors knowledge, to investigate a different innovation distribution (Skewed GED) in the context of GARCH-M, was by Delis et al. (2021). Therefore, this was the first study, on a local and international level, to investigate different nonnormal innovation distributions in combination with GARCH-M type models. The aim was to investigate the optimal GARCH-M model and innovation distribution to determine the risk-return relationship. The primary aim was to determine the optimal GARCH-M type model. This study found EGARCH-M as the optimal model, in line with Naradh et al. (2021), Saddah and Sitanggang (2020) and Omari et al. (2020). More specifically, EGARCH-M Skew-t was found to be optimal. However, the innovations failed to capture asymmetry, in line with previous South African studies by Mangani (2008), Mandimika and Chinzara (2012), Ilupeju (2016) and Dwarika et al. (2021). Therefore, this study employed more robust innovation distributions, which led to the secondary aim, which was to find an innovation distribution to optimize the GARCH-M model tails, i.e., optimally capture risk.

    The nonnormal innovation distributions employed were the PIVD, GEVD, GPD and Stable. These distributions were considered more robust and flexible because they have the ability to take into account heavy tails and other higher moment properties such as skewness and excess kurtosis. This is relevant in the case of emerging markets, such as South Africa, which are characterized by heavy tails due to high levels of volatility. Model diagnostics revealed that the employment of the different innovation distributions was robust as there were no major deviations between the empirical and theoretical distributions. As the Basel Accord I recommended, more rigorous testing, VaR and backtesting methods were employed. From the VaR and backtesting analysis, it was found that the EVT distributions, the GEVD and GPD, were found to be the least robust relative to Stable and the PIVD. While the results of Stable and the PIVD were close, the PIVD was the optimal innovation distribution as it had the higher p-values.

    Therefore, investors, risk managers and policymakers would opt to use the EGARCH-M in combination with the PIVD when modelling the risk-return relationship in the South African market. The robustness of EGARCH-M is supported by previous studies by Dwarika et al. (2021), Naradh et al. (2021), Saddah and Sitanggang (2020) and Omari et al. (2020). Stable was found to be an optimal innovation distribution by Bautista and Mora (2020), Bautista and Mata (2020) Naradh et al. (2021) and Ilupeju (2016). However, in the context of the risk-return relationship, this study found PIVD to be optimal, followed by Stable. This is in line with the study conducted by Kuang (2020), who found that the PIVD outperformed several other distributions, namely, the Stud-t, GEVD and GPD.

    The EVT distributions, the GEVD and GPD, were found to be suboptimal in this study, in line with Naradh et al. (2021), Kuang (2020) and Ilupeju (2016). Based on prior studies, Khan et al. (2021) and Omari et al. (2020), the EVT distributions were found to be optimal given that smaller sample periods were used. Thus, it would be optimal to consider several distributions to ensure an unbiased estimation of the most robust innovation distribution, irrespective of the sample period used in a study.

    To conclude, this study confirmed that the standard GARCH-M and conventional normal type innovation distributions are ineffective in fitting the asymmetric, volatile and random nature of financial data. It should be noted that this study focused on asymmetry and employed normality tests for the model diagnostics of the innovation distributions. Therefore, the first recommendation is to include heteroscedasticity and randomness tests to investigate other properties, such as the volatile and random nature of the innovations. In other words, to apply the complete risk check to the fitted innovation distributions. The second recommendation is to investigate the risk-return relationship using GARCH-M type models in direct combination with the more robust nonnormal innovation distributions. Finally, to explore other nonnormal innovation distributions in the context of GARCH-M, that were not included in the scope of this study, such as the Inverse Gaussian, Generalized Hyperbolic, Johnson's SU and Skewed GED.

    The author would like to thank Prof. John Nolan for the grant received for the STABLE package in R (http://www.robustanalysis.com/).

    The author declares no conflict of interest.

    The secondary price dataset used in this study can be obtained from the IRESS database.


    [1] Akorede M, Ibrahim O, Amuda S, et al. (2016) Current status and outlook of renewable energy development in Nigeria. Niger J Technol, 36. https://doi.org/10.4314/njt.v36i1.25 doi: 10.4314/njt.v36i1.25
    [2] Elum ZA, Momodu AS (2017) Climate change mitigation and renewable energy for sustainable development in Nigeria: A discourse approach. Renewable Sustainable Energy Rev 76: 72–80. http://dx.doi.org/10.1016/j.rser.2017.03.040 doi: 10.1016/j.rser.2017.03.040
    [3] Adewuyi A (2020) Challenges and prospects of renewable energy in Nigeria: A case of bioethanol and biodiesel production. Energy Reports 6: 77–88. https://doi.org/10.1016/j.egyr.2019.10.005 doi: 10.1016/j.egyr.2019.12.002
    [4] Olujobi OJ, Ufua DE, Olokundun M, et al. (2021) Conversion of organic wastes to electricity in Nigeria: legal perspective on the challenges and prospects. Int J Environ Sci Technol https://doi.org/10.1007/s13762-020-03059-3 doi: 10.1007/s13762-020-03059-3
    [5] Adelaja AO (2020) Barriers to national renewable energy policy adoption: Insights from a case study of Nigeria. Energy Strateg Rev 30: 100519. https://doi.org/10.1016/j.esr.2020.100519 doi: 10.1016/j.esr.2020.100519
    [6] Emodi NV, Boo KJ (2015) Sustainable energy development in Nigeria: Current status and policy options. Renewable Sustainable Energy Rev 51: 356–381. https://doi.org/10.1016/j.rser.2015.06.016 doi: 10.1016/j.rser.2015.06.016
    [7] Aliyu AK, Modu B, Tan CW (2018) A review of renewable energy development in Africa: A focus in South Africa, Egypt and Nigeria. Renewable Sustainable Energy Rev 81: 2502–2518. http://dx.doi.org/10.1016/j.rser.2017.06.055 doi: 10.1016/j.rser.2017.06.055
    [8] Chathurangi D, Jayatunga U, Rathnayake M, et al. (2018) Potential power quality impacts on LV distribution networks with high penetration levels of solar PV. Proc Int Conf Harmon Qual Power, ICHQP 2018: 1–6. https://doi.org/10.1109/ICHQP.2018.8378890 doi: 10.1109/ICHQP.2018.8378890
    [9] Adetokun BB, Ojo JO, Muriithi CM (2020) Reactive Power-Voltage-Based voltage instability sensitivity indices for power grid with increasing renewable energy penetration. IEEE Access 8: 85401–85410. https://doi.org/10.1109/ACCESS.2020.2992194 doi: 10.1109/ACCESS.2020.2992194
    [10] Laugs GAH, Benders RMJ, Moll HC (2020) Balancing responsibilities: Effects of growth of variable renewable energy, storage, and undue grid interaction. Energy Policy 139: 111203. https://doi.org/10.1016/j.enpol.2019.111203 doi: 10.1016/j.enpol.2019.111203
    [11] Impram S, Varbak Nese S, Oral B (2020) Challenges of renewable energy penetration on power system flexibility: A survey. Energy Strategy Rev 31: 100539. https://doi.org/10.1016/j.esr.2020.100539 doi: 10.1016/j.esr.2020.100539
    [12] Adineh B, Keypour R, Davari P, et al. (2021) Review of Harmonic Mitigation methods in microgrid: From a hierarchical control perspective. IEEE J Emerg Sel Top Power Electron 9: 3044–3060. https://doi.org/10.1109/JESTPE.2020.3001971 doi: 10.1109/JESTPE.2020.3001971
    [13] Jain S, Sawle Y (2021) Optimization and comparative economic analysis of standalone and grid-connected hybrid renewable energy system for remote location. Front Energy Res 9: 518. https://doi.org/10.3389/fenrg.2021.724162 doi: 10.3389/fenrg.2021.724162
    [14] Mamun MAA, Hasanuzzaman M (2019) Energy economics. Energy Sustainable Dev 2020: 167–178. https://doi.org/10.1016/B978-0-12-814645-3.00007-9 doi: 10.1016/B978-0-12-814645-3.00007-9
    [15] Edomah N, Ndulue G (2020) Energy transition in a lockdown: An analysis of the impact of COVID-19 on changes in electricity demand in Lagos Nigeria. Glob Transitions 2: 127–137. https://doi.org/10.1016/j.glt.2020.07.002 doi: 10.1016/j.glt.2020.07.002
    [16] Steffen B, Egli F, Pahle M, et al. (2020) Navigating the clean energy transition in the COVID-19 crisis. Joule 4: 1137–1141. https://doi.org/10.1016/j.joule.2020.04.011 doi: 10.1016/j.joule.2020.04.011
    [17] Santiago I, Moreno-Munoz A, Quintero-Jiménez P, et al. (2021) Electricity demand during pandemic times: The case of the COVID-19 in Spain. Energy Policy 148: 111964. https://doi.org/10.1016/j.enpol.2020.111964 doi: 10.1016/j.enpol.2020.111964
    [18] Jiang P, Fan Y Van, Klemeš JJ (2021) Impacts of COVID-19 on energy demand and consumption: Challenges, lessons and emerging opportunities. Appl Energy 285: 116441. https://doi.org/10.1016/j.apenergy.2021.116441 doi: 10.1016/j.apenergy.2021.116441
    [19] Hossain J, Pota HR (2014) Power system voltage stability and models of devices. Robust Control for Grid Voltage Stability: High Penetration of Renewable Energy, Springer, Singapore, 19–59. https://doi.org/10.1007/978-981-287-116-9_2
    [20] Kimbark E (1995) Power system stability. ISBN-13: 978-0780311350.
    [21] Freris L, Infield D (2008) Renewable energy in power systems. ISBN: 978-0-470-98894-7.
    [22] Shen W, Chen X, Qiu J, et al. (2020) A comprehensive review of variable renewable energy levelized cost of electricity. Renewable Sustainable Energy Rev 133: 110301. https://doi.org/10.1016/j.rser.2020.110301 doi: 10.1016/j.rser.2020.110301
    [23] Johnson J, Schenkman B, Ellis A, et al. (2012) Initial operating experience of the 1.2-MW la Ola photovoltaic system. Conf Rec IEEE Photovolt Spec Conf 2012: 1–6. https://doi.org/10.1109/PVSC-Vol2.2013.6656701 doi: 10.1109/PVSC-Vol2.2013.6656701
    [24] Dovichi Filho FB, Castillo Santiago Y, Silva Lora EE, et al. (2021) Evaluation of the maturity level of biomass electricity generation technologies using the technology readiness level criteria. J Clean Prod 295: 126426. https://doi.org/10.1016/j.jclepro.2021.126426 doi: 10.1016/j.jclepro.2021.126426
    [25] Hossain J, Pota HR (2014) Robust control for grid voltage stability: High penetration of renewable energy. Robust Control for Grid Voltage Stability: High Penetration of Renewable Energy, Singapore, Springer Singapore, 19–59. https://doi.org/10.1007/978-981-287-116-9.
    [26] Bollen M, Hassan F (2011) Integration of distributed generation in the power system. https://doi.org/10.1002/9781118029039
    [27] Hasankhani A, Hakimi SM (2021) Stochastic energy management of smart microgrid with intermittent renewable energy resources in electricity market. Energy 219: 119668. Available from: https://www.sciencedirect.com/science/article/pii/S0360544220327754.
    [28] Bajaj M, Singh AK (2020) Grid integrated renewable DG systems: A review of power quality challenges and state-of-the-art mitigation techniques. Int J Energy Res 44: 26–69. https://doi.org/10.1002/er.4847 doi: 10.1002/er.4847
    [29] Roberts D (2016) Vox, Got Denmark envy? Wait until you hear about its energy policies, 2016. Available from: https://www.vox.com/2016/3/12/11210818/denmark-energy-policies.
    [30] Bulut M, Özcan E (2021) Optimization of electricity transmission by Ford–Fulkerson algorithm. Sustain Energy, Grids Networks 28: 100544. https://doi.org/10.1016/j.segan.2021.100544 doi: 10.1016/j.segan.2021.100544
    [31] Jekayinfa SO, Orisaleye JI, Pecenka R (2020) An assessment of potential resources for biomass energy in Nigeria. Resources 9: 92. https://doi.org/10.1016/j.segan.2021.100544 doi: 10.3390/resources9080092
    [32] De Souza ACZ, Castilla M (2019) Microgrids design and implementation. https://doi.org/10.1007/978-3-319-98687-6_4
    [33] Okoye CU, Omolola SA (2019) A study and evaluation of power outages on 132 kv transmission network in Nigeria for grid security. Int J Eng Sci 8: 53–57.
    [34] Cheng Y, Huang SH, Rose J, et al. (2019) Subsynchronous resonance assessment for a large system with multiple series compensated transmission circuits. IET Renew Power Gener 13: 27–32. https://doi.org/10.1049/iet-rpg.2018.5254 doi: 10.1049/iet-rpg.2018.5254
    [35] Badal FR, Das P, Sarker SK, et al. (2019) A survey on control issues in renewable energy integration and microgrid. Prot Control Mod Power Syst, 4. https://doi.org/10.1186/s41601-019-0122-8 doi: 10.1186/s41601-019-0122-8
    [36] Masters GM (2013) Renewable and efficient electric power systems, John Wiley & Sons. ISBN: 978-1-118-63350-2.
    [37] Adetokun BB, Muriithi CM, Ojo JO (2020) Voltage stability analysis and improvement of power system with increased SCIG-based wind system integration. 2020 IEEE PES/IAS PowerAfrica, PowerAfrica 2020. https://doi.org/10.1109/PowerAfrica49420.2020.9219803 doi: 10.1109/PowerAfrica49420.2020.9219803
    [38] Ozoegwu CG, Akpan PU (2021) A review and appraisal of Nigeria's solar energy policy objectives and strategies against the backdrop of the renewable energy policy of the economic community of West African States. Renewable Sustainable Energy Rev 143: 110887. https://doi.org/10.1016/j.rser.2021.110887 doi: 10.1016/j.rser.2021.110887
    [39] Zhu J, Huang S, Liu Y, et al. (2021) Optimal energy management for grid-connected microgrids via expected-scenario-oriented robust optimization. Energy 216: 119224. https://doi.org/10.1016/j.energy.2020.119224 doi: 10.1016/j.energy.2020.119224
    [40] Shayeghi H, Younesi A (2020) Microgrid architectures, control and protection methods. Available from: http://link.springer.com/10.1007/978-3-030-23723-3_24.
    [41] Akinyele D, Olabode E, Amole A (2020) Review of fuel cell technologies and applications for sustainable microgrid systems. Inventions 5: 1–35. Available from: http://link.springer.com/10.1007/978-3-030-23723-3_24.
    [42] Hirsch A, Parag Y, Guerrero J (2018) Microgrids: A review of technologies, key drivers, and outstanding issues. Renewable Sustainable Energy Rev 90: 402–411. doi: 10.1016/j.rser.2018.03.040
    [43] Ehsan A, Yang Q (2018) Optimal integration and planning of renewable distributed generation in the power distribution networks: A review of analytical techniques. Appl Energy 210: 44–59. Available from: https://www.sciencedirect.com/science/article/pii/S0306261917315519.
    [44] Xie X, Zhang X, Liu H, et al. (2017) Characteristic analysis of subsynchronous resonance in practical wind farms connected to series-compensated transmissions. IEEE Trans Energy Convers 32: 1117–1126. https://doi.org/10.1109/TEC.2017.2676024 doi: 10.1109/TEC.2017.2676024
    [45] Youssef E, Sharaf A, Amin A, et al. (2018) Wind Energy FACTS applications and stabilization schemes, Elsevier Inc. http://dx.doi.org/10.1016/B978-0-12-812959-3.00014-9
    [46] Chettibi N, Massi Pavan A, Mellit A, et al. (2021) Real-time prediction of grid voltage and frequency using artificial neural networks: An experimental validation. Sustainable Energy, Grids Networks 27: 100502. https://doi.org/10.1016/j.segan.2021.100502 doi: 10.1016/j.segan.2021.100502
    [47] Aziz T, Ketjoy N (2017) PV penetration limits in low voltage networks and voltage variations. IEEE Access 5: 16784–16792. https://doi.org/10.1109/ACCESS.2017.2747086 doi: 10.1109/ACCESS.2017.2747086
    [48] Bansal R (2017) Handbook of distributed generation. https://doi.org/10.1007/978-3-319-51343-0
    [49] Zhang G, Hu W, Cao D, et al. (2021) Data-driven optimal energy management for a wind-solar-diesel-battery-reverse osmosis hybrid energy system using a deep reinforcement learning approach. Energy Convers Manage 227: 113608. Available from: https://www.sciencedirect.com/science/article/pii/S0196890420311365.
    [50] Wen Y, Chung CY, Liu X, et al. (2019) Microgrid dispatch with frequency-aware islanding constraints. IEEE Trans Power Syst 34: 2465–2468. https://doi.org/10.1109/TPWRS.2019.2895573 doi: 10.1109/TPWRS.2019.2895573
    [51] Naderipour A, Abdul-Malek Z, Abohamzeh E, et al. (2018) Control strategy of Grid-Connected PV inverters in microgrid with nonlinear operating conditions. 2018 IEEE 7th Int Conf Power Energy, PECon 2018: 45–49. https://doi.org/10.1109/PECON.2018.8684119 doi: 10.1109/PECON.2018.8684119
    [52] Rawat GS, Sathans (2018) Survey on DC microgrid architecture, power quality issues and control strategies. Proc 2nd Int Conf Inven Syst Control ICISC 2018: 500–505. https://doi.org/10.1109/ICISC.2018.8399123 doi: 10.1109/ICISC.2018.8399123
    [53] De Carne G, Buticchi G, Zou Z, et al. (2018) Reverse power flow control in a ST-Fed distribution grid. IEEE Trans Smart Grid 9: 3811–3819. https://doi.org/10.1109/TSG.2017.2651147 doi: 10.1109/TSG.2017.2651147
    [54] Londono JEV, Mazza A, Pons E, et al. (2021) Modelling and control of a grid-connected RES-hydrogen hybrid microgrid. Energies 14: 1–25. https://doi.org/10.3390/en14061540 doi: 10.3390/en14061540
    [55] Taghavifar H (2021) Adaptive robust control-based energy management of hybrid PV-Battery systems with improved transient performance. Int J Hydrogen Energy 46: 7442–7453. Available from: https://www.sciencedirect.com/science/article/pii/S0360319920344943.
    [56] Roy NB, Das D (2021) Optimal allocation of active and reactive power of dispatchable distributed generators in a droop controlled islanded microgrid considering renewable generation and load demand uncertainties. Sustainable Energy, Grids Networks 27: 100482. https://doi.org/10.1016/j.segan.2021.100482 doi: 10.1016/j.segan.2021.100482
    [57] Ardriani T, Sastya PD, Husnan Arofat A, et al. (2018) A novel power conditioner system for isolated DC microgrid system. 4th IEEE Conf Power Eng Renew Energy, ICPERE 2018-Proc, 1–5. https://doi.org/10.1109/ICPERE.2018.8739686 doi: 10.1109/ICPERE.2018.8739686
    [58] Ardriani T, Dahono PA, Rizqiawan A, et al. (2021) A dc microgrid system for powering remote areas. Energies 14. https://doi.org/10.3390/en14020493 doi: 10.3390/en14020493
    [59] Semenov D, Mirzaeva G, Townsend CD, et al. (2018) Recent development in AC microgrid control-A survey. 2017 Australas Univ Power Eng Conf AUPEC 2017 2017: 1–6. https://doi.org/10.1109/AUPEC.2017.8282457 doi: 10.1109/AUPEC.2017.8282457
    [60] Li S, Li Y, Chen X, et al. (2020) A novel flexible power support control with voltage fluctuation suppression for islanded hybrid AC/DC microgrid involving distributed energy storage units. Int J Electr Power Energy Syst 123: 106265. https://doi.org/10.1016/j.ijepes.2020.106265 doi: 10.1016/j.ijepes.2020.106265
    [61] Wen Y, Chung CY, Ye X (2018) Enhancing frequency stability of asynchronous grids interconnected with HVDC links. IEEE Trans Power Syst 33: 1800–1810. https://doi.org/10.1109/TPWRS.2017.2726444 doi: 10.1109/TPWRS.2017.2726444
    [62] Sun J, Li M, Zhang Z, et al. (2017) Renewable energy transmission by HVDC across the continent : system challenges and opportunities. 3: 353–364. https://doi.org/10.17775/CSEEJPES.2017.01200
    [63] Husein M, Chung IY (2018) Optimal design and financial feasibility of a university campus microgrid considering renewable energy incentives. Appl Energy 225: 273–289. https://doi.org/10.1016/j.apenergy.2018.05.036 doi: 10.1016/j.apenergy.2018.05.036
    [64] Torres-Moreno JL, Gimenez-Fernandez A, Perez-Garcia M, et al. (2018) Energy management strategy for Micro-Grids with PV-Battery systems and electric vehicles. Energies 11: 522. https://doi.org/10.3390/en11030522 doi: 10.3390/en11030522
    [65] Chen Z, Zhang H, Xiong R, et al. (2021) Energy management strategy of connected hybrid electric vehicles considering electricity and oil price fluctuations: A case study of ten typical cities in China. J Energy Storage 36: 102347. https://doi.org/10.1016/j.est.2021.102347 doi: 10.1016/j.est.2021.102347
    [66] Manzoor S, Bakhsh FI, Mufti M (2021) Coordinated control of VFT and fuzzy based FESS for frequency stabilisation of wind penetrated multi-area power system. Wind Eng 46: 413–428. https://doi.org/10.1177/0309524X211030846 doi: 10.1177/0309524X211030846
    [67] Susetyo ME, Rizqiawan A, Hariyanto N, et al. (2017) Droop control implementation on hybrid microgrid PV-diesel-battery. Int Conf High Volt Eng Power Syst ICHVEPS 2017-Proceeding 2017: 295–300. https://doi.org/10.1109/ICHVEPS.2017.8225960 doi: 10.1109/ICHVEPS.2017.8225960
    [68] Meegahapola LG, Bu S, Wadduwage DP, et al. (2021) Review on oscillatory stability in power grids with renewable energy sources: Monitoring, analysis, and control using synchrophasor technology. IEEE Trans Ind Electron 68: 519–531. https://doi.org/10.1109/ICHVEPS.2017.8225960 doi: 10.1109/TIE.2020.2965455
    [69] Liu Y, Wu L, Li J (2020) D-PMU based applications for emerging active distribution systems: A review. Electr Power Syst Res 179: 106063. https://doi.org/10.1016/j.epsr.2019.106063 doi: 10.1016/j.epsr.2019.106063
    [70] Xu LD, Duan L (2018) Big data for cyber physical systems in industry 4.0: A survey. 13: 148–169. https://doi.org/101080/1751757520181442934
    [71] Odetoye OA, Afolabi AS, Akinola OA (2020) Development and scaled-up simulation of an automated electrical energy management system for passageway illumination. Int J Emerg Electr Power Syst 21: 1–13. https://doi.org/10.1515/ijeeps-2020-0124 doi: 10.1515/ijeeps-2020-0124
    [72] González I, Calderón AJ, Portalo JM (2021) Innovative Multi-Layered architecture for heterogeneous automation and monitoring systems: Application case of a photovoltaic smart microgrid. Sustainability 13: 2234. https://doi.org/10.3390/su13042234 doi: 10.3390/su13042234
    [73] Samu R, Calais M, Shafiullah GM, et al. (2021) Applications for solar irradiance nowcasting in the control of microgrids: A review. Renewable Sustainable Energy Rev 147: 111187. https://doi.org/10.1016/j.rser.2021.111187 doi: 10.1016/j.rser.2021.111187
    [74] Li J, Chen S, Wu Y, et al. (2021) How to make better use of intermittent and variable energy? A review of wind and photovoltaic power consumption in China. Renewable Sustainable Energy Rev 137: 110626. https://doi.org/10.1016/j.rser.2020.110626 doi: 10.1016/j.rser.2020.110626
    [75] Kumar D, Zare F, Ghosh A (2017) DC microgrid technology: System architectures, AC Grid interfaces, grounding schemes, power quality, communication networks, applications, and standardizations aspects. IEEE Access 5: 12230–12256. https://doi.org/10.1109/ACCESS.2017.2705914 doi: 10.1109/ACCESS.2017.2705914
    [76] Pan H, Ding M, Chen A, et al. (2018) Research on distributed power capacity and site optimization planning of AC/DC hybrid micrograms considering line factors. Energies 11: 1930. https://doi.org/10.3390/EN11081930 doi: 10.3390/en11081930
    [77] Kashem SBA, De Souza S, Iqbal A, et al. (2018) Microgrid in military applications. Proc-2018 IEEE 12th Int Conf Compat Power Electron Power Eng CPE-POWERENG 2018: 1–5. https://doi.org/10.1109/CPE.2018.8372506 doi: 10.1109/CPE.2018.8372506
    [78] Jiang P, Huang S, Zhang T (2020) Asymmetric information in military microgrid confrontations-evaluation metric and influence analysis. Energies 13. https://doi.org/10.3390/en13081954 doi: 10.3390/en13081954
    [79] Shabshab SC, Lindahl PA, Nowocin JK, et al. (2020) Demand smoothing in military microgrids through coordinated direct load control. IEEE Trans Smart Grid 11: 1917–1927. https://doi.org/10.1109/TSG.2019.2945278 doi: 10.1109/TSG.2019.2945278
    [80] Kinnon M, Razeghi G, Samuelsen S (2021) The role of fuel cells in port microgrids to support sustainable goods movement. Renewable Sustainable Energy Rev 147: 111226. https://doi.org/10.1016/j.rser.2021.111226 doi: 10.1016/j.rser.2021.111226
    [81] Zachar M, Daoutidis P (2018) Energy management and load shaping for commercial microgrids coupled with flexible building environment control. J Energy Storage 16: 61–75. https://doi.org/10.1016/J.EST.2017.12.017 doi: 10.1016/j.est.2017.12.017
    [82] Tavakoli M, Shokridehaki F, Akorede M, et al. (2018) CVaR-based energy management scheme for optimal resilience and operational cost in commercial building microgrids. Int J Electr Power Energy Syst 100: 1–9. https://doi.org/10.1016/J.IJEPES.2018.02.022 doi: 10.1016/j.ijepes.2018.02.022
    [83] Warneryd M, Håkansson M, Karltorp K (2020) Unpacking the complexity of community microgrids: A review of institutions' roles for development of microgrids. Renewable Sustainable Energy Rev 121: 109690. https://doi.org/10.1016/J.RSER.2019.109690 doi: 10.1016/j.rser.2019.109690
    [84] Liu G, Jiang T, Ollis TB, et al. (2019) Distributed energy management for community microgrids considering network operational constraints and building thermal dynamics. Appl Energy 239: 83–95. https://doi.org/10.1016/J.APENERGY.2019.01.210 doi: 10.1016/j.apenergy.2019.01.210
    [85] Hossain MA, Pota HR, Squartini S, et al. (2019) Energy management of community microgrids considering degradation cost of battery. J Energy Storage 22: 257–269. https://doi.org/10.1016/J.EST.2018.12.021 doi: 10.1016/j.est.2018.12.021
    [86] Liang W, Lin S, Lei S, et al. (2022) Distributionally robust optimal dispatch of CCHP campus microgrids considering the time-delay of pipelines and the uncertainty of renewable energy. Energy 239: 122200. https://doi.org/10.1016/J.ENERGY.2021.122200 doi: 10.1016/j.energy.2021.122200
    [87] Lu X, Wang J (2017) A game changer: Electrifying remote communities by using isolated microgrids. IEEE Electrif Mag 5: 56–63. https://doi.org/10.1109/MELE.2017.2685958 doi: 10.1109/MELE.2017.2685958
    [88] Almeshqab F, Ustun TS (2019) Lessons learned from rural electrification initiatives in developing countries: Insights for technical, social, financial and public policy aspects. Renewable Sustainable Energy Rev 102: 35–53. https://doi.org/10.1016/j.rser.2018.11.035 doi: 10.1016/j.rser.2018.11.035
    [89] Lasseter RH, Chen Z, Pattabiraman D (2020) Grid-Forming inverters: A critical asset for the power grid. IEEE J Emerg Sel Top Power Electron 8: 925–935. https://doi.org/10.1109/JESTPE.2019.2959271 doi: 10.1109/JESTPE.2019.2959271
    [90] Denholm P, Mai T, Kenyon RW, et al. (2020) Inertia and the power grid : A guide without the spin. Natl Renewable Energy Lab 48. Available from: https://www.nrel.gov/docs/fy20osti/73856.pdf.
    [91] Khalilpour KR, Vassallo A (2016) Community energy networks with storage. Available from: http://link.springer.com/10.1007/978-981-287-652-2.
    [92] Prevedello G, Werth A (2021) The benefits of sharing in off-grid microgrids: A case study in the Philippines. Appl Energy 303: 117605. https://doi.org/10.1016/J.APENERGY.2021.117605 doi: 10.1016/j.apenergy.2021.117605
    [93] Montoya OD, Gil-González W, Grisales-Norena L, et al. (2019) Economic dispatch of BESS and renewable generators in DC microgrids using voltage-dependent load models. Energies 12. https://doi.org/10.3390/en12234494 doi: 10.3390/en12234494
    [94] Mahmoud M, Ramadan M, Olabi AG, et al. (2020) A review of mechanical energy storage systems combined with wind and solar applications. Energy Convers Manage 210: 112670. https://doi.org/10.3390/en14082159 doi: 10.1016/j.enconman.2020.112670
    [95] Khezri R, Oshnoei A, Hagh MT, et al. (2018) Coordination of heat pumps, electric vehicles and AGC for efficient LFC in a smart hybrid power system via SCA-Based optimized FOPID controllers. Energies 11: 420. https://doi.org/10.3390/EN11020420 doi: 10.3390/en11020420
    [96] Magdy G, Shabib G, Elbaset AA, et al. (2019) Renewable power systems dynamic security using a new coordination of frequency control strategy based on virtual synchronous generator and digital frequency protection. Int J Electr Power Energy Syst 109: 351–368. https://doi.org/10.1016/J.IJEPES.2019.02.007 doi: 10.1016/j.ijepes.2019.02.007
    [97] Tang Z, Hill DJ, Liu T (2021) Distributed coordinated reactive power control for voltage regulation in distribution networks. IEEE Trans Smart Grid 12: 312–323. https://doi.org/10.1109/TSG.2020.3018633 doi: 10.1109/TSG.2020.3018633
    [98] Lei X, Huang T, Yang Y, et al. (2019) A bi-layer multi-time coordination method for optimal generation and reserve schedule and dispatch of a grid-connected microgrid. IEEE Access 7: 44010–44020. https://doi.org/10.1109/ACCESS.2019.2899915 doi: 10.1109/ACCESS.2019.2899915
    [99] Hu M, Xiao F, Wang S (2021) Neighborhood-level coordination and negotiation techniques for managing demand-side flexibility in residential microgrids. Renewable Sustainable Energy Rev 135: 110248. https://doi.org/10.1016/J.RSER.2020.110248 doi: 10.1016/j.rser.2020.110248
    [100] Kumar J, Agarwal A, Agarwal V (2019) A review on overall control of DC microgrids. J Energy Storage 21: 113–138. https://doi.org/10.1016/J.EST.2018.11.013 doi: 10.1016/j.est.2018.11.013
    [101] Diaz NL, Dragičević T, Vasquez JC, et al. (2014) Fuzzy-logic-based gain-scheduling control for state-of-charge balance of distributed energy storage systems for DC microgrids. Conf Proc-IEEE Appl Power Electron Conf Expo-APEC, 2171–2176. https://doi.org/10.1109/APEC.2014.6803606 doi: 10.1109/APEC.2014.6803606
    [102] Bhosale R, Agarwal V (2019) Fuzzy logic control of the ultracapacitor interface for enhanced transient response and voltage stability of a dc microgrid. IEEE Trans Ind Appl 55: 712–720. https://doi.org/10.1109/TIA.2018.2870349 doi: 10.1109/TIA.2018.2870349
    [103] Zhang L, Wu T, Xing Y, et al. (2011) Power control of DC microgrid using DC bus signaling. Conf Proc-IEEE Appl Power Electron Conf Expo-APEC, 1926–1932. https://doi.org/10.1109/APEC.2011.5744859 doi: 10.1109/APEC.2011.5744859
    [104] Papadimitriou CN, Kleftakis VA, Rigas A, et al. (2014) A DC-microgrid control strategy using DC-bus signaling, IET Conference Publications, Institution of Engineering and Technology. https://doi.org/10.1049/CP.2014.1667
    [105] Xia Y, Yu M, Yang P, et al. (2019) Generation-Storage Coordination for Islanded DC microgrids dominated by PV generators. IEEE Trans Energy Convers 34: 130–138. https://doi.org/10.1109/TEC.2018.2860247 doi: 10.1109/TEC.2018.2860247
    [106] Wang T, Cheng X, Wang J, et al. (2018) Review of coordinated control strategy for AC/DC hybrid microgrid. 2nd IEEE Conf Energy Internet Energy Syst Integr EI2 2018-Proc. https://doi.org/10.1109/EI2.2018.8581990 doi: 10.1109/EI2.2018.8581990
    [107] Wang C, Li X, Guo L, et al. (2014) A nonlinear-disturbance-observer-based DC-Bus voltage control for a hybrid AC/DC microgrid. IEEE Trans Power Electron 29: 6162–6177. https://doi.org/10.1109/TPEL.2013.2297376 doi: 10.1109/TPEL.2013.2297376
    [108] Zhang C, Xu Y, Li Z, et al. (2019) Robustly coordinated operation of a Multi-Energy microgrid with flexible electric and thermal loads. IEEE Trans Smart Grid 10: 2765–2775. https://doi.org/10.1109/TSG.2018.2810247 doi: 10.1109/TSG.2018.2810247
    [109] Molyneaux L, Wagner L, Foster J (2016) Rural electrification in India: Galilee Basin coal versus decentralised renewable energy micro grids. Renewable Energy 89: 422–436. https://doi.org/10.1016/J.RENENE.2015.12.002 doi: 10.1016/j.renene.2015.12.002
    [110] Wang R, Hsu SC, Zheng S, et al. (2020) Renewable energy microgrids: Economic evaluation and decision making for government policies to contribute to affordable and clean energy. Appl Energy 274: 115287. https://doi.org/10.1016/J.APENERGY.2020.115287 doi: 10.1016/j.apenergy.2020.115287
    [111] Sechilariu M, Locment F (2016) Connecting and integrating variable renewable electricity in utility grid. Urban DC Microgrid: Intelligent Control and Power Flow Optimization, Butterworth-Heinemann, 1–33. https://doi.org/10.1016/B978-0-12-803736-2.00001-3
    [112] Kenyon RW, Bossart M, Marković M, et al. (2020) Stability and control of power systems with high penetrations of inverter-based resources: An accessible review of current knowledge and open questions. Sol Energy 210: 149–168. https://doi.org/10.1016/j.solener.2020.05.053 doi: 10.1016/j.solener.2020.05.053
    [113] McNutt P, Sekulic WR, Dreifuerst G (2018) Solar/Photovoltaic DC systems: Basics and safety, IEEE IAS Electrical Safety Workshop, IEEE Computer Society. https://doi.org/10.1109/ESW41044.2018.9063869
    [114] Dambhare MV, Butey B, Moharil SV (2021) Solar photovoltaic technology: A review of different types of solar cells and its future trends. J Phys Conf Ser 1913. https://doi.org/10.1088/1742-6596/1913/1/012053 doi: 10.1088/1742-6596/1913/1/012053
    [115] Gul M, Kotak Y, Muneer T (2016) Review on recent trend of solar photovoltaic technology. https://doi.org/10.1177/0144598716650552
    [116] Pulli E, Rozzi E, Bella F (2020) Transparent photovoltaic technologies: Current trends towards upscaling. Energy Convers Manag 219: 112982. https://doi.org/10.1016/j.enconman.2020.112982 doi: 10.1016/j.enconman.2020.112982
    [117] Khan MR, Patel MT, Asadpour R, et al. (2021) A review of next generation bifacial solar farms: predictive modeling of energy yield, economics, and reliability. J Phys D Appl Phys 54: 323001. Available from: https://iopscience.iop.org/article/10.1088/1361-6463/abfce5.
    [118] Hasan A, Dincer I (2020) A new performance assessment methodology of bifacial photovoltaic solar panels for offshore applications. Energy Convers Manage 220: 112972. https://doi.org/10.1016/J.ENCONMAN.2020.112972 doi: 10.1016/j.enconman.2020.112972
    [119] Gu W, Ma T, Ahmed S, et al. (2020) A comprehensive review and outlook of bifacial photovoltaic (bPV) technology. Energy Convers Manage 223: 113283. https://doi.org/10.1016/j.enconman.2020.113283 doi: 10.1016/j.enconman.2020.113283
    [120] Guo S, Walsh TM, Peters M (2013) Vertically mounted bifacial photovoltaic modules: A global analysis. Energy 61: 447–454. https://doi.org/10.1016/J.ENERGY.2013.08.040 doi: 10.1016/j.energy.2013.08.040
    [121] Odetoye OA, Ibikunle FA, Olulope PK, et al. (2022) Large-Scale solar power in Nigeria: The case for floating photovoltaics, 2022 IEEE Nigeria 4th International Conference on Disruptive Technologies for Sustainable Development (NIGERCON), Lagos, IEEE, 520–524. https://doi.org/10.1109/NIGERCON54645.2022.9803156
    [122] Wu Y, Li L, Song Z, et al. (2019) Risk assessment on offshore photovoltaic power generation projects in China based on a fuzzy analysis framework. J Clean Prod 215: 46–62. https://doi.org/10.1016/J.JCLEPRO.2019.01.024 doi: 10.1016/j.jclepro.2019.01.024
    [123] Zhou J, Su X, Qian H (2020) Risk assessment on offshore photovoltaic power generation projects in china using D Numbers and ANP. IEEE Access 8: 144704–144717. https://doi.org/10.1109/ACCESS.2020.3014405 doi: 10.1109/ACCESS.2020.3014405
    [124] Golroodbari SZ, van Sark W (2020) Simulation of performance differences between offshore and land-based photovoltaic systems. Prog Photovoltaics Res Appl 28: 873–886. Available from: https://onlinelibrary.wiley.com/doi/full/10.1002/pip.3276
    [125] Golroodbari SZM, Vaartjes DF, Meit JBL, et al. (2021) Pooling the cable: A techno-economic feasibility study of integrating offshore floating photovoltaic solar technology within an offshore wind park. Sol Energy 219: 65–74. https://doi.org/10.1016/J.SOLENER.2020.12.062 doi: 10.1016/j.solener.2020.12.062
    [126] 
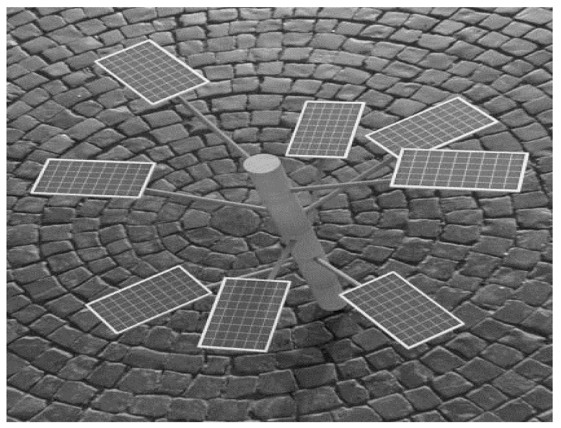
Verma NN, Mazumder S (2015) An investigation of solar trees for effective sunlight capture using monte carlo simulations of solar radiation transport. ASME 2014 International Mechanical Engineering Congress and Exposition. https://doi.org/10.1115/IMECE2014-36085 doi: 10.1115/IMECE2014-36085
    [127] Gangwar P, Kumar NM, Singh AK, et al. (2019) Solar photovoltaic tree and its end-of-life management using thermal and chemical treatments for material recovery. Case Stud Therm Eng 14: 100474. https://doi.org/10.1016/J.CSITE.2019.100474 doi: 10.1016/j.csite.2019.100474
    [128] Mostafaeipour A, Rezaei M, Jahangiri M, et al. (2019) Feasibility analysis of a new tree-shaped wind turbine for urban application: A case study. 31: 1230–1256. https://doi.org/101177/0958305X19888878
    [129] Berny S, Blouin N, Distler A, et al. (2016) Solar trees: First large-scale demonstration of fully solution coated, semitransparent, flexible organic photovoltaic modules. Adv Sci 3: 1500342. https://doi.org/10.1016/J.CSITE.2019.100474 doi: 10.1002/advs.201500342
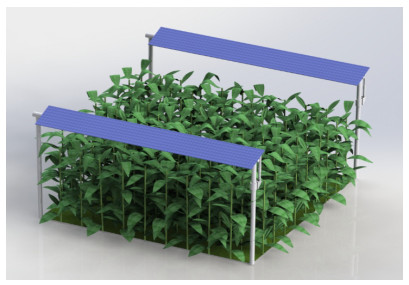
    [130] Perna A, Grubbs EK, Agrawal R, et al. (2019) Design considerations for Agrophotovoltaic systems: Maintaining PV area with increased crop yield. Conference Record of the IEEE Photovoltaic Specialists Conference Institute of Electrical and Electronics Engineers Inc., 668–672. https://doi.org/10.1109/PVSC40753.2019.8981324
    [131] Amaducci S, Yin X, Colauzzi M (2018) Agrivoltaic systems to optimise land use for electric energy production. Appl Energy 220: 545–561. https://doi.org/10.1016/j.apenergy.2018.03.081 doi: 10.1016/j.apenergy.2018.03.081
    [132] Weselek A, Ehmann A, Zikeli S, et al. (2019) Agrophotovoltaic systems: applications, challenges, and opportunities. A review. Agron Sustainable Dev 39: 1–20. Available from: https://link.springer.com/article/10.1007/s13593-019-0581-3.
    [133] Schindele S, Trommsdorff M, Schlaak A, et al. (2020) Implementation of agrophotovoltaics: Techno-economic analysis of the price-performance ratio and its policy implications. Appl Energy 265: 114737. https://doi.org/10.1016/J.APENERGY.2020.114737 doi: 10.1016/j.apenergy.2020.114737
    [134] IEA (2019) The future of hydrogen, Paris. Available from: https://www.iea.org/reports/the-future-of-hydrogen#.
    [135] Han Y, Pu Y, Li Q, et al. (2019) Coordinated power control with virtual inertia for fuel cell-based DC microgrids cluster. Int J Hydrogen Energy 44: 25207–25220. https://doi.org/10.1016/J.IJHYDENE.2019.06.128 doi: 10.1016/j.ijhydene.2019.06.128
    [136] Tostado-Véliz M, Kamel S, Hasanien HM, et al. (2022) A mixed-integer-linear-logical programming interval-based model for optimal scheduling of isolated microgrids with green hydrogen-based storage considering demand response. J Energy Storage 48: 104028. https://doi.org/10.1016/J.EST.2022.104028 doi: 10.1016/j.est.2022.104028
  • Reader Comments
  • © 2022 the Author(s), licensee AIMS Press. This is an open access article distributed under the terms of the Creative Commons Attribution License (http://creativecommons.org/licenses/by/4.0)
通讯作者: 陈斌, bchen63@163.com
  • 1. 

    沈阳化工大学材料科学与工程学院 沈阳 110142

  1. 本站搜索
  2. 百度学术搜索
  3. 万方数据库搜索
  4. CNKI搜索

Metrics

Article views(3565) PDF downloads(269) Cited by(3)

Figures and Tables

Figures(10)

/

DownLoad:  Full-Size Img  PowerPoint
Return
Return

Catalog