
Citation: J. Appelbaum. A static multiple detector solar radiation sensor[J]. AIMS Energy, 2020, 8(5): 802-818. doi: 10.3934/energy.2020.5.802
[1] | Zhen Liu, Song Yang, Tao Ding, Ruimin Chai . Dynamic modeling and performance analysis of a lower-mobility parallel robot with a rotatable platform. Mathematical Biosciences and Engineering, 2023, 20(2): 3918-3943. doi: 10.3934/mbe.2023183 |
[2] | Zhen Liu, Song Yang, Chen Cheng, Tao Ding, Ruimin Chai . Study on modeling and dynamic performance of a planar flexible parallel manipulator based on finite element method. Mathematical Biosciences and Engineering, 2023, 20(1): 807-836. doi: 10.3934/mbe.2023037 |
[3] | Dawei Ren, Xiaodong Zhang, Shaojuan Lei, Zehua Bi . Research on flexibility of production system based on hybrid modeling and simulation. Mathematical Biosciences and Engineering, 2021, 18(1): 933-949. doi: 10.3934/mbe.2021049 |
[4] | Dan Yang, Zhiqiang Xie, Chunting Zhang . Multi-flexible integrated scheduling algorithm for multi-flexible integrated scheduling problem with setup times. Mathematical Biosciences and Engineering, 2023, 20(6): 9781-9817. doi: 10.3934/mbe.2023429 |
[5] | Lingling Wei, Haiyi Liu, Lifeng Wu . Spatial distribution of floating population in Beijing, Tianjin and Hebei Region and its correlations with synergistic development. Mathematical Biosciences and Engineering, 2023, 20(3): 5949-5965. doi: 10.3934/mbe.2023257 |
[6] | Yun Kang, Sourav Kumar Sasmal, Komi Messan . A two-patch prey-predator model with predator dispersal driven by the predation strength. Mathematical Biosciences and Engineering, 2017, 14(4): 843-880. doi: 10.3934/mbe.2017046 |
[7] | T. J. Newman . Modeling Multicellular Systems Using Subcellular Elements. Mathematical Biosciences and Engineering, 2005, 2(3): 613-624. doi: 10.3934/mbe.2005.2.613 |
[8] | Bo Kou, Jinde Cao, Wei Huang, Tao Ma . The rutting model of semi-rigid asphalt pavement based on RIOHTRACK full-scale track. Mathematical Biosciences and Engineering, 2023, 20(5): 8124-8145. doi: 10.3934/mbe.2023353 |
[9] | Mette S. Olufsen, Ali Nadim . On deriving lumped models for blood flow and pressure in the systemic arteries. Mathematical Biosciences and Engineering, 2004, 1(1): 61-80. doi: 10.3934/mbe.2004.1.61 |
[10] | Zhen Yang, Junli Li, Liwei Yang, Qian Wang, Ping Li, Guofeng Xia . Path planning and collision avoidance methods for distributed multi-robot systems in complex dynamic environments. Mathematical Biosciences and Engineering, 2023, 20(1): 145-178. doi: 10.3934/mbe.2023008 |
Liver cancer is a highly malignant tumor and the main cause of cancer-related mortality worldwide [1, 2]. Hepatocellular carcinoma (HCC) is the most common type of liver cancer. For HCC in the early stages, surgery or ablation can yield good therapeutic effects but statistically, the recurrence rate within 5 years is as high as 70%. Moreover, most HCC cases are first diagnosed in advanced stages and the opportunity for operating is lost. The treatment strategy for advanced HCC is lacking. The recommended first-line treatment is sorafenib [3, 4] but its survival benefit for advanced HCC cases is limited [5, 6]; primary or secondary drug resistance may also occur. In order to overcome this difficulty in treatment, immune checkpoint inhibitors are promising new avenues. Currently, anti-PD-1 treatment is recommended as class 2Afirst-line treatment for HCC, however, the results of clinical trials show that the objective remission rate (ORR) for first-line use of anti-programmed cell death protein 1 (anti-PD-1) antibody in patients with advanced tumors is only 20% [7, 8, 9], that is, anti-PD-1 monotherapy is ineffective in nearly 80% of HCC patients. Unfortunately, the reason for HCC resistance to anti-PD-1 treatment remains elusive.
The tumor immune microenvironment (TME) composed of the tumor, immune, and stromal cells is related to the clinical outcomes of immunotherapy [10, 11]. In tumors, the immune microenvironment has a complex relationship with the occurrence and development of cancer and is regulated by tumor-infiltrating immune cells (TIICs) [12, 13]. Accumulating evidence suggests that TIICs play an important role as prognostic markers and potential therapeutic targets [14]. TIICs have been widely used for the prediction of clinical outcomes in cancer treatment [15, 16]. Immune checkpoint inhibitors mainly act on immune cells in the tumor microenvironment and promote tumor progression in several ways [17, 18, 19]; abnormal signaling activation in the tumor can re-design the tumor microenvironment, thereby losing its original inhibitory effect on the tumor and promoting tumor progression. For example, previous studies have shown that β-catenin activation plays an important role in immune escape and anti-PD-1 treatment resistance in HCC [20]; these results have been confirmed in mouse models [21]. However, these findings may only reflect one aspect of the abnormal immune microenvironment of HCC. Thus far, a systematic analysis of the immune microenvironment of HCC is lacking. The screening strategy for HCC patients who are suitable for undergoing immunotherapy and can benefit from it is unclear. Therefore, it is urgent to systematically analyze the immune microenvironment of HCC and screen the population suitable for undergoing treatment using immune checkpoint inhibitors, so as to provide a basis for their clinical application.
In this study, we collected TCGA-LIHC-related data sets and evaluated immune microenvironment and immune cell infiltration in HCC using CIBERSORT and ESTIMATE algorithms. Three independent immune cell infiltration (ICI) subtypes with significant survival differences were identified. Further analysis suggested that there were significant differences in the expressions of different immune cell subsets among these immune subtypes. Moreover, the level of PD1/PD-L1 expression and the characteristics of ICI were different among the subtypes, however, interactions among immune cells were found. The differentially expressed genes between high- and low- immunogenicity score (IPS) groups in HCC were identified, along with the immune gene subtypes for HCC. Based on the key genes among the immune gene subtypes of HCC, the ICI scoring model was constructed. It showed good performance for prognostic prediction in TCGA-LIHC data set. According to the median ICI score, HCC samples were divided into high- and low-score groups to examine the differences between different groups in terms of tumor genome mutation burden and immunotherapy benefits in HCC. This would help in making accurate immunotherapeutic decisions for HCC patients. In order to further simplify its clinical application, an accurate judgment based on the subtype of tumor immune infiltration score and identification of high-quality biomarkers are effective. The selected genes were cross-verified by a binary decision tree, and finally, four genes were selected. These genes were clinical markers of HCC. The findings are expected to provide a basis for screening subgroups most suited for clinical medication.
The expression profile data of LIHC patients and their clinical follow-up information were downloaded from TCGA database (https://portal.gdc.cancer.gov/). The RNA-sequencing (RNA-Seq) data of TCGA-LIHC were processed in the following manner: 1) samples without clinical follow-up information were removed; 2) samples with an unknown time to live (TTL), those less than 30 days, or no information on survival status was removed; 3) probes were converted to Gene Symbol; 4) if a probe corresponded to multiple genes, it was removed, and 5) if there were multiple Gene Symbol expression profiles, the median value was taken. An overview of the steps followed for data processing is depicted in the analysis flow chart (Figure 1). A total of 342 tumor samples were identified from the pre-processed TCGA-LIHC data. The clinical statistical information on the samples is presented in Table 1.
TCGA-LIHC | ||
Survival | ||
OS | status_0 | 220 |
status_1 | 122 | |
Grade | ||
G1 | 53 | |
G2 | 162 | |
G3 | 110 | |
G4 | 12 | |
G_un | 5 | |
Age | ||
Age > 60 | 177 | |
Age ≤ 60 | 165 | |
Gender | ||
Female | 108 | |
Male | 234 | |
stage | ||
stage_Ⅰ | 162 | |
stage_Ⅱ | 78 | |
stage_Ⅲ | 75 | |
stage_Ⅳ | 3 | |
stage_un | 21 | |
Mstage | ||
M0 | 244 | |
M1 | 3 | |
MX | 95 | |
M_un | 0 | |
Nstage | ||
N0 | 238 | |
N1 | 3 | |
N2 | 0 | |
NX | 100 | |
N_un | 1 | |
Tstage | ||
T1 | 169 | |
T2 | 85 | |
T3 | 72 | |
T4 | 13 | |
T_un | 3 | |
PT (Pharmaceutical therapy) | ||
YES | 29 | |
TCGA-LIHC | ||
NO | 109 | |
UN | 204 | |
RT (Radiation therapy) | ||
YES | 9 | |
NO | 128 | |
UN | 205 |
Tumor IPS was obtained from The Cancer Immunome Database (TCIA) (https://tcia.at/patients). IPS is defined based on tumor immune infiltration features and bridges ICI with immunogen subtypes. "Pan-cancer Immunogenomic Analyses Reveal Genotype-Immunophenotype Relationships and Predictors of Response to Checkpoint Blockade" (https://doi.org/10.1016/j.celrep.2016.12.019).
Using the CIBERSORT package in R, infiltration levels of 22 different immune cells in LIHC (B cells naive, B cells memory, Plasma cells, T cells CD8, T cells CD4 naive, T cells CD4 memory resting, T cells CD4 memory activated, T cells follicular helper, T cells regulatory, T cells gamma delta, Natural killer (NK) cells resting, NK cells activated, Monocytes, Macrophages M0, Macrophages M1, Macrophages M2, Dendritic cells resting, Dendritic cells activated, Mast cells resting, Mast cells activated, Eosinophils, and Neutrophils) were quantified. The degree of immune infiltration and the score of stroma purity in each LIHC sample were evaluated using the ESTIMATE package in R. Subsequently, unsupervised clustering was performed by the Pam method, which was based on Euclid and Ward's linkage. Herein, the Consensus Cluster Plus package in R was used and 1000 iterations were performed to ensure the stability of the classification.
The optimal density gradient threshold of tumor IPS associated with survival was calculated using the Survminer package in R, whereby tumor samples were divided into two groups, high and low scores. Subsequently, using the limma package in R software, gene differential expression analysis between the high- and low- IPS groups of TCGA-LIHC tumor samples was performed. The screening thresholds used for the analysis were as follows: adjusted. p < 0.05 and |log2(Fold Change)| > 1; among them, genes that were positively correlated with the consistent classification results were referred to as immune gene subtype-related feature A, while the remaining comprised feature B.
To quantify ICI in tumors based on gene expression, a tumor ICI scoring model was constructed using immune gene subtype-associated feature A and B gene sets. Following was the process: 1) sizes of feature A and B gene sets were reduced using the Boruta algorithm thereby decreasing noise or/and the number of redundant genes. 2) Two total scores, namely ICI score A (for ICI signature gene A) and ICI score B (for ICI signature gene B) were calculated using principal component analysis (PCA) with the following equation:
ICI_scores=∑PC1(A)−∑PC1(B) |
The corresponding mutation data of TCGA-COAD and TCGA-READ patients were downloaded from TCGA data portal (https://www.cancer.gov/tcga/). To assess the somatic mutation burden in LIHC, the total number of nonsynonymous mutations was used as a quantitative index, followed by the calculation of the optimal density gradient threshold of tumor mutation burden (TMB) score associated with the survival using Survminer package in R. Based on high- or low-TMB scores, the samples were divided into two groups. The mutation frequencies of the top 30 driver genes in the high- and low-ICI score groups were also compared using the maftool package in R.
To examine the relationship between ICI scores and immunotherapy, the efficiency of ICI scores in predicting patient treatment benefits was further evaluated. Based on the expression profile data and clinical information in the IMvigor210 cohort (http://research-pub.gene.com/IMvigor210CoreBiologies/), the ICI scoring model was used to classify all samples into the high-score group (High) or low-score group (Low). Similarly, the GSE78220 dataset (ftp://ftp.ncbi.nlm.nih.gov/geo/series/GSE78nnn/GSE78220/matrix/) in GEO was downloaded for the corresponding analysis.
All statistical comparisons involved in this study alongside the hypothesis testing for the significance of differences between groups were based on the statistical analysis methods in R 3.6.
Three independent ICI subtypes with significant survival differences were identified based on the infiltration levels of 22 immune cell types (Table S1) in each sample of TCGA-LIHC dataset and assessment of tumor purity (Table S2), as shown in Figure 2A-J.
Amongst the three, ICI1 and ICI2 showed a significantly better prognosis with a median survival of 818 days, while ICI 1/3 was associated with a poorer prognosis with a median survival time of 581 days (Figure 3A). A heat map based on the correlation coefficient was used to visualize the correlation between different immune cell types (purity of 22 types of immune cells, tumor cells, and stromal cells) in the TME; the results indicated the prevalent interactions between immune cells, as shown in Figure 3B. A comparison of the TME components of the three molecular subtypes revealed the intrinsic biological differences resulting in different clinical phenotypes; these were subsequently visualized using heat maps (Figure 3C, D). The feature distribution of the ICI3 subtype with a poor prognosis suggested a significantly high level of infiltration of macrophages M2, mast cell resting in ICI3. On the contrary, T cells CD8+, T cells CD4 memory resting, T cell follicular helper, T cells regulatory (Tregs), macrophages M0, macrophages M1, and plasma cells showed lower infiltration.
The expression of two important immune checkpoints, PD1 and PD-L, in each ICI subtype was also analyzed. Our results indicated that the features in ICI1/2 subtypes were characterized by a significantly higher expression level of PD1 expression as compared to that in the ICI3 subtype. The significance of the observed differences was confirmed using the Kruskal-Wallis test (Figure 3E, F).
The IPS for TCGA-LIHC dataset from TCIA database (https://tcia.at/patients) was collected, as shown in Table S3. The optimal density gradient threshold for IPS associated with survival was calculated using the Survminer package in R. Ultimately, TCGA-LIHC tumor samples were divided into two groups with high or low IPS values using the threshold of 7.75; significant survival differences were found between the two groups, as shown in Figure 4A, B.
Gene differential expression analysis was performed between high- and low-IPS groups comprising TCGA-LIHC tumor samples using the limma package in R software. Of the total 359 identified DEGs (Table S4), 325 were markedly high in the high IPS group while 34 showed enhanced expression in the low IPS group. On subsequent unsupervised clustering of all 359 IPS-DEGs, the tumor samples of TCGA-LIHC could be classified into three immune gene subtypes (IGS 1, 2, and 3) with significant survival differences among them, as shown in Figure 5A-J.
All gene features positively associated with the immune gene subtypes were the ICI gene features A (~87), while the remaining 272 IPS-DEGs comprised ICI gene features B (~272) (Table S5, Figure 6A, B). Further functional enrichment analysis for GO terms related to ICI gene signatures A and B was performed using the clusterProfiler package in R. The top 10 pathways enriched in the three functional classifications (BP, CC, and MF) are shown in the bubble chart in Figures 6C, D. The results illustrated that most of the enriched pathways were related to immunobiological processes.
Correlation analysis revealed significant differences in the features of the majority of ICIs in tumors between different immune gene subtypes (Figure 6E). Similarly, the levels of PD1/PD-L1 expression showed substantial differences among the three immune gene subtypes (Figure 6F, G). IGS2 was associated with higher PD-L1 expression and lower PD1 levels. Taken together, consistency was observed between the ICI features and prognostic profiles of different immune gene subtypes, thus confirming that the classification method for immune cell subtypes was scientific and reasonable.
To quantify ICI in tumors according to the gene expression, a tumor ICI scoring model was constructed based on a set of ICI gene features and B. Subsequently, the optimal density gradient threshold of tumor ICI scores associated with survival was calculated. A value of 6.85 was selected as the threshold to divide the tumor samples in TCGA-LIHC into two groups with high or low ICI scores. There was a significant difference in survival between the two groups (Figure 7A, B).
The prognostic impact of ICI scores was evaluated. Subgroup analysis of ICI scores using Kaplan-Meier analysis revealed that patients in the high ICI score group had significantly higher OS rates than those in the low ICI score group (Figure 8A). The impact of radiotherapy on the prognosis of each ICI subgroup was evaluated. A clear trend toward survival advantage amongst patients receiving adjuvant therapy (Figure 8B) and chemotherapy (Figure 8C) was observed. The Sankey diagram of transformations among immune gene subtypes, ICI score groups, and survival status was shown in Figure 8D. After we could determine the prognostic value of the ICI score in TCGA-LIHC cohort dataset, the immunocompetence and tolerance conditions of each group necessitated analysis. Thus, CD274, CTLA4, HAVCR2, IDO1, LAG3, and PDCD1 were selected as immune checkpoint-related features, while CD8A, CXCL10, CXCL9, GZMA, GZMB, IFNG, PRF1, TBX2, and TNF comprised the immune activation-related features. Except for IDO1, TBX2, and TNF, most of the genes related to immune checkpoints and immune activation were significantly overexpressed in the high ICI group (Figure 8F). The biological differences between high- and low-ICI score groups were investigated by gene set enrichment analysis (GSEA), whereby the top ten enriched pathways included KEGG_ALLOGRAFT REJECTION, KEGG_ANTIGEN PROCESSING AND_PRESENTATION, KEGG_CELL ADHESION MOLECULES CAMS, KEGG_CHEMOKINE SIGNALING PATHWAY, KEGG_CYTOKINE CYTOKINE RECEPTOR INTERACTION, KEGG_GRAFT VERSUS HOST DISEASE, KEGG_HEMATOPOIETIC CELL LINEAGE, KEGG_LEISHMANIA INFECTION, and KEGG_NATURAL KILLER CELL MEDIATED CYTOTOXICITY, KEGG_PRIMARY IMMUNODEFICIENCY (Figure 8E).
Accumulating evidence suggests that TMB may determine an individual's response to cancer immunotherapy. Therefore, evaluating the intrinsic link between TMB and ICI scores to elucidate the genetic traits of each ICI group is a meaningful logical step. Therefore, the Survminer package in R was used to calculate the optimal density gradient threshold of the TMB score associated with survival. A value of 1.75 was chosen as the threshold to divide the tumor samples in TCGA-LIHC into two groups with high- or low-TMB scores. We observed a significant difference in survival between the two groups (Figure 9A, B).
The TMB of patients in the high ICI and low ICI score groups was compared (Figure 10A). The group of patients with higher ICI scores showed considerably lower TMB relative to the group with lower ICI scores. Further, correlation analysis confirmed that ICI scores were negatively correlated with TMB (Figure 10B). Next, patients were divided into discrete high- or low-TMB groups based on the immune set point of TMB (Figure 10C); patients with lower TMB showed better OS than those with higher TMB.
Given the prognostic value of TMB and ICI scores, the synergistic effects of these scores for prognostic stratification of LIHC were evaluated. The results indicated that TMB status did not interfere with predictions based on ICI scores. Moreover, ICI score subtypes showed significant survival differences between the high- and low-TMB groups (Figure 10D). Overall, these findings suggested that ICI scores may serve as a potential predictor independent of the TMB as also a valid measure of response to immunotherapy.
We also evaluated the distribution of somatic variants in LIHC driver genes between the low- and high-ICI groups. The top 30 driver genes with the highest frequency of change were compared (Figure 10E, F). Analysis of mutation annotation files for TCGA-LIHC cohort revealed significant differences in the mutational profiles between the high- and low-ICI groups. Indeed, these results may provide new ideas to elucidate the mechanism underlying tumor ICI composition and gene mutations in immune checkpoints.
At present, novel immune checkpoint blockade therapies are used in cancer treatment to block T-cell suppressor molecules for cancer therapy. To examine the relationship between ICI scores and immunotherapy, the efficiency of ICI scores in predicting patient treatment benefits was further evaluated. Based on expression profile data and clinical information from the IMvigor210 cohort (http://research-pub.gene.com/IMvigor210CoreBiologies/), the ICI scoring model was used to classify all samples into the high-score group (High) or low-score group (Low). The findings showed that high scores of patients in the IMvigor210 cohort were associated with objective responses to anti-PD-L1 therapy (Figure 11A). Moreover, patients with high scores lived significantly longer than those with low scores (Figure 11B). The objective response rate to anti-PD-L1 therapy was higher in the high-score group as compared to the low-score group in the IMvigor210 cohort (Figure 11C). Similar results were observed in the GSE78220 cohort of GEO, wherein different immunotherapies, including cytokines, vaccines, and checkpoint blockers were administered (Figure 11D-F). Overall, these data suggest that ICI scores may correlate with responses to immunotherapies.
Identification of high-quality biomarkers is a proven strategy for simplifying clinical work to make accurate judgments for the tumor ICI subtypes. Therefore, 359 IPS-DEGs associated with tumor immunophenotypes screened previously were evaluated for their classification accuracies. The Caret package was used to construct a binary decision tree and perform cross-validation (k = 5) based on specificity, sensitivity, likelihood ratio (LR), and area under the curve (AUC). The results indicated that GBP5 was located at the root of the binary decision tree; its AUC was 79.76% (Figure 12A). Finally, the model yielded a total of 15 genes with importance scores (Table S6), of which the four genes, namely GBP5 (AUC: 0.9590), MZB1 (AUC: 0.9460), TIGIT (AUC: 0.9675), and HLA-DOB (AUC: 0.9018) were retained in the binary decision tree (Figure 12B). These four genes may serve as candidate biomarkers.
The benefits of chemotherapy and targeted therapy are currently limited for HCC; immune checkpoint inhibitors seem to be promising for HCC treatment. However, the results of several clinical trials seem unsatisfactory. Checkmate 040 is a phase Ⅰ / Ⅱ clinical trial for the anti-programmed cell death protein 1 (anti-PD-1) antibody, nivolumab, in patients with advanced HCC. The results showed that the objective remission rate (ORR) was 20% and the disease control rate (DCR) was 64% [7]. In the Keynote-224 experiment, pembrolizumab, an anti-PD-1 antibody, was administered to patients showing progression after sorafenib treatment; the ORR was 17% and DCR was 62% [8]. Unfortunately, no positive results were obtained in the phase Ⅲ experiment [22, 23], which highlights the urgent need to analyze the special immune microenvironment characteristics of HCC and screen subgroups showing good responses to ICIs, so as to provide a theoretical basis for clinical immunotherapy.
Previous studies have shown that TIICs play an important role in patients' prognoses [24, 25, 26, 27, 28]. Thus far, existing studies have conducted correlation analysis on the distributional characteristics of TIICs in HCC and their impacts on prognosis [29, 30], however, a comprehensive analysis on TIICs in HCC is lacking [31]. In this study, we first divided HCC patients into three subtypes showing different prognoses according to the infiltration levels of immune cells. There were significant differences in the types of immune cell infiltrates among the three subtypes. For instance, M2 macrophage proportion was higher in ICI3 with poor prognosis, while ICI1/2 subtypes with good prognoses were characterized by high abundances of CD8 positive T cells and low levels of M2 macrophages, consistent with the results of previous studies [32, 33, 34, 35], thus proving the credibility of our analysis. However, the levels of PD1/PD-L1 expression in ICI1/2 subtypes were significantly higher, while those of PD1/PD-L1 in the ICI3 subtype were lower. This phenomenon differed from our conventional understanding. On the one hand, it showed that the level of PD1/PD-L1 expression cannot fully represent the characteristics of immune cell infiltration. On the other hand, it led to reasonably speculate that the expression of immune-related genes does not completely correspond to immune cells. Therefore, it prompted us to further analyze the immune-related genes.
HCC samples were divided into high- or low-expression groups according to their IPSs, followed by DEG analysis between the two groups. After cluster analysis, HCC tumor samples could be divided into three immune gene subtypes with obvious survival differences among them. The levels of PD1/PD-L1 expression showed significant differences among the three immune gene subtypes. It was speculated that gene differences may better predict the levels of PD1/PD-L1 expression, rather than the differences in immune cell infiltrates. PDL1 is an important prognostic indicator of the efficacy of immune checkpoint inhibitors [36]. It is recommended to use immune checkpoint inhibitors for patients with high PDL1 expression in tumors [37, 38, 39]. Thus, we classified HCC patients into different subtypes based on prognosis and PD1/PD-L1 according to their immune-related gene expression. In order to further simplify the accurate judgment of tumor immune infiltration score subtypes in clinical settings, identifying high-quality biomarkers is an effective strategy. Therefore, a binary decision tree was constructed and cross-validated for DEGs related to tumor immunogenicity. Finally, the four following genes were obtained: GBP5 (guanylate binding protein 5), MZB1 (marginal zone B - and B1 cell-specific protein), TIGIT (T-cell immunoreceptor with Ig and ITIM domains), and HLA-DOB (HLA class Ⅱ histocompatibility antigen, DO beta chain). Among them, GBP5 [40, 41], MZB1 [42, 43], and TIGIT [44] have been previously shown to promote tumor progression. TIGIT is an inhibitory receptor. Studies have shown that blocking PD-L1 and TIGIT can improve tumor efficacy [45, 46]. HLA-DOB can be used as the core gene in the immune prediction model [47, 48]. Taken together, these genes can be used as candidate biomarkers to greatly simplify clinical judgments and improve the possibility of clinical transformation.
Another predictor of the efficacy of immune checkpoint inhibitors is TMB, whereby the cumulative increase in gene mutations leads to an increase in the TMB, thereby enhancing heterotypic protein synthesis and leading to an increased probability of recognition by immune cells collectively [49, 50, 51, 52]. In this study, we divided the tumor samples into two groups with high- or low TMB scores; significant differences in survival between the two groups were observed. In order to simplify the immune status of HCC, we used gene expression to quantify the immune cell infiltration levels in the tumor. The tumor samples were divided into two groups with high- or low ICI scores. The ICI score does not only distinguish the prognosis of HCC but the OS rate of patients in the high ICI score group was significantly higher than that in the low ICI score group; similar trends were observed for ORR of anti-PD-L1 treatment between the two groups. The same trend of survival advantage was observed as that for patients receiving chemotherapy but further analysis showed that ICI score was significantly negatively correlated with TMB, which is different from previously reported conclusions. This could be related to the special immune microenvironment in HCC. However, more systematic sequencing and clinical experiments are necessary to validate our findings.
There are some limitations to this study. First, we only used public data for analysis, and not the real clinical data for further verification. Second, the specific analysis of the impact of various treatments on immune typing and its characteristics was lacking. Finally, functional verification using in vivo and in vitro experiments for the main prognostic genes needs to be performed in the future.
In conclusion, we systematically analyzed the immune microenvironment of HCC, divided the samples into different subtypes according to the prognosis, described the characteristics of immune cell infiltration levels and immune-related gene expression for each subtype, and provided the efficacy characteristics of each subtype of HCC for immune checkpoint inhibitors. More importantly, we screened four representative tumor immunogenicity-related DEGs, which are expected to simplify clinical work and enhance the possibility of transformation.
This work was supported by grants from the Project of Education Department in Liaoning Province (No. LJKZ1133, No. LNSJYT201917, No. LNSJYT201910), Dandong science and Technology Guidance Plan Project (No. 24), and Innovation Training Program for College Students in Liaoning Province (No. D202103191824376007).
The authors declare no potential competing interests.
[1] |
Faiman D, Feuermann D, Ibbetson P, et al. (1992) A multipyranometer instrument for obtaining the solar beam and diffuse components, and the irradiance on inclined planes. Sol Energy 48: 253-259. doi: 10.1016/0038-092X(92)90099-V
![]() |
[2] |
Curtis P (1993) An analysis of methods for deriving the constituent insolation components from multipyranometer array measurements. J Sol Energy Eng 115: 11-21. doi: 10.1115/1.2930018
![]() |
[3] |
Hamalainen M, Nurkkanen P, Slaen T (1985) A multisensory pyranometer for determination of the direct component and angular distribution of solar radiation. Sol Energy 35: 511-525. doi: 10.1016/0038-092X(85)90120-3
![]() |
[4] |
Appelbaum J, Bergshtein O (1987) Solar radiation distribution Sensor. Sol Energy 39: 1-10. doi: 10.1016/S0038-092X(87)80046-4
![]() |
[5] |
Imamura M, Helm P (1992) A novel method of monitoring global normal irradiance with a stationary sensor. Int J Sol Energy 11: 211-217. doi: 10.1080/01425919208909741
![]() |
[6] | Heisterkamp N, Orthjohann E, Voss J (1994) A multi-purpose irradiance measuring system. 12th European photovoltaic solar Energy conference, Amsterdam, The Netherlans. |
[7] |
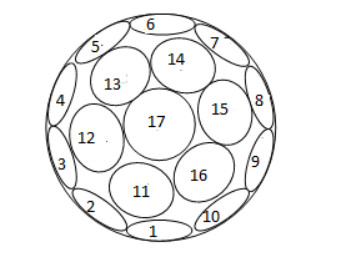
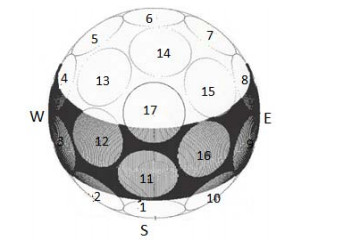
Appelbaum J, Weiss Y (1999) The packing of circles on a hemisphere. Meas Sci Technol 10: 1015-1019. doi: 10.1088/0957-0233/10/11/307
![]() |
[8] |
Bany J, Appelbaum J (1987) The effect of shading on the design of a field of solar collectors. Sol Cells 20: 201-228. doi: 10.1016/0379-6787(87)90029-9
![]() |
[9] |
Temp RC, Coulson KL (1977) Solar radiation incident upon slopes of different orientations. Sol Energy 19: 179-184. doi: 10.1016/0038-092X(77)90056-1
![]() |
[10] | Klucher TM (1979) Evaluation of models to predict insolation on tilted surfaces. Sol Energy 23: 111-114. |
[11] |
Perez R, Ineichen P, Seal P, et al. (1990) Modeling daylight availability and irradiance componens from direct and global irradiance. Sol Energy 44: 271-289. doi: 10.1016/0038-092X(90)90055-H
![]() |
1. | Zhangping You, Wenhui Zhang, Jinmiao Shen, Yangfan Ye, Xiaoping Ye, Shuhua Zhou, Adaptive neural network vibration suppression control of flexible joints space manipulator based on H∞ theory, 2023, 1392-8716, 10.21595/jve.2022.22797 | |
2. | Xiaozong Song, Xiaorong Wang, Jidong Wang, Haitao Fu, Design and Analysis of an Inverted XY-3RPS Hybrid Mechanism for Polishing of Complex Surface, 2022, 15, 22127976, 422, 10.2174/2212797615666220606094601 | |
3. | Qingyun Zhang, Xinhua Zhao, Inverse Dynamics Modeling and Simulation Analysis of Multi-Flexible-Body Spatial Parallel Manipulators, 2023, 12, 2079-9292, 2038, 10.3390/electronics12092038 | |
4. | Yunxia Wei, Yuanfei Zhang, Bin Hang, Construction and management of smart campus: Anti-disturbance control of flexible manipulator based on PDE modeling, 2023, 20, 1551-0018, 14327, 10.3934/mbe.2023641 | |
5. | Zhang Wenhui, Ma Jing, Ding Shuaibo, Wu Maojun, Yi Dajian, Huang Xiaochen, Chen Rui, 2023, Improved Sliding Mode Variable Structure Control of Robot Manipulators with Flexible Joints based on Singular Perturbation, 979-8-3503-4296-3, 288, 10.1109/ICTEI60496.2023.00084 |
TCGA-LIHC | ||
Survival | ||
OS | status_0 | 220 |
status_1 | 122 | |
Grade | ||
G1 | 53 | |
G2 | 162 | |
G3 | 110 | |
G4 | 12 | |
G_un | 5 | |
Age | ||
Age > 60 | 177 | |
Age ≤ 60 | 165 | |
Gender | ||
Female | 108 | |
Male | 234 | |
stage | ||
stage_Ⅰ | 162 | |
stage_Ⅱ | 78 | |
stage_Ⅲ | 75 | |
stage_Ⅳ | 3 | |
stage_un | 21 | |
Mstage | ||
M0 | 244 | |
M1 | 3 | |
MX | 95 | |
M_un | 0 | |
Nstage | ||
N0 | 238 | |
N1 | 3 | |
N2 | 0 | |
NX | 100 | |
N_un | 1 | |
Tstage | ||
T1 | 169 | |
T2 | 85 | |
T3 | 72 | |
T4 | 13 | |
T_un | 3 | |
PT (Pharmaceutical therapy) | ||
YES | 29 | |
TCGA-LIHC | ||
NO | 109 | |
UN | 204 | |
RT (Radiation therapy) | ||
YES | 9 | |
NO | 128 | |
UN | 205 |
TCGA-LIHC | ||
Survival | ||
OS | status_0 | 220 |
status_1 | 122 | |
Grade | ||
G1 | 53 | |
G2 | 162 | |
G3 | 110 | |
G4 | 12 | |
G_un | 5 | |
Age | ||
Age > 60 | 177 | |
Age ≤ 60 | 165 | |
Gender | ||
Female | 108 | |
Male | 234 | |
stage | ||
stage_Ⅰ | 162 | |
stage_Ⅱ | 78 | |
stage_Ⅲ | 75 | |
stage_Ⅳ | 3 | |
stage_un | 21 | |
Mstage | ||
M0 | 244 | |
M1 | 3 | |
MX | 95 | |
M_un | 0 | |
Nstage | ||
N0 | 238 | |
N1 | 3 | |
N2 | 0 | |
NX | 100 | |
N_un | 1 | |
Tstage | ||
T1 | 169 | |
T2 | 85 | |
T3 | 72 | |
T4 | 13 | |
T_un | 3 | |
PT (Pharmaceutical therapy) | ||
YES | 29 | |
TCGA-LIHC | ||
NO | 109 | |
UN | 204 | |
RT (Radiation therapy) | ||
YES | 9 | |
NO | 128 | |
UN | 205 |