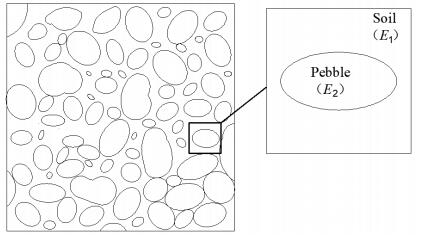
Figure 1.
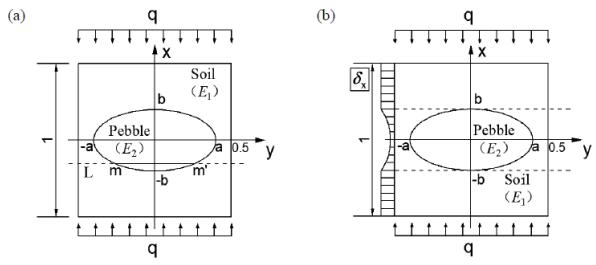
Section of sandy pebble soil and Representative Volume Element (RVE).
Citation: Nan Liu, Thomas G. Habetler. Design of a parallel-LC-compensated on-board charger for universal inductive charging in electric vehicles[J]. AIMS Energy, 2016, 4(5): 658-674. doi: 10.3934/energy.2016.5.658
| [1] | Xiaochen Mao, Weijie Ding, Xiangyu Zhou, Song Wang, Xingyong Li . Complexity in time-delay networks of multiple interacting neural groups. Electronic Research Archive, 2021, 29(5): 2973-2985. doi: 10.3934/era.2021022 |
| [2] | Weijie Ding, Xiaochen Mao, Lei Qiao, Mingjie Guan, Minqiang Shao . Delay-induced instability and oscillations in a multiplex neural system with Fitzhugh-Nagumo networks. Electronic Research Archive, 2022, 30(3): 1075-1086. doi: 10.3934/era.2022057 |
| [3] | Jianmin Hou, Quansheng Liu, Hongwei Yang, Lixin Wang, Yuanhong Bi . Stability and bifurcation analyses of p53 gene regulatory network with time delay. Electronic Research Archive, 2022, 30(3): 850-873. doi: 10.3934/era.2022045 |
| [4] | Fang Yan, Changyong Dai, Haihong Liu . Oscillatory dynamics of p53 pathway in etoposide sensitive and resistant cell lines. Electronic Research Archive, 2022, 30(6): 2075-2108. doi: 10.3934/era.2022105 |
| [5] | Rui Ma, Xin-You Meng . Dynamics of an eco-epidemiological model with toxicity, treatment, time-varying incubation. Electronic Research Archive, 2025, 33(5): 3074-3110. doi: 10.3934/era.2025135 |
| [6] | Xin Du, Quansheng Liu, Yuanhong Bi . Bifurcation analysis of a two–dimensional p53 gene regulatory network without and with time delay. Electronic Research Archive, 2024, 32(1): 293-316. doi: 10.3934/era.2024014 |
| [7] | Shuang Liu, Tianwei Xu, Qingyun Wang . Effect analysis of pinning and impulsive selection for finite-time synchronization of delayed complex-valued neural networks. Electronic Research Archive, 2025, 33(3): 1792-1811. doi: 10.3934/era.2025081 |
| [8] | Xudong Hai, Chengxu Chen, Qingyun Wang, Xiaowei Ding, Zhaoying Ye, Yongguang Yu . Effect of time-varying delays' dynamic characteristics on the stability of Hopfield neural networks. Electronic Research Archive, 2025, 33(3): 1207-1230. doi: 10.3934/era.2025054 |
| [9] | Xiaochun Gu, Fang Han, Zhijie Wang, Kaleem Kashif, Wenlian Lu . Enhancement of gamma oscillations in E/I neural networks by increase of difference between external inputs. Electronic Research Archive, 2021, 29(5): 3227-3241. doi: 10.3934/era.2021035 |
| [10] | Yan Chen, Ravie Chandren Muniyandi, Shahnorbanun Sahran, Zuowei Cai . Fixed-time synchronization of time-delayed fuzzy memristor-based neural networks: A special exponential function method. Electronic Research Archive, 2025, 33(6): 3517-3542. doi: 10.3934/era.2025156 |
Sandy pebble soils are mainly composed of pebbles, gravels, sand and clayey soil. Different from clays, rocks or other homogeneous solid materials, the structure of sandy pebble soil is discrete and the mechanical properties are rather complex. Sandy pebble soils distribute unevenly in the underground stratum. The permeability of sandy pebble soil is high and the self-stability is poor. Most pebbles are ellipsoidal shaped because of the long-term scouring of groundwater. The strength of a single pebble is high, so pebble soils can withstand a high compressive stress. On the contrary, pebble soil has very low resistance to tensile stress because its internal cohesive force is almost zero. Shear failure is the most common failure mode for sandy pebble soil [1].
The structure of sandy pebble soil is loose and easy to be disturbed, shield construction in this kind of soil layer may cause land subsidence and collapse easily [1]. For all engineering accidents, the most typical one is lagged settlement. During shield excavation, if the thrust of shield cutter-head is too large, it may cause the uplift of the ground. On the contrary, if the thrust is insufficient, it is easy to cause excessive excavation and form a soil cavity. With the movement of soil cavity to the ground, the lagged settlement will appear. In shield construction, deformation modulus plays an important role in correctly judging the stress and deformation of soil. Constitutive model of sandy pebble soil is significant for underground engineering, especially for shield construction.
Deformation modulus is a basic mechanical property of sandy pebble soil. Currently, plenty of efforts have been devoted to modelling the equivalent elastic modulus of multiphase materials. For laminar composite, the basic theory includes "Reuss model" and "Voigt model" [2], but the application scope of these models is small because of the strict application conditions. For irregular inclusions, Eshelby [3,4] proposed the earliest theory for elliptical inhomogeneity subjected to uniform pressure, which is often named equivalent inclusion method (EIM). With EIM method, displacements, strains, stresses inside or outside pebbles can be described by a unique expression of Eshelby tensor equation. Based on this theory, Jin et al. [5,6] derived a novel expression of Eshelby tensor, which has been applied to solve the problem of stress concentration around elliptical inclusion. However, from a statistical point of view, the local inhomogeneity has little influence on the equivalent properties of pebble soil, so the derivation of specific formulas for stress or strain field around pebbles can be avoided [7]. With regard to the study of sandy pebble soil, Hu Min [8] proposed a constitutive model based on Eshelby tensors and Mori-Tanaka equivalent method. Ma and Gao [9] studied the influence of pebble distribution on equivalent elastic modulus of representative volume element (RVE) through finite element experiments. However, these models are suitable only for small deformation condition. Besides, the accuracy will drop when the pebble content is more than 50%. At all events, analysis of locally elastic constitutive phases requires a much higher computation cost compared with homogeneous structures, especially for random inclusion composites [10,11].
This paper focus on the equivalent modulus of pebble soil, which is related to the stability of pebble soil stratum and mechanical control of shield excavation. In this paper, RVE (Representative Volume Element) is selected as the research object, and the pebble is simplified as an elliptical particle. Based on the assumption of stress or strain uniformity, the analytical formulas for equivalent deformation modulus of pebble soil are derived. Through finite element method (FEM) analysis, the accuracy of equivalent modulus is confirmed by simulation of their elastic behavior under predefined load.
In past decades, a substantial number of theoretical models for effective physical properties have been proposed. Some of them have been intended for highly specific applications, while others provide important theoretical guiding role [12]. Of them, the Series model and Parallel model are the simplest for two-phase systems. As the basic models, they are often used as benchmarks for validation of new models. They offer upper and lower boundaries for many properties of two-phase heterogonous materials, as proven by Wiener for effective conductivity [13]. In the field of thermodynamics, the Parallel model also serves as the first order approximation to the calculation of the coefficient of thermal expansion [14]. In the case of elastic modulus, the two models are often called Reuss model and Voigt model, respectively [2,15,16]. Here, we will make a brief discussion on the two models. It will be helpful for understanding the basic assumption of these theories, and the adapted models applied for sandy pebble soil.
Series model is also named Reuss model [17], which is based on the hypothesis of stress uniformity. The basic assumption of this model is that the distribution of two materials is horizontally stacked and the external force is perpendicular to the surface. In this condition, stresses in two materials are uniformly distributed. If
| 1E=1E1(1−ω)+1E2ω | (1) |
where E1 and E2 are elastic modulus of soil and pebble, respectively.
Reuss model is derived from the assumption of uniform stress under ideal layer. This model is suitable for the equivalent elastic modulus calculation of horizontal layered structures such as multi-layer soils and asphalt road structures. Reuss model is the essential base of stress uniformity model of pebble soil that will be discussed in section 3.1.
Parallel model is also named Voigt model [17], which is based on the hypothesis of strain uniformity. The basic assumption is that the two materials are in a juxtaposition delamination, the strains in two materials are the same under a vertical load (to be exact, it is a displacement load). If
| E=E1(1−ω)+E2ω | (2) |
Different from Reuss model, the layer direction of Voigt model is parallel to the force direction, and the strains are uniform in different materials under external load. Similar to Ruess model, the parallel model is also applied for particular cases, such as reinforced composite foundations and composite tensile members. This model is the essential base of strain uniformity model that will be discussed in section 3.2.
Both Reuss model and Voigt model are based on the assumption of ideal stratified conditions. They are only suitable for composite materials with ideal layers. We can see, if
With regard to sandy pebble soil, the distribution of different components might be complex, but in some cases, the assumption and derivation process are similar to these basic models. Based on the two theories, constitutive model for pebble soil will be discussed below.
Sandy pebble soil is a special composite material, or we can call it two-phase inclusive material. Pebbles are irregular inclusions, so the basic model in section 2 cannot describe sandy pebble soil accurately. Besides, with the increasing of pebble content, the mechanical properties will change greatly. However, under natural conditions most pebbles are ellipse shaped, which makes it possible to derive the equivalent formula through mathematical analysis.
For sandy pebble soil, the local stress or strain is not uniform since stress concentration exists on the interfacial surface between stone and soil. However, from a statistical point of view, the forces each pebble shared are related to their volumes. Within a specific area, if the loading area is large enough, the stress or strain can be considered as uniform. Figure 1 presents a typical section of sandy pebble soil. To investigate the equivalent constitutive model of pebble soil, a Representative Volume Element(RVE)is selected from the section. In theoretical derivation, the mechanical properties of RVE could be considered the same as that of the main body [18,21]. Two kinds of theoretical derivations will be discussed in section 3.1 and 3.2, respectively.
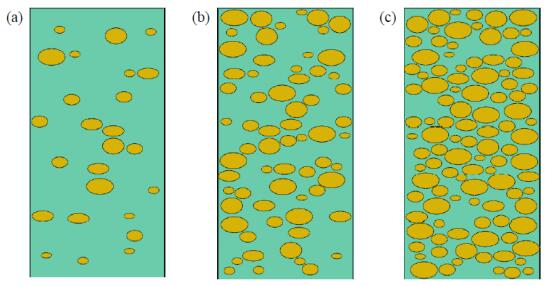
As shown in Figure 2a, the volume content of pebbles is very small (usually less than 20%). Under this condition, if the pebbles are randomly distributed, they will be surrounded by soil and keep separated from each other. When a vertical pressure is applied to the surface, the stress distribution will be like Figure 2b. As we can see, there is a distinct stress transfer path along the vertical distribution of pebbles. Considering the local stress distribution in two directions, stress difference between soil and pebbles might exist in the x-axis direction. However, along the stress transfer path, the values of stress vary in a small range, especially in the upper and lower regions of each pebble. In Figure 2b we use "sub-uniform" to describe the state of "nearly uniform". Take the area indicated by arrow as an example, in red area, the average stress is about 1.017MPa, for the orange area, the average stress is about 0.9375MPa. The error is
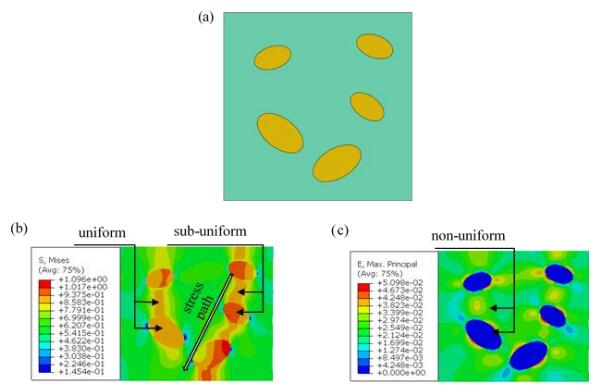
Figure 2c shows the strain distribution of sandy pebble soil. This is another condition that will be discussed in section 3.2. As we can see, due to the difference of compression modulus, the strains in soil and pebbles are quite different. The strains in soil are approximately (1.7−3.0) × 10-2, whereas in pebbles is 0.
Similar to the Reuss model in section 2.1, the basic assumption of stress uniformity model is the distribution of stress in local area, i.e. in RVE is homogeneous, which means the stress in pebble is the same as the stress in soil [18,19,20]. This assumption is applicable only if pebble content is much smaller than soil. In this condition, stress will transfer through soil matrix and the stress state of pebble is the same as surrounding soil.
To derive the equivalent deformation modulus of this model, a simplified schematic diagram is presented in Figure 3a. In this model, RVE is represented by a square and the side length is 1, pebble is simplified by an ellipse, the major and minor axis of pebble are
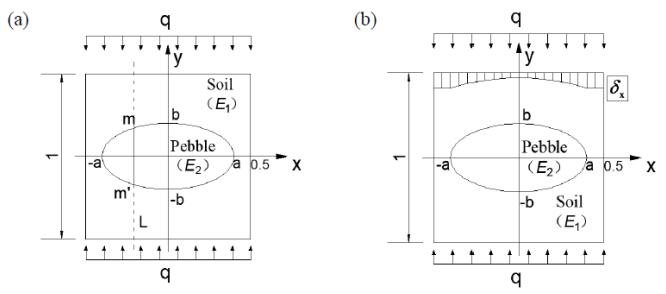
For each section of this RVE, the length of mm' is:
| lmm′=lx=2b√1−x2a2 | (3) |
Under action of external pressure
| ε1=qE1 | (4) |
| ε2=qE2 | (5) |
The deformation of section L can be divided into 2 parts, one is the deformation in soil:
| δ1=qE1(1−lmm′) | (6) |
Another is the deformation in pebble:
| δ2=qE2lmm′ | (7) |
The whole deformation of section L is:
| δ=δ1+δ2=qE1(1−lmm′)+qE2lmm′ | (8) |
For different sections, the line deformation is:
| δx=δ1+δ2=qE1(1−lx)+qE2lx=qE1+qlx(E1−E2)E1E2 | (9) |
For RVE, the whole deformation is:
| δ=∫0.5−0.5δxdx=∫0.5−0.5[qE1+qlx(E1−E2)E1E2]dx | (10) |
The integral formula in (10) could be divided into 3 parts, for
| δ=∫−a−0.5qE1dx+∫a−a[qE1+qlx(E1−E2)E1E2]dx+∫0.5aqE1dx | (11) |
Substituting equation 3 back into equation 11 then result:
| δ=qE2+qabπ(E1−E2)E1E2 | (12) |
Finally, the equivalent elastic modulus of stress uniformity model is:
| E=σε=qδ/1=E1E2E2+πab(E1−E2) | (13) |
Under special conditions, if the pebble is simplified as a circle, formula (13) will become:
| E=E1E2E2+πr2(E1−E2) | (14) |
Based on two basic theory in section 2, we can make a simple validation of formula (13) and (14): the total area of RVE is 1, and
We can make a further discussion on formula (13) and (14). As mentioned before,
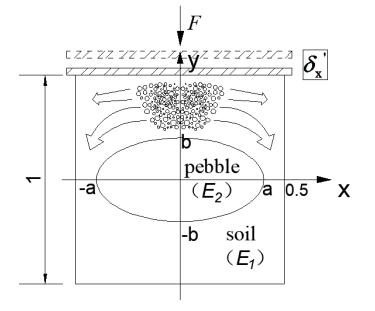
In practice, the deformation of sandy pebble soil is usually caused by building's foundation, which is a rigid displacement load. Because of high compressibility, soil will be pushed into gaps between pebbles. As shown in Figure 4, with the uniform deformation from a compression surface, soil near the short axis of the pebble has a tendency to move downward and to the edges of both sides because of plastic deformation. This phenomenon can also be observed through ABAQUS model. In practice, the deformation response of soil is related to the rheological properties of soil matrix as well as the geometry of the contact surface between soil and pebbles [22].
Strain uniformity model is another condition. As shown in Figure 5a, when the soil contains more pebbles (usually more than 60% in volume), all pebbles will contact each other. In this condition, soil matrix only acts as a filler to fill up the gaps between pebbles. As a result, the external force will be mainly borne by the pebble skeleton.
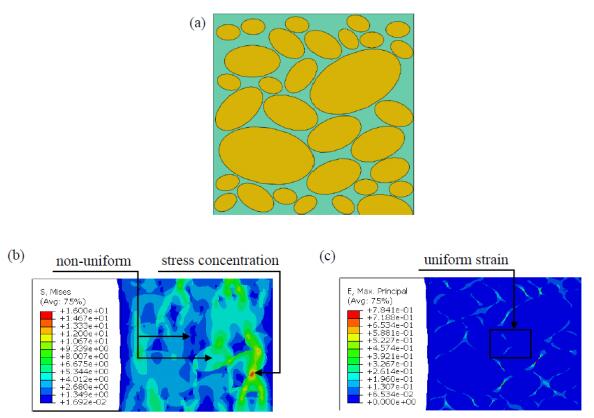
The stress distribution in FEM model is shown in Figure 5b. As we can see, the distribution is quite irregular. Stresses differ not only between soil and pebbles, but also in different position of individual pebbles and soil matrix. Moreover, for some areas where pebbles contact, obvious stress concentrations can also be seen. Concerning the strain distribution (Figure 5c), however, the strain distribution tends to be quite uniform for different position of individual pebbles (or soil matrix). In fact, with the increasing pebble content, more pebbles interlock together forming a whole structure and this entirety bears most of external force. As a result, the stress in soil matrix will be much smaller than that of pebbles, whereas strains in soil and pebbles tend to be uniform or sub-uniform. This prompts us that strain uniformity model will be more accurate in analyzing the equivalent deformation modulus of pebble soil in this condition.
Similar to Voigt model in section 2.2, the basic assumption of strain uniformity model is that the strains in soil matrix and pebbles are homogeneous, or that the strains in the direction of external force in two phases are the same. Under strain uniformity condition, the stresses at different areas depend on the elastic modulus of local material. A RVE is also selected for derivation, in order to simplify the deduction process and make the final formula consistent with stress uniformity equation, we set the vertical direction as x axis, as shown in Figure 6a. Similarly, in theoretical derivation there should be no relative movement on the interface between two phases.
In Figure 6a, we also create a section of
| lmm′=lx=2a√1−x2b2 | (15) |
Assuming that under the action of external pressure
| F=q×1=E1ε(1−lmm′)+E2εlmm′=ε[E1+(E2−E1)lmm′] | (16) |
That is
| q=ε[E1+(E2−E1)lmm′] | (17) |
namely
| ε=qE1+(E2−E1)lmm′ | (18) |
Assuming the length of
For RVE, the whole deformation is:
| δ=∫0.5−0.5εxdx=∫0.5−0.5qE1+(E2−E1)lxdx | (19) |
Elastic modulus within a range of small deformation is:
| E=σε=q/1δ/1=qδ | (20) |
That is:
| 1E=δq | (21) |
Substituting Equation 19 back into Equation 21 then results:
| 1E=∫0.5−0.51E1+(E2−E1)lxdx | (22) |
The integral formula in (22) could be divided into 3 parts, for
| ∫0.5−0.5εxdx=∫−a−0.51E1dx+∫a−a1E1+(E2−E1)lxdx+∫0.5a1E1dx | (23) |
Finally, the equivalent elastic modulus of strain uniformity model is:
| 1E=am[π−2E1ln(m+√m2−E21E1)√m2−E21]+1−2aE1 | (24) |
| m=2b(E2−E1) | (25) |
Under special conditions, if the pebble is simplified as a circle, formula (24) will become:
| 1E=rm[π−2E1ln(m+√m2−E12E1)√m2−E12]+1−2rE1 | (26) |
| m=2r(E2−E1) | (27) |
Formulas (24) and (26) are equivalent modulus of sandy pebble soil based on strain uniformity, and they represent elliptical pebbles and round pebbles respectively. Similar conclusion can be found in reference [9].
Here we will make a further discussion on the deformation behavior of RVE with strain uniformity model. In fact, with strain uniformity assumption, the deformation characteristic is like Figure 6b. The strain on each section depends on the ratio of pebble on that section. For example, on the y axis section (transverse axis section), the strain is smallest because the line ratio of pebble is the length of its major axis. On the contrary, for the range of (b < −0.5) and (b > 0.5), the strain reaches its maximum value because the line ratio of pebble is 0. This could also be explained in mathematical way:
In equation 18, for
| εx=qE1+(E2−E1)lx | (28) |
which means the strain at different position is a function of
Strain uniformity model is effective only if the content of pebble is large (usually more than 60% in volume) because of the different compressibility. As we know, the pebbles can be regard as rigid body, whereas soil is much softer. If the content of pebble is too small, the pebbles will be suspended in the soil and the strains will be not uniform anymore.
In practice, the composition of pebble soil is rather complex and the distribution of pebbles is uneven. It is difficult to obtain ideal soil samples with constant quality. Besides, sandy pebble soil is easily to be disturbed during sample collection. It is difficult to test the deformation modulus through laboratory experiment or in-situ test. The Finite Element Method (FEM) provides an effective way to solve this problem, with FEM program we can set the model size and boundary conditions according to the testing program, and ideal numerical models can be obtained through parameter setting. In addition, FEM test has a good repeatability and it can be used as a supplement to geotechnical test under special circumstances. In this part, a series of FEM models are established and the accuracy of the theoretical models will be verified.
In this study, the ABAQUS was applied to determine the mechanical properties of sandy pebble soil. Before establishing FEM models, the size range and distribution of pebbles should be determined. According to the statistical results [9], the long axis of pebbles are usually smaller than 10cm, the number of pebbles with different size are in normal distribution. Considering the size effect, many researches [23,25] recommended that pebbles smaller than 5 mm could be seen as equal to soil matrix. Consequently, the size range of pebbles was set to 0.5−10 cm. To be consistent with theoretical derivation, the major axes orientations were horizontally placed, and the positions of pebbles were set randomly similar to the distribution in practice. The mechanical parameters of pebble and soil matrix are shown in Table 1. For the scale of FEM model, Holtz [24] suggested that, the width of specimens should be 10 times the diameter of largest pebble. So, the size of FEM model was set as 50 cm × 100 cm. To make the simulation process correspond with triaxial compression experiment in practice, the bottom of FEM models was set as fixed constraint, whereas both sides were set as free boundaries. Moreover, to be consistent with the condition of RVEs in theoretical deduction, the relative sliding between pebbles and soil was neglected.
| Materials | Modulus of elasticity/MPa | Poisson's ratio |
| Soil matrix | 9.25 | 0.35 |
| Pebble | 50000.00 | 0.15 |
 DownLoad:
CSV
DownLoad:
CSV
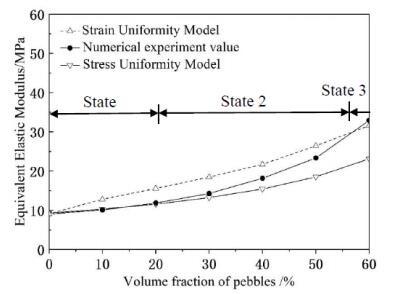
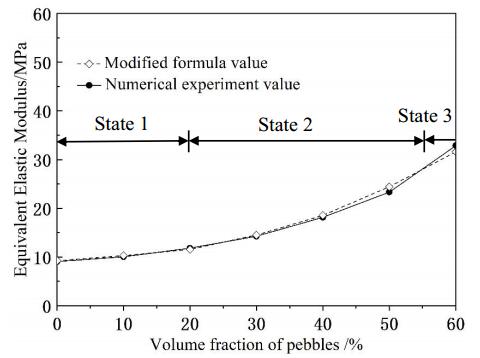
Figure 7 presents the FEM models with different pebble content established through ABAQUS. As a function of pebble content, the numerical testing results (marked with black solid lines) and theoretical calculation results are shown in Figure 8. Results show that when the content of pebbles is lower than 25%, formula of "Stress Uniformity Model" matches numerical experiment results well. On the contrary, when the content of pebble is more than 55%, the formula of "Strain Uniformity Model" matches numerical experiment results better. The mechanism can be explained by the basic assumption of two models. For state 1 in Figure 8, the state of pebbles corresponds to the stress uniformity assumption, whereas state 3 accords with the assumption of strain uniformity. In addition, it is not difficult to find that the values of stress uniformity are always lower than that of strain uniformity model. When pebble content is 0, three curves intersect at one point. It proved that two theories are correspond with Ruess model and Voigt model in section 2.
In FEM simulation, we just investigated the volume range of 0−60%. This is because, with the increasing pebble content the soil space will be smaller and smaller, leading to difficulties to generate more pebbles, this condition becomes more serious when pebble content is more than 60%. From another point of view, for pebble content more than 60%, the soil will become inclusions embedded in pebbles and the structure will be no longer pebble soil in concept.
A transition state between stress uniformity and strain uniformity was concerned in this investigation. Generally, when the content of pebbles reaches 20%, they begin to touch each other. Subsequently, with the increasing content of pebbles, they will overlap and form a skeleton structure at local areas, which leads to the coexistence of uniform stress area and uniform strain area, as shown in Figure 9a. This contact effect and heterogeneous distribution affect not only the distribution of local stress and strain field, but also the macro mechanical properties of pebble soil. FEM test also shows that this phenomenon has a great effect on the numerical simulation results. For specimens with similar pebble content, the equivalent deformation modulus will be higher if it has more contact ratio.
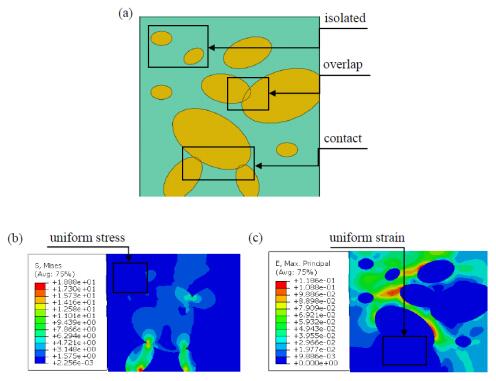
Figure 9b and c show the coexistence of stress uniformity and strain uniformity. For pebble isolated in soil matrix, the stress tends to be quite uniform. However, for contact area, strain seems to be more uniform. Many theories have been proposed to describe the influence of contact [26,27]. Some researchers [29,30] suggested that the stress distribution can be ignored in equivalent simulation from a macro perspective. According to reference [28], for equivalent description of mechanical property, the contact effect in large scale object could be considered as a function of contact area or pebble content. In this research, we focus on simulating the macroscopic properties of pebble soils, so the local stress calculation could be avoided, and the superposition effect of local areas could be simulated through equivalent analysis. FEM simulation results show that the ratio of contact area is proportional to the volume fraction of pebbles. Based on this relationship, we proposed an adapted formula to describe pebble soil under transition state:
| E=Estress+(Estrain−Estress)(ω−0.2)0.4(20%<ω<60%) | (29) |
Where
For pebble content less than 20%, equation 13 is still effective, i.e.:
| E=Estress=E1E2E2+πab(E1−E2)(ω⩽20%) | (30) |
Figure 10 illustrates the numerical experiment value and adapted theoretical value. As we can see, the modified formula matches simulation results well.
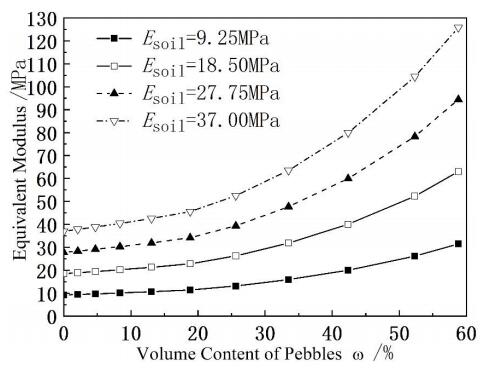
According to the parameters provided in reference [9], if the elastic modulus of pebble is 50000.00 MPa and soil matrix is Esoil, the equivalent modulus of different pebble soils can be obtained through theoretical calculation. Figure 11 shows the variation of pebble soils with different soil matrix and pebble content. The starting point of each curve is the soil matrix with no pebbles, and the ordinate value is the elastic modulus of corresponding soil matrix. Results show that the mechanical properties of soil matrix have a great influence on the equivalent modulus of sandy pebble soil. With the increase of pebble volume fraction, the equivalent elastic modulus increases exponentially.
Pebble soil is a typical heterogeneous material with special physical and mechanical properties. The discrete characteristic of pebble soil seriously endangered shield construction and stability of underground stratum. Constitutive model plays an important role in modeling the mechanical properties of sandy pebble soil. This paper made an in-depth analysis on the basic assumption of Ruess model and Voigt model. Based on the two basic models, the equivalent deformation modulus of pebble soil is investigated through mathematical derivation.
According to the stress or strain status of pebble soil, three conditions were suggested in this paper, and the theoretical formulas are deduced. For pebble content lower than 20%, pebbles will be surrounded by soil and the soil state could be described by "Stress Uniformity Model". When pebble content is more than 60%, pebbles overlap to form a skeleton, which protects the soil from external forces. In this case "Strain Uniformity Model" will be more effective. When the content is 20%−60%, the pebble soil is a transition state from "Stress Uniformity" to "Strain Uniformity". According to the touching effect, a modified formula is proposed based on the relationship between contact ratio and pebble content.
Considering the difficulties in geotechnical experiment, the finite element program ABAQUS was applied to establish numerical tests and verify the theoretical formulas. Results show that, theoretical values matched numerical simulation well. For different soil matrix, a graphic illustration of equivalent modulus of pebble soil was suggested, which is helpful in practice especially for thrust and land deformation control in shield construction. It is worth mentioning that, for specific soil matrix, the equivalent deformation modulus increases exponentially with increasing pebble content. Theories can be applied in predicting the equivalent deformation modulus of pebble soil.
Considering the insufficiency in this paper, the following aspects need more research. Firstly, in order to be consistent with the theoretical deduction, pebbles and soil matrix in FEM models are merged together, i.e. there is no relative movement between them. However, in practice relative displacement is inevitable because of the different compressibility and interface slip. Secondly, in theoretical derivation and FEM experiments, the direction of pebbles' main axis is horizontal. In practice, the main axis is variable, simulation of authentic pebble soil under nature condition is still needed. The mechanical properties and whether the formulas still effective also need more research. Last but not least, the transition state is very complex, in adapted formula the influence of local clusters was not considered enough, more efforts are still needed to investigate the status of pebble soil with different pebble content.
This work has been supported by the 'Innovation Fund for Excellent Doctoral Dissertations' of South China University of Technology, the authors gratefully acknowledge this funding support. Besides, the authors would like to express their sincere thanks to three anonymous referees for their valuable comments and suggestions.
All authors declare no conflict of interest in this paper.
| [1] | Liu N, Habetler TG (2015) Design of a Universal Inductive Charger for Multiple Electric Vehicle Models. IEEE T Power Electr 30: 6378-6390. |
| [2] | Liu N, Habetler TG, A study of designing a universal inductive charger for Electric Vehicles. Industrial Electronics Society, IECON 2013-39th Annual Conference of the IEEE. IEEE, 2013: 4528-4533. |
| [3] |
Yilmaz M, Krein PT (2013) Review of Battery Charger Topologies, Charging Power Levels, and Infrastructure for Plug-In Electric and Hybrid Vehicles. IEEE T Power Electr 28: 2151-2169. doi: 10.1109/TPEL.2012.2212917

|
| [4] |
Capasso C, Veneri O (2015) Experimental study of a DC charging station for full electric and plug in hybrid vehicles. Appl Energ 152: 131-142. doi: 10.1016/j.apenergy.2015.04.040
|
| [5] |
Zaheer A, Hao H, Covic GA, et al. (2015) Investigation of Multiple Decoupled Coil Primary Pad Topologies in Lumped IPT Systems for Interoperable Electric Vehicle Charging. IEEE T Power Electr 30: 1937-1955. doi: 10.1109/TPEL.2014.2329693
|
| [6] | Veneri O, Ferraro L, Capasso C, et al., Charging infrastructures for EV: Overview of technologies and issues. Electrical Systems for Aircraft, Railway and Ship Propulsion (ESARS), 2012. IEEE, 2012: 1-6. |
| [7] | Pantic Z, Lee K, Lukic S, Inductive power transfer by means of multiple frequencies in the magnetic link. 2013 IEEE Energy Conversion Congress and Exposition. IEEE, 2013: 2912-2919. |
| [8] | Liu N, Habetler TG, Design of an on-board charger for universal inductive charging in electric vehicles. 2015 IEEE Energy Conversion Congress and Exposition (ECCE). IEEE, 2015: 4544-4549. |
| [9] | Keeling NA, Covic GA, Boys JT (2010) A Unity-Power-Factor IPT Pickup for High-Power Applications. IEEE T Ind Electron 57: 744-751. |
| [10] |
Pantic Z, Lukic SM (2012) Framework and Topology for Active Tuning of Parallel Compensated Receivers in Power Transfer Systems. IEEE T Power Electr 27: 4503-4513. doi: 10.1109/TPEL.2012.2196055
|
| [11] | Rui C, Cong Z, Zahid ZU, et al., Analysis and parameters optimization of a contactless IPT system for EV charger. 2014 IEEE Applied Power Electronics Conference and Exposition-APEC 2014. IEEE, 2014: 1654-1661. |
| [12] | Deng J, LU F, Li W, et al., ZVS double-side LCC compensated resonant inverter with magnetic integration for electric vehicle wireless charger. 2015 IEEE Applied Power Electronics Conference and Exposition (APEC). IEEE, 2015: 1131-1136. |
| [13] | Liu N, Habetler TG, Design of a universal inductive charger for electric vehicles. Transportation Electrification Conference and Expo (ITEC), 2014 IEEE. IEEE, 2014: 1-6. |
| [14] |
Pantic Z, Sanzhong B, Lukic S (2011) ZCS LCC-Compensated Resonant Inverter for Inductive-Power-Transfer Application. IEEE T Ind Electron 58: 3500-3510. doi: 10.1109/TIE.2010.2081954
|
| [15] | Si P, Hu AP, Malpas S, et al., Switching Frequency Analysis of Dynamically Detuned ICPT Power Pick-ups. 2006 International Conference on Power System Technology. IEEE, 2006: 1-8. |
| [16] |
Choi WY, Yang MK, Cho HS (2014) High-Frequency-Link Soft-Switching PWM DC-DC Converter for EV On-Board Battery Chargers. IEEE T Power Electr 29: 4136-4145. doi: 10.1109/TPEL.2013.2288364
|
| [17] |
Deng J, Li S, Hu S, et al. (2014) Design Methodology of LLC Resonant Converters for Electric Vehicle Battery Chargers. IEEE T Veh Technol 63: 1581-1592. doi: 10.1109/TVT.2013.2287379
|
| [18] |
Pahlevaninezhad M, Drobnik J, Jain PK, et al. (2012) A Load Adaptive Control Approach for a Zero-Voltage-Switching DC/DC Converter Used for Electric Vehicles. IEEE T Ind Electron 59: 920-933. doi: 10.1109/TIE.2011.2161063
|
| [19] |
Budhia M, Boys JT, Covic GA, et al. (2013) Development of a Single-Sided Flux Magnetic Coupler for Electric Vehicle IPT Charging Systems. IEEE T Ind Electron 60: 318-328. doi: 10.1109/TIE.2011.2179274
|
| [20] |
Bosshard R, Kolar JW, Muhlethaler J, et al. (2015) Modeling and η-α-Pareto Optimization of Inductive Power Transfer Coils for Electric Vehicles. Emerging and Selected Topics in Power Electronics, IEEE Journal of 3: 50-64. doi: 10.1109/JESTPE.2014.2311302
|
| [21] | Zaheer A, Kacprzak D, Covic GA, A bipolar receiver pad in a lumped IPT system for electric vehicle charging applications. 2012 IEEE Energy Conversion Congress and Exposition (ECCE). IEEE, 2012: 283-290. |
| [22] |
Cheng KWE, Divakar BP, Wu H, et al. (2011) Battery-Management System (BMS) and SOC Development for Electrical Vehicles. IEEE T Veh Technol 60: 76-88. doi: 10.1109/TVT.2010.2089647
|
| [23] | Veneri O, Capasso C, Ferraro L, et al., Performance analysis on a power architecture for EV ultra-fast charging stations. Clean Electrical Power (ICCEP), 2013 International Conference on. IEEE, 2013: 183-188. |
| [24] |
Li S, Bao K, Fu X, et al. (2014) Energy Management and Control of Electric Vehicle Charging Stations. Electr Pow Compo Sys 42: 339-347. doi: 10.1080/15325008.2013.837120
|
| [25] | Park SY, Miwa H, Clark BT, et al., A universal battery charging algorithm for Ni-Cd, Ni-MH, SLA, and Li-Ion for wide range voltage in portable applications. 2008 IEEE Power Electronics Specialists Conference. IEEE, 2008: 4689-4694. |
| [26] | Hõimoja H, Rufer A, Dziechciaruk G, et al., An ultrafast EV charging station demonstrator. Power Electronics, Electrical Drives, Automation and Motion (SPEEDAM), 2012 International Symposium on. IEEE, 2012: 1390-1395. |
| [27] | Vehicle Technologies Program EERE ( 2011) 2011 Nissan Leaf - VIN 0356, Advanced Vehicle Testing - Baseline Testing Results. U.S. Department of Energy. |
| [28] |
Mishima T, Akamatsu K, Nakaoka M (2013) A High Frequency-Link Secondary-Side Phase-Shifted Full-Range Soft-Switching PWM DC-DC Converter With ZCS Active Rectifier for EV Battery Chargers. IEEE T Power Electr 28: 5758-5773. doi: 10.1109/TPEL.2013.2258040
|
| [29] |
Aguilar C, Canales F, Arau J, et al. (1997) An integrated battery charger/discharger with power-factor correction. IEEE T Ind Electron 44: 597-603. doi: 10.1109/41.633453
|
| [30] | Du Y, Lukic S, Jacobson B, et al., Review of high power isolated bi-directional DC-DC converters for PHEV/EV DC charging infrastructure. 2011 IEEE Energy Conversion Congress and Exposition. IEEE, 2011: 553-560. |
| 1. | Hyun-Seok Yun, Seong-Woo Moon, Yong-Seok Seo, Effects of breccia and water contents on the mechanical properties of fault-core-zone materials, 2022, 12, 2045-2322, 10.1038/s41598-022-10995-2 | |
| 2. | Pengfei Li, Xiaopu Cui, Yingjie Wei, Junwei Xia, Xinyu Wang, Calibration method of mesoscopic parameter in sandy cobble soil triaxial test based on PFC3D, 2024, 2095-2430, 10.1007/s11709-023-0028-4 | |
| 3. | Fabio Sanchez, Jorge Arroyo-Esquivel, Juan G. Calvo, A mathematical model with nonlinear relapse: conditions for a forward-backward bifurcation, 2023, 17, 1751-3758, 10.1080/17513758.2023.2192238 | |
| 4. | Jianqiang Gao, Wenrui Du, Ao Cheng, Cunzhen Zhang, Numerical study on cutting mechanism of TBM cutter in sandy pebble stratum considering the influence of calcareous cement layer, 2025, 1964-8189, 1, 10.1080/19648189.2025.2477066 |

Nan Liu, Thomas G. Habetler. Design of a parallel-LC-compensated on-board charger for universal inductive charging in electric vehicles[J]. AIMS Energy, 2016, 4(5): 658-674. doi: 10.3934/energy.2016.5.658

| Materials | Modulus of elasticity/MPa | Poisson's ratio |
| Soil matrix | 9.25 | 0.35 |
| Pebble | 50000.00 | 0.15 |
DownLoad:
CSV