Citation: Solveig Glomsrød, Taoyuan Wei. The effects of energy efficiency improvement in China with global interaction[J]. AIMS Energy, 2016, 4(1): 37-51. doi: 10.3934/energy.2016.1.37
| [1] | Arief Heru Kuncoro, Afri Dwijatmiko, Noer’aida, Vetri Nurliyanti, Agus Sugiyono, Widhiatmaka, Andri Subandriya, Nurry Widya Hesty, Cuk Supriyadi Ali Nandar, Irhan Febijanto, La Ode Muhammad Abdul Wahid, Paul Butarbutar . Mapping the landscape of carbon trading & carbon offset research: A global and Indonesian perspective. AIMS Energy, 2025, 13(1): 86-124. doi: 10.3934/energy.2025004 |
| [2] | Panagiotis Fragkos . Analysing the systemic implications of energy efficiency and circular economy strategies in the decarbonisation context. AIMS Energy, 2022, 10(2): 191-218. doi: 10.3934/energy.2022011 |
| [3] | David Schwartzman, Peter Schwartzman . Scenarios for combating global warming: China's critical role as a leader in the energy transition. AIMS Energy, 2024, 12(4): 809-821. doi: 10.3934/energy.2024038 |
| [4] | Peter Schwartzman, David Schwartzman . Can the 1.5 ℃ warming target be met in a global transition to 100% renewable energy?. AIMS Energy, 2021, 9(6): 1170-1191. doi: 10.3934/energy.2021054 |
| [5] | Hamza El Hafdaoui, Ahmed Khallaayoun, Kamar Ouazzani . Activity and efficiency of the building sector in Morocco: A review of status and measures in Ifrane. AIMS Energy, 2023, 11(3): 454-485. doi: 10.3934/energy.2023024 |
| [6] | Daniel Tutu Benefoh, Emmanuel Kofi Ackom . Energy and low carbon development efforts in Ghana: institutional arrangements, initiatives, challenges and the way forward. AIMS Energy, 2016, 4(3): 481-503. doi: 10.3934/energy.2016.3.481 |
| [7] | Patrick Moriarty, Damon Honnery . Energy policy and economics under climate change. AIMS Energy, 2018, 6(2): 272-290. doi: 10.3934/energy.2018.2.272 |
| [8] | Takako Wakiyama, Eric Zusman . What would be the effects of a carbon tax in Japan: an historic analysis of subsidies and fuel pricing on the iron & steel, chemical, and machinery industries. AIMS Energy, 2016, 4(4): 606-632. doi: 10.3934/energy.2016.4.606 |
| [9] | Patrick Moriarty . Global nuclear energy: an uncertain future. AIMS Energy, 2021, 9(5): 1027-1042. doi: 10.3934/energy.2021047 |
| [10] | Surender Reddy Salkuti . Sustainable energy technologies for emerging renewable energy and electric vehicles. AIMS Energy, 2024, 12(6): 1264-1270. doi: 10.3934/energy.2024057 |
In the wake of the twenty-first session of the Conference of the Parties (COP 21) in Paris in 2015, China has pledged to reduce its carbon intensity defined as carbon dioxide (CO2) emissions per unit of gross domestic product (GDP) by 60-65% by 2030 compared to the 2005 level. Earlier in COP15 in Copenhagen in 2009, China pledged to reduce its carbon intensity by 40-45% by 2020 compared to the 2005 level. To achieve the targets on carbon intensity, energy efficiency improvement, among other measures, is recommended to be implemented with high priority [1,2,3,4].
This recommendation follows the conventional wisdom that efficient use of energy would result in net reduction in energy consumption. In general, however, a one percent energy efficiency improvement will lead to less than one percent energy use at national level, i.e. the expected decrease in energy use is to some extent “taken back” as energy tends to become cheaper with efficient use. These take-back effects are called rebound effects in the literature and have been debated for decades [5,6]. Although take-back effects have dominated in the rebound literature, super-conservation could also happen, i.e., energy use might be decreasing at a higher rate than the energy efficiency is improving [7,8].
The response of users as well as producers to improvement in energy efficiency determines the outcome, and there is reason to question if energy efficiency improvement in China really leads to substantial decreases in energy consumption and emissions from fossil fuels in China and the world. China has a strong record in energy efficiency improvement, showing up in the reduction of energy intensity by 47 percent from 1990 to 2005 and the potential for further reductions is still considered to be huge, as energy intensity is 3-4 times higher than in the US. Hence, in climate policy context, the faith in China's energy intensity is considerable, but the issue at stake is to what extent China uses measures that are able to reach this target.
Previous studies have shown that the energy efficiency improvement has an economy-wide effect on economic activities, market supply and demand, and across regions [8]. To consider the comprehensive effect, econometric and decomposition models are not plausible as they generally cover only part of the effect under strict assumptions as other things being equal. Hence, we adopt a computable general equilibrium (CGE) model for this study. A CGE model provides a consistent framework to take into account the non-linear forward and backward interlinks between economic activities under various market and resource constraints. To construct such a consistent framework, a CGE model has to involve considerable assumptions to overcome various barriers such as data shortage, uncertain market supply and demand, and imperfect projections of future pathways. This implies that the simulation results of a CGE model may be far from the reality and can only be understood as illustrations for possible cases.
A global CGE model with China as one of the regions is suitable to study this question. First, effects of energy efficiency improvement are not restricted to a small part of an economy. It starts from pure exogenous engineering or practical efficiency improvement and then the effects spread to the whole economy, affecting prices and economic activities like production and consumption of goods and services. A CGE model can capture these economy-wide effects of the energy efficiency improvement. Such effects are typically not taken into account as a result of energy efficiency improvement in structural decomposition analysis [4,9]. Second, a global model is appropriate since China and the global economy are highly integrated. China has overtaken Germany as the world's number one exporter by 2009 and total value of its export and import accounts for over 40 percent of GDP in 2014. It indicates the importance of the external world for the Chinese economy and vice versa. The effects of any policy change in China may strongly depend on the external economic environment. A CGE model limiting the focus to the Chinese economy only may not be suitable any more.
To the best of our knowledge, the effects of energy efficiency improvement in China have not been studied by using a global CGE model. Several CGE models focusing on China alone have been developed to study various questions, e.g., the effects of a tax on carbon emissions in China [10,11,12,13], China's tariff reductions and WTO accession [14], mid-long term energy intensity trends [15], effects of a coal cleaning project [16], the economic impact of different Chinese climate policy options [17], and the effect of energy end-use efficiency improvement on energy use and CO2 emissions [18].
In the present paper, we apply a global CGE model to explore the implications of energy efficiency improvement in China on China's CO2 emissions, economic growth and global CO2 emissions. We look at the effect of an additional one percent improvement in energy efficiency on Chinese and global emissions and question if the effect of the improvement in energy efficiency in China is sensitive to the global climate policy regimes. Since China is highly connected to the external world, the climate policy adopted by other countries may enhance or limit the final effects of improvement in energy efficiency in China. By considering climate policy adopted by other key regions such as United States, European Union, and India, we can examine the differences between effects of energy efficiency improvement in China within alternative external climate policy regimes.
The paper is organized as follows. In Section 2, we introduce the global CGE model applied in the analysis and present scenarios corresponding to alternative global climate policy regimes and the design of energy efficiency improvement in these scenarios. Section 3 reports and discusses the simulation results. The last section summarizes the paper.
The global CGE model applied in the paper is built upon the GRACE model developed at CICERO [19,20]. GRACE stands for the Global Responses to Anthropogenic Change in the Environment. The model has been applied to studies on climate impact, adaptation, mitigation, and related policy analysis [21,22,23,24,25,26]. The model is a multi-sector, multi-region, recursively dynamic global computable general equilibrium (CGE) model. The model version used in this paper is calibrated around the global trade analysis project (GTAP) v7 database with 2004 [1] as a base year [27]. The GTAP v7 database is a global database of input-output tables, which covers consumption, production, intermediate use, taxes, investment and trade for 113 regions and 57 sectors. The database has been used for a wide variety of agricultural, trade, and environmental economics analyses [2]. In this study, we consider only CO2 emissions from fossil fuels combustion from an auxiliary database provided by GTAP [28]. In this context, the definition of non-fossil fuels refers to non-fossil primary energy for primary electricity production only. This is consistent with the way China calculates the non-fossil fuels share of total primary energy consumption [29].
The world is divided into 8 regions: United States, Canada, European Union, Japan, China, India, Russia and the Rest of the World (ROW). The first seven regions are considered as the key players in global climate policy decisions. The depiction of each region's economy includes activities of 15 aggregated production sectors, which are listed in Glomsrød, Wei and Alfsen[30,Table 3]. All sectors except electricity produce only one composite good (or service) by only one technology. The electricity is generated by four technologies: coal-fueled, oil-fueled, gas-fueled, and non-fossil technologies such as hydropower, nuclear power, solar power, wind power, and bioenergy power combined to the non-fossil alternative.
In the static part of the model, i.e. within each period, the total production factors, i.e., labor, capital and natural resources, are supplied exogenously. Labor can be allocated freely among production activities within a region. Capital and natural resources are activity-specific and cannot be reallocated among sectors within the period. The production technology follows the one described in Rive [25] except the electricity production, which is a nested CES function dealing explicitly with generation activities (GEN) and transmission, distribution, and network overhead activities (TD). The data are calibrated to make input and output values for TD and each GEN technology consistent with the GTAP data on the electricity sector. This treatment of electricity production follows the method applied by Sue Wing [31] and a detail description can be found in Rive and Mideksa [32].
As mentioned above, the international trade plays a considerable role in the Chinese economy and the international trade flows are specified as follows. Trade is modeled as bilateral with substitution among those regions that are competing to enter the Chinese market. Import of a specific good from different regions is combined into an import aggregate, which produces a single Armington composite good after combining with the same good produced within China. The combinations are modeled by CES functions. The substitution elasticities are based on those in the Massachusetts Institute of Technology (MIT) emissions prediction and policy analysis (EPPA) model [33]. Substitution between bilateral imports of the same good and between the domestic varieties and aggregate imports is illustrated in Figure 1. Exceptions are made for four energy sectors: (a) refined oil (REF, σd, I = 6), (b) electricity (ELC, σd, I = 0.5; σir = 0.3), (c) gas (GAS, σir = 4) and (d) coal (COL, σir = 4). We note that assumed substitution elasticities can have considerable effects on CGE modeling results. Jacoby, et al. [34] found that it was the single parameter which made the largest impact to results in the EPPA model. Sorrell [35] also questions the validity of assumed elasticities in CGE models. However, since our focus in this paper is to study the relative impacts of different efficiency policy scenarios, we do not pursue the area of substitution elasticities further.
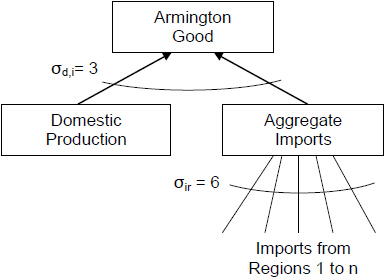 Figure 1. Armington aggregation in international trade.
From one period to another, economic growth is mainly driven by an exogenous choice of savings, by a fixed share of total periodical income in each region. All savings are collected by a virtual “global bank”, which decides in which region to invest. More investments are allocated to regions with high returns to capital, but reallocation is subject to elasticities of transformation. The return to capital is leveled out across regions over time, and equalized in the end. All investments are transformed to capital available for the next period.
Apart from the savings and investments, economic growth can also be attributed to population growth, a change in the availability of natural resources and technological change. The model assumes full utilization of all available resources within each region, meaning that primary production factors like labor and natural resources are not reallocated across regions. Total supply of labor by regions is updated proportionally according to the most recent medium-fertility projections contained in the United Nations Population Division report [36].
Another driver of economic growth is technological advance. After primary factors and specific technology changes have been considered, the technologies in production sectors and for end users are updated exogenously to project a plausible economic growth path in baseline scenario of the global economy, which is approximately the same as the BAU case in World Energy Outlook 2009 [37]. The rates of technological improvements are assumed the same among alternative scenarios.
Income to a region includes income shares of the remuneration to the primary factors of production (labor, capital and natural resources) and direct and indirect taxes collected by the regional government. Revenue from trade in carbon offsets is harvested by capital owners in the trading industries and allocated to consumption or savings in line with return to capital. Except for the returns to capital, the income is collected directly by a virtual regional government. The returns to capital are first collected by a virtual “global trust”, who returns it to the regional manager according to the share of regional capital stocks at the beginning of each period. Hence, the regional manager holds all the income to the region. For further details of the model, see [19,25].
To explore the capacity of energy efficiency improvements as a measure for climate mitigation in China, additional energy efficiency is implemented in three scenarios: Business as usual (BAU), the Copenhagen Accord (SN1), and the International carbon trade (SN2) scenarios. These three scenarios BAU, SN1 and SN2 represent three different international contexts.
The BAU scenario depicts a plausible path of future development of each region in the world where growth rates of GDP during 2004-2020 are calibrated to be approximately the same as in World Energy Outlook 2009 [36], about 6.4 percent annual growth rate per year for China during 2005-2020. The BAU scenario assumes no new carbon abatement policy by any region and serves as a reference for policy analysis associated with alternative international climate policy regimes.
The Copenhagen Accord scenario (SN1) reflects a situation where no binding international agreement is reached, but major economies and emitters follow their own independent climate policies to fulfill their pledges relating to the Copenhagen Accord. The basis for these uncoordinated efforts is the shared understanding of the climate change issues and need for action. In this scenario, the European Union, the United States and China behave as leaders and implement their voluntary commitments to the UNFCCC. India, Japan, Canada, and Russia follow up, accepting the leaders' actions to be sufficient basis for their conditional commitments as stated in their pledges [38]. The Rest of the World is assumed to keep the emissions at the same level as in the BAU scenario. All the policy measures assumed in SN1 are summarized in Glomsrød, Wei and Alfsen [30,Table 2]. The international carbon trade scenario (SN2) is the most ambitious scenario we considered. In this scenario, all regions participate in international carbon trade.
In the two scenarios SN1 and SN2 with global climate policies, we assume that all policy measures are adopted from 2010. Although both policy scenarios are not realistic, they allow us to explore whether the external climate policy context can lead to considerable differences on the effectiveness of the energy efficiency improvement for reduction in energy use and energy-related carbon emissions. Below we outline in more detail the characteristics of these two policy scenarios.
The overall target of European Union is a 20 percent reduction of CO2 emissions from 1990 level by 2020 and 30 percent reduction conditional on behavior of other parties. In the model, we adopt 30 percent reduction for sectors participating in the emission trading system (EU-ETS) and 10 percent for other sectors. All carbon allowances in the power sector are auctioned 100 percent from 2010 whereas other sectors in EU-ETS will receive transitional allowances free of charge according to European Union rules. Free allowances will be phased out progressively from 12 percent in 2010, 20 percent in 2013 to 70 percent in 2020. Sectors that do not participate in ETS, among them households, face the target of 10% reduction from the 2005 level by 2020 and the target will be achieved by a carbon tax.
The target in United States is a 17 percent reduction of CO2 emissions compared with the 2005 level. In the cap and trade system (C&T) an upper bound of 25 USD per ton carbon dioxide (CO2) is introduced. If the carbon price in the C&T reaches above 25 USD per ton CO2, the participants only pay 25 USD and the government will pay the difference. For other sectors, the 17 percent target is achieved by a carbon tax.
China fulfils the target of 40-45 percent reduction of carbon intensity by 2020 compared with the 2005 level. India will reduce the emission intensity of its GDP by 20-25 percent by 2020 in comparison to the 2005 level. This is to be achieved by a tax on carbon emissions by industries and private households. Already in the BAU scenario, however, China and India reach their respective targets on CO2 emissions intensity due to rapid economic growth and efficiency improvement. Hence, these targets are not binding in the Copenhagen Accord scenario.
Canada will reduce carbon emissions by 17 percent compared with the 2005 level; Japan by 25 percent relative to the 1990 level; and Russia by 15 percent of 1990 level, following their pledges [38]. For the Rest of the World, we assume that emissions do not exceed the level in the BAU scenario.
In this scenario, we assume that an international carbon market is operative and that all the regions participate. Carbon emissions allowances can be traded globally and the global carbon market clears to produce an equilibrium carbon price. Hence, from an efficiency point of view this is a best choice scenario. The initial carbon allowances owned by regions are assumed the same as the regional emissions level in the Copenhagen Accord as depicted by scenario SN1. No other regional target or restriction to trade of allowances is in place.
To consider the effect of an additional energy efficiency improvement in China, we assume that the energy efficiency in 2010 is improved by one percent for all sectors in China in all the three scenarios. The improved energy efficiency in 2010 shift the energy efficiency path upwards by one percent in the following years until 2020. The efficiency improvement implies that all producers and consumers use less energy than before to produce and consume one unit product, respectively. For each scenario, we identify the effect of the additional energy efficiency improvement by calculating the deviations of key variables such as energy use and CO2 emissions when the additional improvement in energy efficiency is implemented from that when the additional improvement in energy efficiency is not in place.
In a globalized economy, the rebound effect of improvement in energy efficiency is related to preferences of consumers, production technology and policies worldwide. The three scenarios depict different frameworks for trade opportunities and thus different conditions for rebound effects. We compare the effect of increasing energy efficiency by one percent for China from 2010 across the three scenarios. At the outset in the BAU scenario, rates of energy efficiency improvements are based on assessments internationally by McKinsey [39,40]. The rates for China varies between 0.7percent per year for electricity production based on coal to 0.9 for transportation and 1.4 percent for steel and cement production.
Notice that we assume no cost associated with the additional energy efficiency improvement. The energy intensity of the Chinese economy is particularly high, and the potential for reduction at low cost is supposed to be substantial. As the costs are very low and even resembles win-win opportunities, zero costs might be a reasonable proxy to the real situation where at least some transaction costs are likely to be involved. Also, notice that the BAU scenario can be taken a special case of a scenario generated from a single regional model where only China takes action on energy efficiency improvement.
In all three scenarios, the additional improvement in energy efficiency improves efficiency of the Chinese economy. The ability to compete internationally will be strengthened and the export will increase. GDP will increase and tend to modify the reduction of energy demand due to cost reductions associated with the additional improvement in energy efficiency. So far, the mechanism is the same for all three scenarios. However, when it comes to repercussions through the world market the conditions differ across scenarios.
The Copenhagen Accord Scenario (SN1) settles with uneven mitigation costs across regions and thus differ in costs of energy use. The effect of additional improvement in energy efficiency in China via international trade will thus depend on whether the most important buyers of Chinese export goods have high or low ambitions in climate policy. Terms of trade effect for China will generally improve its position in global markets, but more so towards regions with high climate ambitions and high mitigation costs. In this context, it is useful that the model GRACE tracks bilateral trade and depicts the trade implications of the different climate policy regimes closely. In SN1, due to climate mitigation at a global level and associated reduction in fossil fuel consumption, the price of energy in global markets will tend to be lower than in BAU. The additional improvement in energy efficiency can be expected to lead to less cost reduction and growth stimulus than in BAU, i.e. more reduced energy use and smaller rebound associated with the additional improvement in energy efficiency.
In the global carbon trade scenario (SN2), the user cost of fossil fuel is better harmonized among regions. The additional improvement in energy efficiency will stimulate China's supply of allowances and lower the equilibrium price of allowances in the global market. Hence, improvement in energy efficiency will undermine China's strong position in the trade of carbon offsets. However, the global economy will be less constrained than in SN1, due to a more cost-efficient international mitigation regime. Higher economic growth worldwide will enhance export from China, i.e. from a particular energy intensive economy. However, the production of goods and services in China is competing domestically with the efforts to shrink production and associated energy use to export carbon offsets. China and other exporters will have to find a best balance between export of goods and of allowances.
Figure 2 and 3 show the development of CO2 emissions of China and the world respectively in the cases without additional energy efficiency improvement. Compared to BAU, global emissions are reduced at the same level in both alternative scenarios. However, China increases emissions steadily until about 70 Mt in 2020 in the Copenhagen Accord scenario (SN1) where regional carbon markets are implemented independently and reduces emissions by nearly 1000 million tons CO2 in 2020 in the global carbon market scenario (SN2).
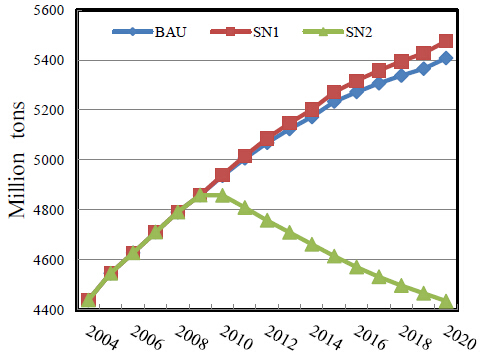 Figure 2. Simulated CO2 emissions in China without additional energy efficiency improvement.
The carbon price (SN2) is clearing the international market for allowances in the global carbon market scenario. The price on allowances is increasing steadily up to 13.4 USD per ton CO2 in 2020. We may compare this CO2 price with the regional marginal cost of carbon emissions in SN1 scenario. For example, by 2020, the European Union has a marginal cost of 25 USD per ton CO2 and the United States has 20 USD per ton CO2 in SN1.
In the BAU scenario, there is no carbon emissions constraint and implicitly the marginal cost of carbon emissions is zero for all regions. The SN1 scenario involves emissions reductions that will incur different mitigation costs to the regions, depending on their ambitions and potential for reductions. Some regions, particularly China, have lower mitigation costs than others, and benefit from improved competition in the global market. In SN2 the obligation to reduce global emissions by imposing a specific regional allocation of targets is removed, hence global costs of mitigation are expected to be lowered, and GDP growth higher than in SN1. Low mitigation cost regions like China will export allowances and harvest a scarcity rent as if a new and valuable resource became available and could be turned into export revenue. Countries importing allowances would on the other hand face an additional tax on their fossil fuel use, but the cost might be lower than the cost of carbon under the Copenhagen Accord scenario as the whole world is included in the trading scheme and supply of offsets might be higher than in SN1. For countries exporting allowances the increasing inflow of export revenue will lead to higher real wage level, thus affect the terms of trade by favoring imports and punishing exports.
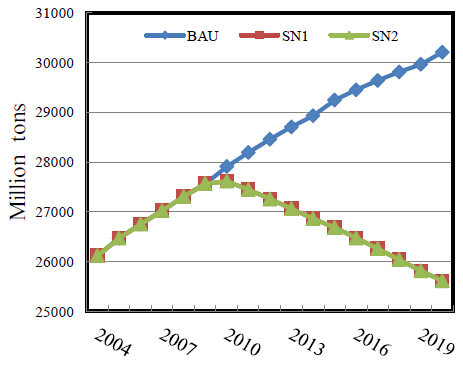 Figure 3. Simulated global CO2 emissions without additional energy efficiency improvement.
In the Copenhagen Accord scenario (SN1), the GDP of China is increasing, however, the national income (GNI) including the carbon premium is decreasing. When looking at the composition of the GNI it turns out that return to natural capital (resources) like coal, oil and gas is somewhat reduced, and return to produced capital owned by Chinese is falling as well. The rise in wage income and taxes are not large enough to compensate for this, and the GNI is declining. The export of China is falling initially as other major regions introduce constraints in terms of carbon taxes. Demand in the global market is reduced, and so is demand for Chinese products although the relative price of China's export goods to world market prices is reduced. However, the volume of demand reduction worldwide dominates over the beneficial price effect. Around 2015, however, the decline is turning into export growth as the price gap in China's favor between Chinese and foreign products increases due to tightening climate policy regimes in the other major economies. European Union with the highest ambitions adds significantly to this by increasing the share of allowances that is auctioned from 20 percent in 2013 to 70 percent by 2020.
In the case of international carbon trade (SN2), GDP falls slightly below BAU, and GNI is falling more markedly than in SN1. Return to capital improves somewhat compared with in SN1, but is still declining, as is also the rent on natural capital (fossil fuels). The carbon premium is increasing rapidly as economic activity level is squeezed to allow for sale of carbon allowances, but this cannot prevent the GNI from falling. The wage income is falling. Hence, the income distribution is not improving under international carbon trade as it is in Copenhagen Accord scenario SN1. In the model, the carbon premium is entirely channeled to savings and enters the global trust, contributing to increased investments not only in China, but also in the rest of the world. Higher carbon premium thus means higher saving rate at national level, since there is a fixed saving rate for other income components.
The option to trade carbon improves efficiency internationally by leveling out and reducing the carbon mitigation cost by incorporating all countries in carbon trade. A downside for China is that the price of carbon is lowered, but the other hand the global economy is expanding and net export is higher than in BAU. Still, an international carbon trade regime represents a less attractive scenario for China than the Copenhagen Accord in terms of GDP, GNI and income distribution.
In SN1, most countries other than China are experiencing stricter production constraints due to stricter carbon emission targets than in BAU. Their demand for fossil fuels is decreasing and prices on coal, oil and gas are falling, leading China to import more and export less. Improvement in energy efficiency decreases demand for fossil fuels in China as a first order effect of energy efficiency improvement, but the economic cost reductions encourage some take-back effects in particular as the economy adapts to the lower energy prices. As shown in Figure 4, energy use initially falls by around 0.45 percent and tends to stay at this level the rest of the period. Emissions of CO2 in China are reduced initially to about the same extent as energy use. Over time, other countries taking on emissions reductions as pledged in the Copenhagen Accord face stricter and stricter regulations, and energy intensive industries in China takes the opportunity to increase export of the products for which other countries are most seriously constrained by climate policies. The rebound effect of improvement in energy efficiency is getting stronger over time since the cost reductions in the wake of improvement in energy efficiency support precisely the energy intensive products that face an increasing international demand.
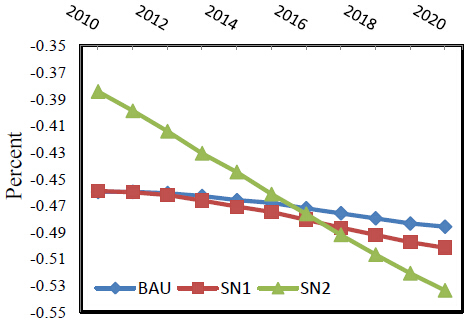 Figure 4. China's energy use reduced by one percent improvement in its 2010 energy efficiency.
The additional energy efficiency improvement in China has modest effect on energy consumed by regions other than China. In 2020, the other regions reduce their energy use by only 0.001 percent in BAU and 0.01 percent in the Copenhagen Accord scenario (SN1). However, in the global carbon trade scenario (SN2), the other regions increase their energy use by 0.02 percent although global emissions keep the same level as that without the additional energy efficiency. By contrast, in all the three scenarios, the other regions increase their CO2 emissions slightly, indicating certain carbon leakage effect on the other regions of the additional energy efficiency in China.
The effect on global CO2 emissions is negative. In BAU, the one percent additional improvement in energy efficiency in China leads to modest reduction in global emissions by 0.065 percent at the beginning in 2010 (Figure 5). The effect is diminishing until 0.052 percent in 2020. By contrast, the effect in the Copenhagen Accord scenario (SN1) is stronger, leading to 0.075 percent reduction in global emissions in the beginning. Over time, the effect is enhancing until 0.081 percent reduction in global emissions in 2020. In the case of international trade, there is no effect on global emissions due to the global emission cap, indicating 100 percent rebound effect on global emissions of the additional improvement in China's energy efficiency.
 Figure 5. Global CO2 emissions mitigated by one percent improvement in China's 2010 energy efficienc.
In SN2 representing the international carbon trade scenario, the effect of improvement in energy efficiency (0.38) is lower than in SN1 initially, but increases to 0.52 by 2020. Thus, the unwelcomed rebound effect is decreasing over time. In this case, China reduces energy consumption more than other regions in order to sell allowances. Fossil fuel use is reduced globally, the price of fossil fuel is falling and the cost saving associated with the additional improvement in energy efficiency is reduced over time, hence the rebound is lower and the effect of improvement in energy efficiency is higher. With respect to CO2 emissions, China's CO2 emissions are reduced initially by 0.29 percent, increasing to 0.35 in 2020, following the same pattern as the rebound for energy use. Figure 6 shows 0.38-0.53 percent reduction in energy use in the three scenarios.
In this study, we have adopted a global CGE model to illustrate how external climate policy environment can affect the expected impact of an additional improvement in energy efficiency in China. Similar to other studies based on CGE models, we should interpret these numerical results by caution as considerable realistic conditions have been abstracted from the model. For example, the model assumes perfect market for all sectors and the products classified to a sector are assumed to be perfect substitutes in domestic market. In this recursive dynamic model, investors are assumed to be myopic without considering long-term returns to capital. The GTAP database used to calibration of parameters may ignore certain important aspects. However, CGE Models are still useful in economic policy analysis [41].
In this study, we have designed three scenarios representing alternative international climate policy context: no climate policy (BAU), Independent regional carbon markets (SN1), and a global carbon market (SN2). For each scenario, we identify the effect of an additional energy efficiency improvement by introducing a one percent energy efficiency gain in each of the scenarios. Our study shows that a one percent energy efficiency improvement reduces energy use by 0.38-0.59 percent per year for all the three scenarios representing alternative international contexts. Hence, the rebound effect is considerable and about the half of the rate of energy efficiency improvement.
The rebound effect is, however, sensitive to structural changes in global markets associated with various climate policy regimes. The initial rebound effect is highest under international carbon trade, but falls rapidly, and is the lowest in all three scenarios by 2020. Energy efficiency improvement stimulates GDP from the beginning although the effect is diminishing over time, in about the same rate in all scenarios. Thus, the major difference among the scenarios is how they shift emphasis between industries due to trade effects from climate policies. Energy efficiency improvement under international carbon trade increases GDP, gross national income and consumption. Hence, China benefits more economically from energy efficiency improvement in this case than in BAU and the Copenhagen Accord scenario (SN1). Even though, China may suffer losses in national income and consumption due to the global emission constraints if the effects of the energy efficiency improvement are not sufficiently strong.
Our study has important policy implications. First of all, the rebound effect is considerable across scenarios and it is of major importance that policy makers consider this when assessing measures for climate mitigation. Without considering the rebound effect, the target on energy mix and climate mitigation may not be achieved as expected by the policy makers. Hence, given the potential energy efficiency improvement, policy makers have to enhance the implementation of other energy policies such as renewable energy development and national carbon market.
Second, our study shows that under the global carbon trade context, the energy efficiency improvement could not reduce emissions more than the targeted emission level in the global carbon market. This may imply that in this case, we cannot rely on the energy efficiency improvement in China to control global emissions although domestic emissions in China may be reduced. Hence, policy makers have to distinguish regional contributions from global contributions to emission reduction. This also reminds policy makers consider overlapped effects of alternative energy policies.
Third, the energy efficiency policy in China may reduce energy use and energy-related emissions more in the new mechanism announced in the Paris Agreement in the COP21. The Paris agreement confirms the bottom-up mechanism to control emissions to review every five year the intended nationally determined contributions (INDCs) pledged by the Parties to UNFCCC. The mechanism of INDCs is similar to our Copenhagen Accord scenario where the energy efficiency improvement in China can contribute more to energy and emission reduction than in BAU. Hence, policy makers may count more on the energy efficiency policy in the new INDC mechanism.
We would like to thank the editor and one anonymous referee for constructive comments. This study was supported by the Research Council of Norway (grant 209701/E20) and the National Natural Science Foundation of China (grant 71333010). Any errors that remain are the responsibility of the authors.
The authors have no conflict of interest.
| [1] |
Li Z (2010) Quantitative analysis of sustainable energy strategies in China. Energy Policy 38: 2149-2160. doi: 10.1016/j.enpol.2009.06.031

|
| [2] |
Gan L (1998) Energy development and environmental constraints in China. Energy Policy 26: 119-128. doi: 10.1016/S0301-4215(97)00101-8
|
| [3] |
Zhang Z (2008) Asian energy and environmental policy: Promoting growth while preserving the environment. Energy Policy 36: 3905-3924. doi: 10.1016/j.enpol.2008.07.015
|
| [4] | Zhu Q, Peng X, Lu Z, et al. (2009) Factors Decomposition and Empirical Analysis of Variations in Energy Carbon Emission in China. Resources Science 31: 2072-2079. |
| [5] |
Dimitropoulos J (2007) Energy productivity improvements and the rebound effect: An overview of the state of knowledge. Energy Policy 35: 6354-6363. doi: 10.1016/j.enpol.2007.07.028
|
| [6] |
Greening L, Greene DL, Difiglio C (2000) Energy Efficiency and Consumption—The Rebound Effect: A Survey. Energy Policy 28: 389-401. doi: 10.1016/S0301-4215(00)00021-5
|
| [7] |
Saunders HD (2008) Fuel conserving (and using) production functions. Energy Economics 30: 2184-2235. doi: 10.1016/j.eneco.2007.11.006
|
| [8] |
Wei T (2010) A general equilibrium view of global rebound effects. Energy Economics 32: 661-672. doi: 10.1016/j.eneco.2009.09.002
|
| [9] | Peters GP, Weber CL, Guan D, et al. (2007) China’s Growing CO2 Emissions: A Race between Increasing Consumption and Efficiency Gains. Environ Sci Technol 41: 5939-5944. |
| [10] | Zhang ZX (1998) The Economics of Energy Policy in China. Cheltenham, UK: Edward Elgar. |
| [11] |
Garbaccio RF, Ho MS, Jorgenson DW (1999) Controlling carbon emissions in China. Environment and Development Economics 4: 493-518. doi: 10.1017/S1355770X99000303
|
| [12] | Wei T, Glomsrød S (2002) The impact of carbon tax on the Chinese economy and reductions of greenhouse gases. World Economics and International Politics: in Chinese. |
| [13] |
Liang QM, Fan Y, Wei YM (2007) Carbon taxation policy in China: How to protect energy- and trade-intensive sectors? J Policy Modeling 29: 311-333. doi: 10.1016/j.jpolmod.2006.11.001
|
| [14] | Fan M, Zheng Y (2001) China’s tariff reductions and WTO accession: A computable General Equilibrium analysis. In: Lloyd P, Zhang XG, editors. Models of the Chinese Economy. Cheltenham, UK: Edward Elgar Publishing Inc. |
| [15] | Li AJ (2008) General Equilibrium Analysis of Mid-long Term Energy Intensity Changing Trend in China; Zhang H, Zhu KL, Han CL, editors. Marrickville: Aussino Acad Publ House. 1222-1226. |
| [16] |
Glomsrød S, Wei T (2005) Coal cleaning: a viable strategy for reduced carbon emissions and improved environment in China? Energy Policy 33: 525-542. doi: 10.1016/j.enpol.2003.08.019
|
| [17] |
Wang K, Wang C, Chen JN (2009) Analysis of the economic impact of different Chinese climate policy options based on a CGE model incorporating endogenous technological change. Energy Policy 37: 2930-2940. doi: 10.1016/j.enpol.2009.03.023
|
| [18] |
Liang QM, Fan Y, Wei YM (2009) The effect of energy end-use efficiency improvement on China’s energy use and CO2 emissions: a CGE model-based analysis. Energy Efficiency 2: 243-262. doi: 10.1007/s12053-009-9043-0
|
| [19] | Aaheim A, Rive N (2005) A model for global responses to anthropogenic changes in the environment (GRACE). Oslo, Norway: CICERO. 05 05. |
| [20] | Liu Y, Wei T (2014) Linking the emissions trading schemes of Europe and China - Combining climate and energy policy instruments. Mitigation and Adaptation Strategies for Global Change: 1-17. |
| [21] |
Aaheim A, Gopalakrishnan R, Chaturvedi R, et al. (2011) A macroeconomic analysis of adaptation to climate change impacts on forests in India. Mitigation and Adaptation Strategies for Global Change 16: 229-245. doi: 10.1007/s11027-010-9266-6
|
| [22] |
Aaheim A, Amundsen H, Dokken T, et al. (2012) Impacts and adaptation to climate change in European economies. Global Environ Change-Human and Policy Dimensions 22: 959-968. doi: 10.1016/j.gloenvcha.2012.06.005
|
| [23] | Glomsrød S, Wei T, Mideksa T, et al. (2014) Energy market impacts of nuclear power phase-out policies. Mitigation and Adaptation Strategies for Global Change: 1-17. |
| [24] | Wei T, Glomsrød S, Zhang T (2015) Extreme weather, food security and the capacity to adapt - the case of crops in China. Food Security forthcoming. |
| [25] |
Rive N (2010) Climate policy in Western Europe and avoided costs of air pollution control. Economic Modelling 27: 103-115. doi: 10.1016/j.econmod.2009.07.025
|
| [26] |
Eskeland GS, Rive NA, Mideksa TK (2012) Europe’s climate goals and the electricity sector. Energy Policy 41: 200-211. doi: 10.1016/j.enpol.2011.10.038
|
| [27] | Badri NG, Walmsley TL, editors (2008) Global Trade, Assistance, and Production: The GTAP 7 Data Base: Center for Global Trade Analysis, Purdue University, Available from: https://www.gtap.agecon.purdue.edu/databases/v7/v7_doco.asp. |
| [28] | Lee HL (2007) An emissions data base for integrated assessment of climat change policy using GTAP. pp. GTAP Resource #1143, Latest update (1108/1106/2007). |
| [29] | NDRC (2009) China’s Policies and Actions for Addressing Climate Change—The Progress Report 2009. National Development and Reform Commission, Beijing, China, Availabel from: http://www.ccchina.gov.cn/WebSite/CCChina/UpFile/File571.pdf. |
| [30] |
Glomsrød S, Wei T, Alfsen K (2013) Pledges for climate mitigation: the effects of the Copenhagen accord on CO2 emissions and mitigation costs. Mitigation and Adaptation Strategies for Global Change 18: 619-636. doi: 10.1007/s11027-012-9378-2
|
| [31] |
Sue Wing I (2006) The synthesis of bottom-up and top-down approaches to climate policy modeling: Electric power technologies and the cost of limiting US CO2 emissions. Energy Policy 34: 3847-3869. doi: 10.1016/j.enpol.2005.08.027
|
| [32] | Rive N, Mideksa TK (2009) Disaggregating the Electricity Sector in the GRACE Model. Oslo, Norway: CICERO. 18 p. |
| [33] | Paltsev S, Reilly JM, Jacoby HD, et al. (2005) The MIT Emissions Prediction and Policy Analysis (EPPA) Model: Version 4. Joint Program Report Series 71. |
| [34] |
Jacoby HD, Reilly JM, McFarland JR, et al. (2006) Technology and technical change in the MIT EPPA model. Energy Economics 28: 610-631. doi: 10.1016/j.eneco.2006.05.014
|
| [35] | Sorrell S (2014) Energy substitution, technical change and rebound effects. Energies 7: 2850-2873. |
| [36] | UNPD (2009) World Population Prospects: The 2008 Revision. United Nations Population Division ed. New York. |
| [37] | IEA (2009) World Energy Outlook 2009: International Energy Agency. |
| [38] | UNFCCC (2010) Information provided by Parties to the Convention relating to the Copenhagen Accord. In: Change UNFCoC, editor. |
| [39] | McKinsey C (2009) China’s green revolution: Prioritizing technologies to achieve energy and environmental sustainability. McKinsey&Company. |
| [40] | McKinsey C (2009) Pathways to a low carbon economy—Version 2 of the Global Greenhouse Gas Abatement Cost Curve McKinsey&Company. |
| [41] | Flôres Junior RG (2008) Are CGE Models Still Useful in Economic Policy Making? FGV/EPGE Escola Brasileira de Economia e Finanças, Getulio Vargas Foundation (Brazil). |
| 1. | Donglan Zha, Jinjin He, The threshold effects of energy efficiency on the elasticity of substitution between energy and non-energy factors, 2017, 10, 1570-646X, 873, 10.1007/s12053-016-9491-2 | |
| 2. | Solveig Glomsrrd, Taoyuan Wei, Business as UNusual: The Implications of Fossil Divestment and Green Bonds for Financial Flows, Economic Growth and Energy Market, 2016, 1556-5068, 10.2139/ssrn.2733423 | |
| 3. | Tinghui Li, Zimei Huang, Benjamin M Drakeford, Statistical measurement of total factor productivity under resource and environmental constraints, 2019, 1, 2689-3010, 16, 10.3934/NAR.2019.1.16 |


Figures(5)

Solveig Glomsrød, Taoyuan Wei. The effects of energy efficiency improvement in China with global interaction[J]. AIMS Energy, 2016, 4(1): 37-51. doi: 10.3934/energy.2016.1.37


 DownLoad: