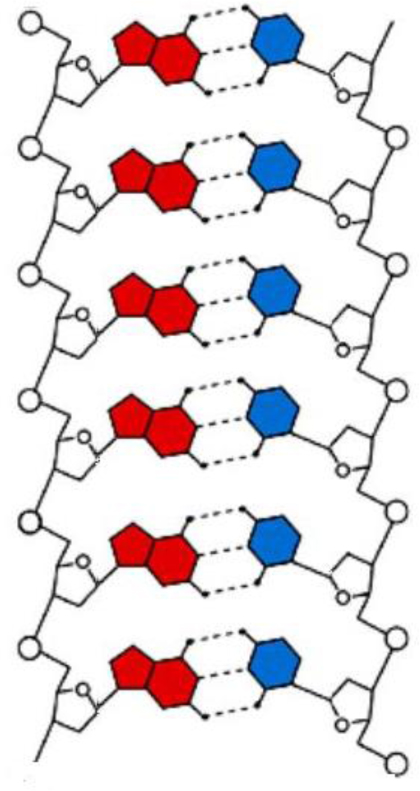
The dynamics of transcription bubbles is modeled using a system of nonlinear differential equations, the one-soliton solutions of which (kinks), are interpreted as a mathematical images of transcription bubbles. These equations contain a lot of DNA dynamic parameters, including the moments of inertia of nitrous bases, distances between base pairs, distances from the centers of mass of bases to sugar-phosphate chains, rigidity of the sugar-phosphate backbone, and interactions between bases within pairs. However, estimates of the parameter values are often difficult, and it is not convenient or simple to operate with such multi-parameter systems. One of the ways to reduce the number of the DNA dynamic parameters is to transform the model equations to a dimensionless form. In this work, we construct a dimensionless DNA model and apply it to study transcription bubbles dynamics. We show that transformation to a dimensionless form really leads to a decrease in the number of the model parameters and really simplifies the analysis of model equations and their solutions.
Citation: Larisa A. Krasnobaeva, Ludmila V. Yakushevich. On the dimensionless model of the transcription bubble dynamics[J]. AIMS Biophysics, 2023, 10(2): 205-219. doi: 10.3934/biophy.2023013
The dynamics of transcription bubbles is modeled using a system of nonlinear differential equations, the one-soliton solutions of which (kinks), are interpreted as a mathematical images of transcription bubbles. These equations contain a lot of DNA dynamic parameters, including the moments of inertia of nitrous bases, distances between base pairs, distances from the centers of mass of bases to sugar-phosphate chains, rigidity of the sugar-phosphate backbone, and interactions between bases within pairs. However, estimates of the parameter values are often difficult, and it is not convenient or simple to operate with such multi-parameter systems. One of the ways to reduce the number of the DNA dynamic parameters is to transform the model equations to a dimensionless form. In this work, we construct a dimensionless DNA model and apply it to study transcription bubbles dynamics. We show that transformation to a dimensionless form really leads to a decrease in the number of the model parameters and really simplifies the analysis of model equations and their solutions.

| [1] | Alberts B, Johnson A, Lewis J, et al. (2015) Molecular Biology of the Cell. New York: W.W. Norton Company. https://doi.org/10.1201/9781315735368 |
| [2] | Severin ES Biochemistry, Moscow: GEOTAR–Media (2004). Available from: https://teacher.3dn.ru/Files/bio_med/severin_bioh.pdf |
| [3] |
Makasheva KA, Endutkin AV, Zharkov DO (2019) Requirements for DNA bubble structure for efficient cleavage by helix-two-turn-helix DNA glycosylases. Mutagenesis 35: 119-128. https://doi.org/10.1093/mutage/gez047 
|
| [4] |
Hillebrand M, Kalosakas G, Bishop AR, et al. (2021) Bubble lifetimes in DNA gene promoters and their mutations affecting transcription. J Chem Phys 155: 095101. https://doi.org/10.1063/5.0060335
|
| [5] |
Grinevich AA, Ryasik AA, Yakushevich LV (2015) Trajectories of DNA bubbles. Chaos, Soliton Fract 75: 62-75. https://doi.org/10.1016/j.chaos.2015.02.009
|
| [6] |
Shikhovtsova ES, Nazarov VN (2016) Nonlinear longitudinal compression effect on dynamics of the transcription bubble in DNA. Biophys Chem 214–215: 47-53. https://doi.org/10.1016/j.bpc.2016.05.005
|
| [7] |
Scott AC, Chu FYF, McLaughlin DW (1973) The soliton: a new concept in applied science. Proc IEEE 61: 1443-1483. https://doi:10.1109/proc.1973.9296
|
| [8] |
Caudrey PJ, Eilbeck JC, Gibbon JD (1975) The sine-Gordon equation as a model classical field theory. Nuovo Cim B 25: 497-512. https://doi.org/10.1007/BF02724733
|
| [9] |
Englander SW, Kallenbach NR, Heeger AJ, et al. (1980) Nature of the open state in long polynucleotide double helices: possibility of soliton excitations. Proc Natl Acad Sci USA 77: 7222-7226. https://doi:10.1073/pnas.77.12.7222
|
| [10] |
McLaughlin DW, Scott AC (1978) Perturbation analysis of fluxon dynamics. Phys Rev A 18: 1652. https://doi.org/10.1103/PhysRevA.18.1652
|
| [11] | McLaughlin DW, Scott AC (1978) A multisoliton perturbation theory. Solitons in Action . New York: Academic Press. https://doi.org/10.1016/B978-0-12-455580-8.50015-9 |
| [12] | Zarubin S, Markelov GE (2013) Lectures on the foundations of mathematical modeling. Moscow: State Technical University named after N.E. Bauman. Available from: https://studfile.net/preview/1683378 |
| [13] |
Rasmuson A, Andersson B, Olsson L, et al. (2014) Mathematical Modeling in Chemical Engineering. New York: United States of America by Cambridge University Press. https://doi.org/10.1002/cite.201590043
|
| [14] |
Torain DS (2014) A dimensionless mathematical model. Am Rev Math Stat 2: 01-16. https://doi: 10.15640/arms.v2n2a1
|
| [15] | Langtangen HP, Pederse GK (2016) Dimensions and units. Scaling of Differential Equations . Springer. https://doi.org/10.1007/978-3-319-32726-6_1 |
| [16] |
Grinevich AA, Masulis IS, Yakushevich LV (2021) Mathematical modeling of transcription bubble behavior in the pPF1 plasmid and its modified versions: The link between the plasmid energy profile and the direction of transcription. Biophysics 66: 248-258. https://doi:10.1134/s000635092102007x
|
| [17] |
Peyrard M, Bishop AR (1989) Statistical mechanics of a nonlinear model for DNA denaturation. Phys Rev Lett 62: 2755-2758. https://doi: 10.1103/physrevlett.62.275
|
| [18] |
Muto V, Scott AC, Christiansen PL (1989) Microwave and thermal generation of solitons in DNA. J Phys Colloques 50: 217-222. https://doi: 10.1051/jphyscol:1989333
|
| [19] |
Frank-Kamenetskii MD, Lazurkin YS (1974) Conformational changes in DNA molecules. Annu Rev Biophys Bioeng 3: 127-150. https://doi: 10.1146/annurev.bb.03.060174.001015
|
| [20] | Frank-Kamenetsky MD (1983) The Most Important Molecule of Life. Moscow: Nauka. |
| [21] |
Frank-Kamenetsky MD, Vologodsky AV (1981) Topological aspects of the physics of polymers: The theory and its biophysical applications. Sov Phys Usp 24: 679. https://doi:10.1070/pu1981v024n08abeh004835
|
| [22] | Yakushevich LV, Krasnobaeva LA, Shapovalov AV, et al. (2005) One- and two-soliton solutions of the sine-Gordon equation as applied to DNA. Biophysics 50: 450-455. |
| [23] |
Yakushevich LV, Krasnobaeva LA (2016) Forced oscillations of DNA bases. Biophysics 61: 241-250. https://doi.org/10.1134/S000635091602024X
|
| [24] |
Scott AC (1969) A nonlinear Klein-Gordon equation. Am J Phys 37: 52-61. https://doi.org/10.1119/1.1975404
|
| [25] | Taylor JR Optical Solitons: Theory and Experiment Cambridge (1991). Available from: https://assets.cambridge.org/97805214/05485/toc/9780521405485_toc.pdf |
| [26] |
Kivshar YS, Malomed BA (1989) Dynamics of solitons in nearly integrable systems. Rev Mod Phys 61: 763-915. https://doi.org/10.1103/revmodphys.61.763
|
| [27] |
Braun OM, Kivshar YS (1998) Nonlinear dynamics of the Frenkel-Kontorova model. Phys Rep 306: 1-108. https://doi.org/10.1016/S0370-1573(98)00029-5
|
| [28] | Kulik IO (1967) Wave propagation in a Josephson tunnel junction in the presence of vortices and the electrodynamics of weak superconductivity. JETP 24: 1307-1317. Available from: http://jetp.ras.ru/cgi-bin/dn/e_024_06_1307.pdf |
| [29] |
Malomed BA (1988) Interaction of a soliton with an impurity in the sine-Gordon model of a commensurate charge-density-wave system. J Phys C Solid State Phys 21: 5163-5181. http://doi:10.1088/0022-3719/21/29/013
|
| [30] | Frenkel YI, Kontorova T (1939) On the theory of plastic deformation and twinning. Acad Sci USSR J Phys 1: 137-149. |
| [31] | Gerus AI, Vikulin AV (2016) Rotational model of a block geoenvironment: mathematical aspects and numerical results. In: Materials of the regional scientific conference “Volcanism and related processes” dedicated to the Volcanologist's IViS FEB RAS, Petropavlovsk-Kamchatsky : 116-121. |
| [32] |
Zharnitsky V, Mitkov I, Levi M (1998) Parametrically forced sine-Gordon equation and domain wall dynamics in ferromagnets. Phys Rev B 57: 5033-5035. https://doi.org/10.1103/PhysRevB.57.5033
|
| [33] |
Zharnitsky V, Mitkov I, Gronbech-Jensen N (1998) π kinks in strongly ac driven sine-Gordon systems. Phys Rev E 58: 52-55. https://doi.org/10.48550/arXiv.patt-sol/9809011
|
| [34] |
Scott AC (1985) Biological Solitons in: Dynamical Problems in Soliton Systems. Berlin, Heidelberg: Springer P. 224-235. https://doi.org/10.1007/978-3-662-02449-2_33
|
| [35] |
Yakushevich LV (2004) Nonlinear physics of DNA. Weinheim: Wiley. Available from: http://ndl.ethernet.edu.et/bitstream/123456789/12866/1/Ludmila%20V.%20Yakushevich_.pdf
|
| [36] | Dauxois T, Peyrard M (2006) Physics of Solitons. Cambridge: Cambridge University Press. Available from: ttps://assets.cambridge.org/97805218/54214/frontmatter/9780521854214_frontmatter.pdf |
| [37] |
Yakushevich LV, Krasnobaeva LA (2021) Ideas and methods of nonlinear mathematics and theoretical physics in DNA science: the McLaughlin-Scott equation and its application to study the DNA open state dynamics. Biophys Rev 13: 315-338. https://doi.org/10.1007/s12551-021-00801-0
|
| [38] |
Kornyshev AA, Wynveen A (2004) Nonlinear effects in the torsional adjustment of interacting DNA. Phys Rev E 69: 041905. https://doi.org/10.1103/PhysRevE.69.041905
|
| [39] |
Cherstvy AG, Kornyshev AA (2005) DNA melting in aggregates: impeded or facilitated?. J Phys Chem B 109: 13024-13029. https://doi.org/10.1021/jp051117i
|
| [40] |
Sebastiani F, Pietrini A, Longo M, et al. (2014) Melting of DNA nonoriented fibers: a wide-angle X-ray diffraction study. J Phys Chem B 118: 3785-3792. https://doi.org/10.1021/jp411096d
|


Figures(3) / Tables(5)

Larisa A. Krasnobaeva, Ludmila V. Yakushevich. On the dimensionless model of the transcription bubble dynamics[J]. AIMS Biophysics, 2023, 10(2): 205-219. doi: 10.3934/biophy.2023013


 DownLoad: