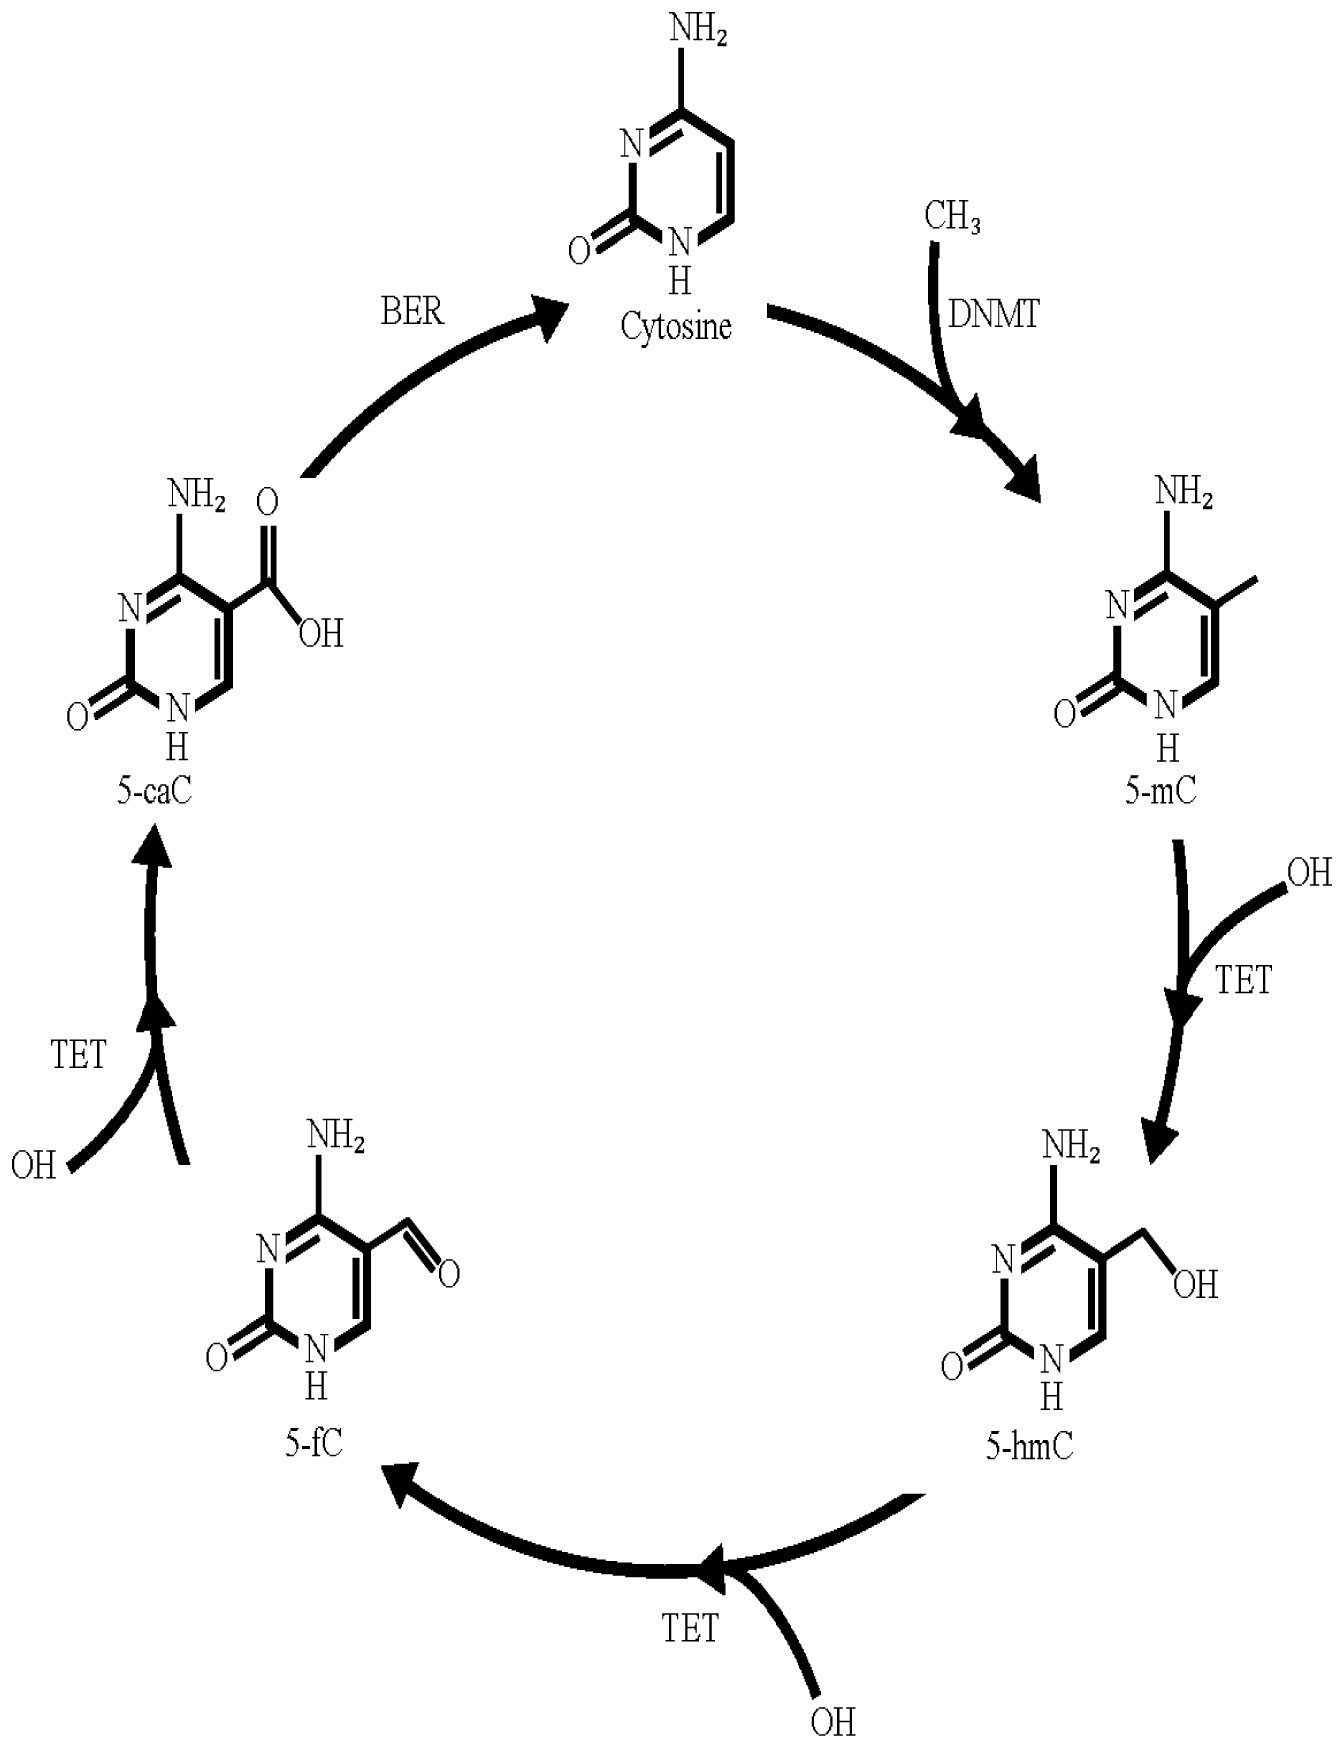
Chromatin is a complex multi-scale structure composed of DNA wrapped around nucleosomes. The compaction state is finely regulated mainly by epigenetic marks present not only on nucleosomes but also on the DNA itself. The most studied DNA post-transcriptional modification is 5-methylcytosine (5-mC). Methylation of the cytosine at CpG islands localized at the promoter is associated with repression of transcription. On the contrary, enrichment of 5-hydroxymethylcytosine (5-hmC), one of the oxidation products of 5-mC by TET (ten-eleven translocation) enzymes, on promoters and enhancers promotes transcription activation. Recently, a new role of 5-hmC has been proposed in the context of DNA repair. 5-hmC was found to be enriched at DNA lesions and knockdown of TET led to impaired repair efficiency. Here, we review our current knowledge regarding the role of the regulation of the 5-mC/5-hmC balance by TET enzymes in the context of transcription modulation as well as DNA repair processes. In a final section, we speculate on the potential involvement of TET proteins in DNA repair mechanisms associated with transcription activation.
1.
Introduction
The brain function of people will be impaired after an extended period of drug abuse across a diverse variety. The classification accuracy of the eight encephalic regions (ERs) in the left and right hemispheres of the prefrontal lobe was analyzed on the basis of the fNIRS data acquired to identify the differences, if any. Statistical analysis was then performed on the eight ERs to find out which of them stand out in drug abusers. The study Innovations: 1) Drug abusers were classified; 2) The differences in classification accuracy were identified by classifying the drug abusers in conjunction with the ERs via CNN; 3) ERs with discernible distinctions in the drug abusers were identified through statistical analysis on the eight ERs in the left and right hemispheres of the prefrontal lobe.
In recent years, near-infrared research is still a new field, and its advantages are gradually recognized by researchers [1]. NIRS in optical brain imaging is a spectral measurement method based on scalp detection, which measures the hemodynamic function of brain tissue using optical injection and detection points, and can record blood-oxygen level [2,3]. Compared with electroencephalography (EEG), a novel mode of brain functional imaging, it has the advantages of convenient wearing, high anti-interference ability and portability [4]. In human body, oxyhemoglobin (HbO2) and deoxyhemoglobin (Hbb) have specific absorption for near-infrared light at 700–900 nm. However, other biological tissues in the brain are relatively transparent in this wavelength range. Therefore, the changes in near-infrared light intensity at 760 and 850 nm emitted into the brain were measured, and the indirect changes in brain functional activity were based on the hemodynamic data transformed according to the Beer-Lambert law [5].
Song et al, using fNIRS to extract oxy-Hb signals from schizophrenia patients and healthy people to construct a prefrontal brain network, and extract features from it to classify schizophrenia patients and healthy people, with a total accuracy rate of 85.5% [6]. Hu et al. propose a hybrid, multi-dimensional fusion structure of spatial and temporal segmentation model for the automated detection of thermography defects. In the model, creatively designed attention blocks the resources for local interaction along neighboring pixels, allowing for an adaptive recalibration of the feature maps. The performance of the two classifications is improved [7]. Kim et al. used NIRS technology to study the relationship between walking speed and blood oxygen activation in brain regions [8]. The proposed network of Koh et al. addresses the need in deep learning to match the data function of a time series with an appropriate network structure. This improves the classification accuracy of EEG and human activity signals [9]. Holtzer researched that changes in walking step length lead to activation of the prefrontal cortex, while Caliandro found that when the walking step length increases, the blood oxygen concentration of the lateral frontal cortex also shows an increasing trend [10,11]. Rodriguez-Rodriguez et al., in the process of monitoring type 1 diabetes mellitus (DM1), creatively used machine learning technology, developed six-feature selection techniques and four predictive algorithms, obtaining the best average performance and the best algorithm classification accuracy [12]. Li et al. calculated the normal people and schizophrenia patients in the 60 s task state [13]. Hennrich et al. collected human near-infrared signals and compared the classification performance of deep neural networks (DNN) for three mental tasks [14]. Abibullaev et al. used DNN to classify four mental tasks with an accuracy rate of 94% [15].
fNIRS is used in the rehabilitation of stroke patients with motor imaging therapy, which can better monitor the changes in the treatment process [16]. Akiyama et al., using fNIRS to study the bilateral frontal cortex of depression patients [17]. fNIRS monitors the neonatal brain development stage, and its cerebral oxygen metabolism and hemodynamic characteristics are significantly different from those of adults [18].
fNIRS is mainly aimed at evaluating and imaging the degree of brain damage in drug addicts, and detecting differences in the activation of the forehead brain area of people with different degree of addiction and Long-term methamphetamine users mid-near infrared detection showed abnormal activation of the prefrontal cortex, orbital frontal cortex, and the anterior cingulate gyrus [19,20]. Now fNIRS has been applied in many fields, such as the research of brain development, the research of perception and cognition, the research of motor control, the research of mental illness, the research of stroke and brain injury [21,22,23,24].
According to the demographic scale, oral statement and medical examination, 30 drug addicts were selected. According to the experimental paradigm containing resting state and drug addiction induction, the near-infrared hemoglobin concentration data was collected. There are 30 subjects in total, classified into three classify. and Based on the CNN model, classification is performed.
2.
Materials and methods
2.1. Participates
Study participant criteria: 1) Meet the diagnostic criteria for disorders caused by DSM-5 psychoactive substances; 2) Patients within six months of a withdrawal period; 3) Junior high school education and above; 4) Age 18–41 years; 5) Voluntary study participation and willingness to sign the informed consent form. Exclusion criteria: 1) Severe cognitive dysfunction, inability to cooperate and complete project-related assessment and testing; 2) Patients with severe physical diseases; 3) Patients with severe psychotic symptoms; 4) Current participation in other psychological interventions and treatments; 5) Current abuse of other substances that affect mental activities (except nicotine). The study was following with the declaration of Helsinki and was approved by the Ethics Committee of Shanghai University (Approval No. ECSHU2020-071).
2.2. Subject description
According to the demographic scale prepared in the early stage, data of 30 subjects (all men), such as drug use type, drug history, average drug dosage, and drug use frequency, were collected and recorded. Moreover, combining these data with personal health information collected from hospital records and experts' discussion and suggestions, three types of drugs were finally screened out, including methamphetamine, heroin, and mixed drugs, where ten subjects each were taking methamphetamine, heroin, and mixed drugs. Table 1 non-sensitive information of participants. METH: means Methamphetamine.
2.3. Near-infrared spectroscopy technology equipment introduction
NIRSIT (OBELAB, Seoul, Korea) and a light source with dual wavelength vertical-cavity surface-emitting laser were used with the following technical spectrum: continuous wave, 780 nm and 850 nm; spatial resolution, 4 × 4 mm2; time resolution, 8.13 Hz; number of light points, 24; number of detection points, 32; and detection depth, 0.2–1.8 cm. The NIRS system used in the experiment allowed measurement of signals from four Source-Detector separations (15, 21.2, 30 and 33.5 mm) and hemodynamic reaction changes at different depths [25,26]. It is a functional NIRS device with 204 channels. Figure 1 NIRSIT wearing method in the experiment.
2.4. NIRSIT channel and functional area division
The NIRSIT channel and functional area are shown in Figure 3. The four advanced functional areas detected through the forehead near-infrared device are as follows: the dorsolateral prefrontal cortex (DLPFC), ventrolateral prefrontal cortex (VLPFC), frontopolar prefrontal cortex, and orbital frontal cortex (OFC). Regarding specific channel distribution, the right DLPFC has 1, 2, 3, 5, 6, 11, 17 and 18 channels. The left dorsolateral prefrontal lobe has 19, 20, 33, 34, 35, 38, 39 and 43 channels. The VLPFC of the left and right hemispheres have 4, 9, 10, 40, 44 and 45 channels. The left and right OFC have 14, 15, 16, 29, 30, 31, 32, 46, 47 and 48 channels. The frontopolar prefrontal cortex electrode arrangement has 7, 8, 12, 13, 21, 22, 23, 24, 25, 26, 27, 28, 36, 37, 41 and 42 channels.
2.5. Near-infrared imaging theory
When light passes through a uniform, non-scattering medium, only the absorption of photons by the medium is considered. According to Beer-Lambert law, the attenuation of light intensity is expressed as:
Among them, ${I_0}$is the incident light intensity, $I$ is the output light intensity, $\varepsilon \left(\lambda \right)$ is the extinction coefficient of the substance at the wavelength $\lambda $, which is determined by the absorbing medium and the wavelength of the light, $c$ is the medium concentration, and the depth L of the penetration medium. Define the absorption coefficient as ${\mu _a}$:
The total absorption coefficient in the medium can be expressed as the linear superposition of the absorption coefficient of each medium:
The optical density can be expressed as:
The absorbance OD represents the degree of light attenuation after passing through the medium, which is related to the absorption coefficient ${\mu _a}$ of the medium, depth L of the penetration medium, and wavelength λ of the irradiated light. The available formula is as follows:
Among them, the absorption coefficient ${\mu _a}$ can be expressed as the product of the chromophore concentration c and its extinction coefficient ε. Considering the scattering problem, a differential path factor "DPF (λ)" is generally introduced, so it can be further expressed as follows:
In the near-infrared band from 650 to 1000 nm, the main absorber of photons is hemoglobin. Although other chromophores also absorb light in this range, their contribution is assumed to be constant so that the change in the measured absorption signal over time can be attributed only to hemoglobin, and it can be expressed as follows:
In the formula, [Hbo] and [Hbb] represent the concentrations of oxyhemoglobin and deoxyhemoglobin, respectively. Changes in the concentrations of oxyhemoglobin and deoxyhemoglobin can be obtained by deformation:
2.6. Experiment and data collection
We used E-prime software package (Psychology Software Tools, Pittsburgh, PA) to write the experimental paradigm, with each picture numbered. The experimental paradigm consisted of three stages.
Figures 3 and 4, are examples of drug abuse-related images and neutral images used in the experimental paradigm. Figure 5 The whole process of experimental paradigm. P means: drug picture; N means: Neutral Picture;
The first stage of the experiment, which lasted for 10 minutes, involved the participants closing their eyes for five minutes and then leaving their eyes open for five minutes.
The second stage of the experiment, which lasted for six minutes, included the drug and neutral pictures. Each time block lasted for 10 seconds, for a total of 16 pictures, which were each displayed for 0.6 seconds. At the beginning, the first four pictures contained two drug images randomly displayed in a group, and the remaining 12 neutral images were displayed randomly. After a block had ended, a 4-second interval picture was shown, with a white background and a black cross.
The third stage of the experiment, which lasted for 4.6 minutes, a completely neutral image was shown. Each time block lasted for 10 seconds and a total of 16 pictures were shown. The picture display time was 0.6 seconds, with a 4-second interval picture shown between each block.
3.
Results
3.1. Introduction to methamphetamine, heroin, and mixed drugs
Methamphetamine easily causes intense excitement, which is difficult to eradicate after addiction [27,28].
Heroin is a psychoanaesthetic drug. Once a person becomes addicted, their physiological reaction is intense, and they have a compulsion to seek medication [29,30].
"Mixed drug abusers" refers to drug users who attempt to mix two or three drugs at a time. A major feature of mixed drug users is that they are the first to be exposed to new drugs. Mixed drugs have strong psychedelic properties, which causes the body to produce neurochemicals and form a dependence on them [31,32,33].
3.2. CNN network design
Data on a total of 30 classified drug users were collected, each drug user containing 56 trials. Each trial corresponded to the channels of near-infrared data 0.625 seconds after the drug image appears. The whole CNN network has 20 layers, including 24 subjects in the training data, 3 in the validation data, and 3 in the testing data. Figure 6, CNN classification model of different types of drug abuse. The CNN model parameter are shown in Table 2.
3.3. EEG and NIRS data preprocessing
3.3.1. EEG and NIRS filtering
NIRS networks are designed with Butterworth filters. The expression of n-order Butterworth filter is:
where n is the order, $ {\boldsymbol{f}}_{\boldsymbol{c}} $ is the cutoff frequency, and $ {\boldsymbol{f}}_{\boldsymbol{p}} $ is the passband edge frequency.
3.3.2. Convolutional layer
Convolutional layers are the core of convolutional neural networks. Its main role is to extract features from the input data. The calculation form is as follows:
$ {x}_{j}^{l} $ is the $ j $th feature of the layer $ l $.$ {k}_{ij}^{l} $ is the $ j $th feature of the layer $ l $ and the $ i $th feature of the layer $ l-1 $. $ {b}_{j}^{l} $ is a bias parameter, $ f(•) $ is the activation function.
3.3.3. Pooling layer
The calculation form is as follows:
$ {x}_{j}^{l} $ is the $ j $th feature of the layer $ l $.$ {\beta }_{1}^{l} $ is the Subsampling coefficient.$ {b}_{j}^{l} $ is the bias parameter, $ down(•) $ is a sub-sampling function, $ f(•) $ is the activation function.
3.3.4. Normalization of data
The specific implementation process is as follows:
3.3.5. Activation function
In this paper, the activation function uses a modified linear unit (ReLU), and the formula is as follows:
3.3.6. Full connection layer
The calculation formula is as follows:
$ {h}_{w, b}\left(x\right) $ is the output value of the neuron.$ x $ is the input feature vector of the neuron.$ w $ is the weight.$ b $ is the bias parameter $ \mathrm{\theta }(\bullet) $ is the activation function.
3.3.7. Softmax layer
The softmax function formula is as follows:
$ {o}_{i} $ is the value of the output neuron corresponding to the Ith category
3.4. Accuracy of different brain regions
Under the same CNN network structure and parameters, there are DLPFC, VLPFC, FPC and OFC prefrontal cortical regions in the left and right hemispheres of the brain. The average accuracy of 10 times obtained is shown in the Table 3.
4.
Discussion
4.1. Confusion matrix of classification accuracy of persons abusing different drugs
In this study, the accuracy rates of eight areas of the prefrontal cortex and of the entire brain were determined. Herein, the accuracy rates of all channels in terms of true-positive, true-negative, false-positive, and false-negative results are given as examples, with methamphetamine abusers labeled as 0, heroin abusers as 1, and mixed abusers as 2. Among the three categories of participants, the accuracy rate of identifying methamphetamine abuse is lower than that of heroin and mixed drugs. Further adjustments to the model can increase the uniformity of the accuracy rate. Figure 7, Confusion matrix of three types of drug abusers.
4.2. Three classification accuracy rate statistics
According to the unified CNN framework, there are 8 functional areas in the prefrontal lobe of the brain, and the correct rate statistics are shown in Figure 8. According to the statistical results, the following conclusions are drawn that the accuracy rate obtained in Left-DLPFC is lower than the Right-DLPFC prefrontal cortex. However, In VLPFC, FPC, OFC functional areas, the accuracy of the left hemisphere of the brain is higher than that of the right hemisphere.
4.3. Statistical analysis of three types of drug abusers
Heroin, methamphetamine, and mixed drug abusers, through one-way ANOVA analysis revealed three types of personnel differences. The analysis results of Table 4 are as follows: Right-VLPFC, Right-OFC, there are significant differences between the three types of personnel. The differences in other functional areas are not very obvious.
The following results can be obtained:
1) Long-term drug abuse of drug users has caused the function of the brain to become stronger or weaker.
2) Long-term drug abuse by drug users on Right-VLPFC and Right-OFC can infer the functional damage of the cortical area.
5.
Conclusions
Due to the different pathogenic mechanisms of drugs, drug users who abuse different types of drugs suffer from different brain damages. In this paper, the blood oxygen levels of 30 drug users were obtained by high-density functional near-infrared spectroscopy. The eight Brodmann areas and the entire prefrontal area of the three types of individuals were identified and classified by the designed CNN to obtain the final results: the 3-class accuracy was lower on the left side than on the right in the DLPFC, while it was higher on the left than on the right in the VLPFC, FPC, and OFC. Statistical analysis on the eight functional areas showed significant differences in the right VLPFC and right OFC, and preliminarily predictions were for the brain damages caused by abusing different drugs.
Acknowledgments
The authors thank the Shanghai Drug Rehabilitation Administration Bureau and Shanghai Qing Dong Drug Rehabilitation Center for their support, and all the people who contribute to the writing of the article. This project was supported by Key Research & Development Project of National Science and Technique Ministry of China (No. 2018YFC0807405, No. 2018YFC1312903), National Natural Science Foundation of China (No. 61976133). Defense Industrial Technology Development Program (JCKY2019413D002) and the Key Research and Development Project of Shandong (2019JZZY021010).
Conflict of interest
The authors declare that they have no conflict of interest.


 DownLoad: