Probiotics are microflora that can improve intestinal health and the immune system, positively impacting human health. This study aimed to evaluate the ability of free cells and Limosilactobacillus fermentum InaCC B1295 (LFB1295) cells encapsulated with cellulose microfiber hydrogel (CMFH) from oil palm fronds (OPF) against gastric acid, bile ox gall, autoaggregation, coaggregation, and hydrophobicity of surface cells to reach the columns with high viability numbers and be capable of attaching to and colonizing the colon. The research was carried out experimentally by referring to previous research methods. Research data in resistance to gastric acid and bile salts, autoaggregation, coaggregation, and cell surface hydrophobicity were analyzed statistically using the t-test and displayed in table and figure form. The results showed that free cells were more susceptible to gastric acid and bile salts than CMFH-encapsulated cells from OPF, as indicated by a much more promising reduction in the viability of free cells compared to CMFH-encapsulated LFB1295 cells from OPF. Hence, LFB1295 free cells had higher autoaggregation, cell surface hydrophobicity, and coaggregation values than CMGH-encapsulated cells from OPF. Free and encapsulated cells generally have high coaggregation values with fellow lactic acid bacteria (LAB), Pediococcus pentosaceus, compared to coaggregation with pathogenic bacteria, namely S. aureus and E. coli. These findings indicate that free cells or cells encapsulated with CMFH-OPF have excellent acid and bile salts, autoaggregation, coaggregation, and hydrophobicity and qualify as probiotics.
Citation: Usman Pato, Yusmarini Yusuf, Emma Riftyan, Evy Rossi, Agrina. Comparison of probiotic properties between free cells and encapsulated cells of Limosilactobacillus fermentum InaCC B1295[J]. AIMS Agriculture and Food, 2024, 9(2): 483-499. doi: 10.3934/agrfood.2024028
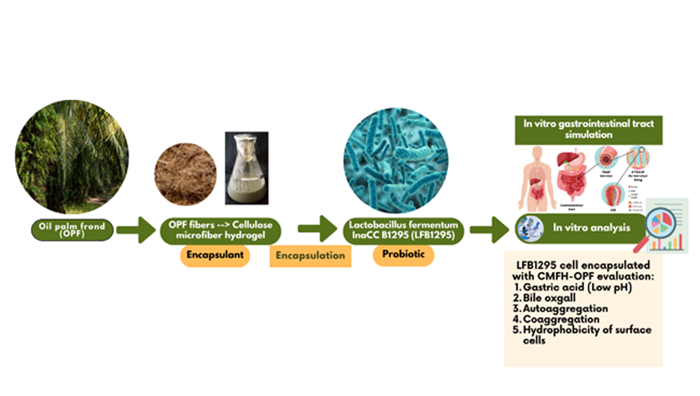
Probiotics are microflora that can improve intestinal health and the immune system, positively impacting human health. This study aimed to evaluate the ability of free cells and Limosilactobacillus fermentum InaCC B1295 (LFB1295) cells encapsulated with cellulose microfiber hydrogel (CMFH) from oil palm fronds (OPF) against gastric acid, bile ox gall, autoaggregation, coaggregation, and hydrophobicity of surface cells to reach the columns with high viability numbers and be capable of attaching to and colonizing the colon. The research was carried out experimentally by referring to previous research methods. Research data in resistance to gastric acid and bile salts, autoaggregation, coaggregation, and cell surface hydrophobicity were analyzed statistically using the t-test and displayed in table and figure form. The results showed that free cells were more susceptible to gastric acid and bile salts than CMFH-encapsulated cells from OPF, as indicated by a much more promising reduction in the viability of free cells compared to CMFH-encapsulated LFB1295 cells from OPF. Hence, LFB1295 free cells had higher autoaggregation, cell surface hydrophobicity, and coaggregation values than CMGH-encapsulated cells from OPF. Free and encapsulated cells generally have high coaggregation values with fellow lactic acid bacteria (LAB), Pediococcus pentosaceus, compared to coaggregation with pathogenic bacteria, namely S. aureus and E. coli. These findings indicate that free cells or cells encapsulated with CMFH-OPF have excellent acid and bile salts, autoaggregation, coaggregation, and hydrophobicity and qualify as probiotics.

| [1] |
Diez-Gutiérrez L, San Vicente L, Luis LJ, et al. (2020) Gamma-aminobutyric acid and probiotics: Multiple health benefits and their future in the global functional food and nutraceuticals market. J Funct Foods 64: 1–14. https://doi.org/10.1016/j.jff.2019.103669 doi: 10.1016/j.jff.2019.103669

|
| [2] |
Salminen S, van Loveren H (2012) Probiotics and prebiotics: Health claim substantiation. Microb Ecol Health Dis 23: 0–3. https://doi.org/10.3402/mehd.v23i0.18568 doi: 10.3402/mehd.v23i0.18568
|
| [3] |
Butel M (2014) Probiotics, gut microbiota and health. Med Mal Infect 44: 1–8. https://doi.org/10.1016/j.medmal.2013.10.002 doi: 10.1016/j.medmal.2013.10.002
|
| [4] |
Martín MJ, Lara-Villoslada F, Ruiz MA, et al. (2015) Microencapsulation of bacteria: A review of different technologies and their impact on the probiotic effects. Innovative Food Sci Emerging Technol 27: 15–25. https://doi.org/10.1016/j.ifset.2014.09.010 doi: 10.1016/j.ifset.2014.09.010
|
| [5] |
Gbassi GK, Vandamme T (2012) Probiotic encapsulation technology: From microencapsulation to release into the gut. Pharmaceutics 4: 149–163. https://doi.org/10.3390/pharmaceutics4010149 doi: 10.3390/pharmaceutics4010149
|
| [6] |
Annan NT, Borza AD, Hansen LT (2008) Encapsulation in alginate-coated gelatin microspheres improves survival of the probiotic Bifidobacterium adolescentis 15703T during exposure to simulated gastrointestinal conditions. Food Res Int 41: 184–193. https://doi.org/10.1016/j.foodres.2007.11.001 doi: 10.1016/j.foodres.2007.11.001
|
| [7] |
Rodrigues FJ, Cedran MF, Bicas JL, et al. (2020) Encapsulated probiotic cells : Relevant techniques, natural sources as encapsulating materials and food applications—A narrative review. Food Res Int 137: 109682. https://doi.org/10.1016/j.foodres.2020.109682 doi: 10.1016/j.foodres.2020.109682
|
| [8] |
Massounga BAF, Li X, Liu L (2021) Physicochemical and functional characterization of newly designed biopolymeric-based encapsulates with probiotic culture and Charantin. Foods 10: 2677. https://doi.org/10.3390/foods10112677 doi: 10.3390/foods10112677
|
| [9] |
Setiarto RHB, Kusumaningrum HD, Jenie BSLJ, et al. (2018) Technology development of probiotic bacteria microencapsulation and it benefit for healthy. J Vet 19: 574–589. https://doi.org/10.19087/jveteriner.2018.19.4.574 doi: 10.19087/jveteriner.2018.19.4.574
|
| [10] |
Gunawan C, Asben A, Anggraini T, et al. (2021) Production and characterization of microcrystalline cellulose from oil palm trunk waste (Elaeis guineensis jacq.) from plantation replanting. J Penelitian Kelapa Sawit 29: 137–146. https://doi.org/10.22302/iopri.jur.jpks.v29i3.139 doi: 10.22302/iopri.jur.jpks.v29i3.139
|
| [11] | Directorate General of Estates (2022) Tree Crop Estate Statistics of Indonesia 2018–2020. Available from: www.ditjenbun.pertanian.go.id. |
| [12] |
Pato U, Yusmarini, Riftyan E, et al. (2023) Physicochemical characteristics of oil palm frond and application of CMF Hydrogel as a natural encapsulant for probiotic. IOP Conf Ser: Earth Environ Sci 1228: 012002. https://doi.org/10.1088/1755-1315/1228/1/012002 doi: 10.1088/1755-1315/1228/1/012002
|
| [13] | Hosono A, Wardoyo R, Otani H (1989) Microbial flora in dadih, a traditional fermented milk in Indonesia. J Technol 22: 20–24 |
| [14] |
Shokryazdan P, Sieo CC, Kalavathy R, et al. (2014) Probiotic potential of Lactobacillus strains with antimicrobial activity against some human pathogenic strains. BioMed Res Int 2014: 927268. https://doi.org/10.1155/2014/927268 doi: 10.1155/2014/927268
|
| [15] |
Khalesi S, Bellissimo N, Vandelanotte C, et al. (2019) A review of probiotic supplementation in healthy adults : helpful or hype?. Eur J Clin Nutr 73: 24–37. https://doi.org/10.1038/s41430-018-0135-9 doi: 10.1038/s41430-018-0135-9
|
| [16] |
Mazaya B, Saafan AE, Aziz M (2016) Antibacterial activity of Lactobacilli Against Salmonella typhi. Middle-East J Sci Res 24: 1887–1898. https://doi.org/10.5829/idosi.mejsr.2016.24.06.10174 doi: 10.5829/idosi.mejsr.2016.24.06.10174
|
| [17] |
Plant L, Lam C, Conway PL, et al. (2003) Gastrointestinal microbial community shifts observed following oral administration of a Lactobacillus fermentum strain to mice. FEMS Microbiol Ecol 43: 133–140. https://doi.org/10.1016/S0168-6496(02)00374-4 doi: 10.1016/S0168-6496(02)00374-4
|
| [18] |
Pato U, Riftyan E, Rossi E, et al. (2022) Probiotic Properties of Lactobacillus fermentum InaCC B1295 Encapsulated by Cellulose Microfiber from Oil Palm Empty Fruit Bunches. Fermentation 8: 602. https://doi.org/10.3390/fermentation8110602 doi: 10.3390/fermentation8110602
|
| [19] |
Xie J, Yao M, Lu Y, et al. (2021) Impact of encapsulating a probiotic (Pediococcus pentosaceus Li05) within gastro-responsive microgels on Clostridium difficile infections. Food Funct 12: 3180–3190. https://doi.org/10.1039/d0fo03235b doi: 10.1039/d0fo03235b
|
| [20] |
Pato U (2003) Bile and acid tolerance of Lactic Acid Bacteria isolated from Dadih and their antimutagenicity against mutagenic heated Tauco. Asian-Australas J Anim Sci 16: 1680–1685. https://doi.org/10.5713/ajas.2003.1680 doi: 10.5713/ajas.2003.1680
|
| [21] | Hu PL, Yuan YH, Yue TL, et al. (2018) Bile acid patterns in commercially available oxgall powders used for the evaluation of the bile tolerance ability of potential probiotics. PLOS ONE 13: e0192964. https://doi.org/10.1371/journal.pone.0192964 |
| [22] | Ding WK, Shah NP (2007) Acid, bile, and heat tolerance of free and microencapsulated probiotic bacteria. J Food Sci 72: M446–M450. https://doi.org/10.1111/j.1750-3841.2007.00565.x |
| [23] | Pato U (2012) Probotics: Prospects and implementation in the field of functional foods and health. Universitas Riau, Pekanbaru. |
| [24] |
Pourramezan Z, Oloomi M, Kasra-Kermanshahi R (2020) Antioxidant and anticancer activities of Lactobacillus Hilgardii strain AG12a. Int J Prev Med 11: 132. https://doi.org/10.4103/ijpvm.IJPVM_307_19 doi: 10.4103/ijpvm.IJPVM_307_19
|
| [25] | Pato U, Hosono A (1999) Binding of cholesterol to the cells and peptidoglycan of Lactobacillus gasseri. Milchwissenschaft 54: 495–498. |
| [26] | Pato U, Ali M, Parlindungan AK (2005) Taurocholate deconjugation and cholesterol binding by indigenous Dadih Lactic Acid Bacteria. Hayati 12: 103–107. |
| [27] |
Widodo W, Fanani TH, Fahreza MI et al. (2021) Cholesterol assimilation of two probiotic strains of Lactobacillus casei used as dairy starter cultures. Appl Food Biotechnol 8: 103–112. https://doi.org/10.22037/afb.v8i2.30661 doi: 10.22037/afb.v8i2.30661
|
| [28] |
Liu Y, Wang J, Wu C (2022) Modulation of gut microbiota and immune system by probiotics. Front Nutr 8: 634897. https://doi.org/10.3389/fnut.2021.634897 doi: 10.3389/fnut.2021.634897
|
| [29] |
Hu S, Wang L, Jiang Z (2017) Dietary additive probiotics modulation of the intestinal microbiota. Protein Pept Lett 24: 382–387. https://doi.org/10.2174/0929866524666170223143615 doi: 10.2174/0929866524666170223143615
|
| [30] |
Abdulla AA, Abed TA, Saeed AM (2014) Adhesion, autoaggregation and hydrophobicity of six Lactobacillus strains. Microbiol Res J Int 4: 381–391. https://doi.org/10.9734/BMRJ/2014/6462 doi: 10.9734/BMRJ/2014/6462
|
| [31] |
Trunk T, Khalil HS, Leo JC (2018) Bacterial autoaggregation. AIMS Microbiol 4: 140–164. https://doi.org/10.3934/microbiol.2018.1.140 doi: 10.3934/microbiol.2018.1.140
|
| [32] |
Abushelaibi A, Al-Mahadin S, El-Tarabily K, et al. (2017) Characterization of potential probiotic lactic acid bacteria isolated from camel milk. LWT-Food Sci Technol 79: 316–325. https://doi.org/10.1016/j.lwt.2017.01.041 doi: 10.1016/j.lwt.2017.01.041
|
| [33] |
Krausova G, Hyrslova I, Hynstova I (2019) In vitro evaluation of adhesion capacity, hydrophobicity, and auto-aggregation of newly isolated potential probiotic strains. Fermentation 5: 1–11. https://doi.org/10.3390/fermentation5040100 doi: 10.3390/fermentation5040100
|
| [34] |
Panjaitan R, Nuraida L, Dewanti-Hariyadi R (2018) Selection of lactic acid bacteria isolated from tempe and tape as probiotic candidates. J Teknologi dan Industri Pangan 29: 175–184. https://doi.org/10.6066/jtip.2018.29.2.175 doi: 10.6066/jtip.2018.29.2.175
|
| [35] |
Affhan S, Dachang W, Xin Y, et al. (2015) Lactic acid bacteria protect human intestinal epithelial cells from Staphylococcus aureus and Pseudomonas aeruginosa infections. Genet Mol Res 14: 17044–17058. https://doi.org/10.4238/2015.December.16.5 doi: 10.4238/2015.December.16.5
|
| [36] |
Das S, Vishakha K, Banerjee S, et al. (2022) A novel probiotic strain of Lactobacillus fermentum TIU19 isolated from Haria beer showing both in vitro antibacterial and antibiofilm properties upon two multi resistant uro-pathogen strains. Curr Res Microb Sci 3: 1–9. https://doi.org/10.1016/j.crmicr.2022.100150 doi: 10.1016/j.crmicr.2022.100150
|
| [37] |
Pato U, Ayu DF, Riftyan E, et al. (2022) Cellulose microfiber encapsulated probiotic: viability, acid and bile tolerance during storage at different temperature. Emerging Sci J 6: 106–117. https://doi.org/10.28991/ESJ-2022-06-01-08 doi: 10.28991/ESJ-2022-06-01-08
|
| [38] |
Shehata MG, Sohaimy SA, El, El-sahn MA, et al. (2016) Screening of isolated potential probiotic lactic acid bacteria for cholesterol lowering property and bile salt hydrolase activity. Ann Agric Sci 61: 65–75. https://doi.org/10.1016/j.aoas.2016.03.001 doi: 10.1016/j.aoas.2016.03.001
|
| [39] |
Baig MA, Turner MS, Liu SQ, et al. (2021) Potential probiotic Pediococcus pentosaceus M41 modulates its proteome differentially for tolerances against heat, cold, acid, and bile stresses. Front Microbiol 12: 1–12. https://doi.org/10.3389/fmicb.2021.731410 doi: 10.3389/fmicb.2021.731410
|
| [40] | Kos B, Suskovic J, Vukovic S, et al. (2003) Adhesion and aggregation ability of probiotic strain Lactobacillus acidophilus M92. J Appl Microbiol 94: 981–987. |
| [41] |
Kumar R, Bansal P, Singh J, et al. (2020) Aggregation, adhesion and efficacy studies of probiotic candidate Pediococcus acidilactici NCDC 252 : A strain of dairy origin. World J Microbiol Biotechnol 8: 1–15. https://doi.org/10.1007/s11274-019-2785-8 doi: 10.1007/s11274-019-2785-8
|
| [42] |
Xing Z, Tang W, Geng W, et al. (2017) In vitro and in vivo evaluation of the probiotic attributes of Lactobacillus kefiranofaciens XL10 isolated from Tibetan kefir grain. Appl Microbiol Biotechnol 101: 2467–2477. https://doi.org/10.1007/s00253-016-7956-z doi: 10.1007/s00253-016-7956-z
|
| [43] |
Koh WY, Lim XX, Tan T, et al. (2022) Encapsulated probiotics: potential techniques and coating materials for non-dairy food applications. Appl Sci 12: 10005. https://doi.org/10.3390/app121910005 doi: 10.3390/app121910005
|
| [44] |
Anselmo AC, Mchugh KJ, Webster J, et al. (2016) Layer-by-layer encapsulation of probiotics for delivery to the microbiome. Adv Mater 28: 9486–9490. https://doi.org/10.1002/adma.201603270 doi: 10.1002/adma.201603270
|
| [45] | Charteris WP, Kelly PM, Morelli L, et al. (1998) Development and application of an in vitro methodology to determine the transit tolerance of potentially probiotic Lactobacillus and Bifidobacterium species in the upper human gastrointestinal tract. Fuller 759–768. |
| [46] |
Hansen LT, Allan-Wojtas PM, Jin YL, et al. (2002) Survival of Ca-alginate microencapsulated Bifidobacterium spp. in milk and simulated gastrointestinal conditions. Food Microbiol 19: 35–45. https://doi.org/10.1006/fmic.2001.0452 doi: 10.1006/fmic.2001.0452
|
| [47] |
Amor KB, Breeuwer P, Verbaarschot P, et al. (2002) Multiparametric flow cytometry and cell sorting for the assessment of viable, injured, and dead Bifidobacterium cells during bile salt stress. Appl Environ Microbiol 68: 5209–5216. https://doi.org/10.1128/AEM.68.11.5209 doi: 10.1128/AEM.68.11.5209
|
| [48] |
Aslim B, Onal D, Beyatli Y (2007) Factors influencing autoaggregation and aggregation of Lactobacillus delbrueckii subsp. bulgaricus isolated from handmade yoghurt. J Food Prot 70: 223–227. https://doi.org/10.4315/0362-028X-70.1.223 doi: 10.4315/0362-028X-70.1.223
|
| [49] |
Rojek AZ, Kośmider A, Stępień K, et al. (2022) Adhesion and aggregation properties of Lactobacillaceae strains as protection ways against enteropathogenic bacteria. Arch Microbiol 204: 1–13. https://doi.org/10.1007/s00203-022-02889-8 doi: 10.1007/s00203-022-02889-8
|
| [50] | Nwoko EQA, Okeke IN (2021) Bacteria autoaggregation: how and why bacteria stick together. Biochem Soc Trans 1: 1147–1157. https://doi.org/https://doi.org/10.1042/BST20200718 |
| [51] |
Havva E, Belma A, Derya DO (2009) Some factors affecting the autoaggregation ability of vaginal lactobacilli isolated from turkish women. Arch Biol Sci 61: 407–412. https://doi.org/10.2298/ABS0903407E doi: 10.2298/ABS0903407E
|
| [52] |
Yu H, Wu Z, Guo B, et al. (2013) Aggregation and adhesion properties of 22 Lactobacillus strains. J Dairy Sci 96: 4252–4257. https://doi.org/10.3168/jds.2013-6547 doi: 10.3168/jds.2013-6547
|
| [53] | Kusmiyati N, Wicaksono ST, Sukarno AS (2022) Isolation and characterization of probiotic lactic acid bacteria from human breast milk. Nova Biotechnol Chim 21: e1053. https://doi.org/10.36547/nbc.1053 |
| [54] | Ingerson M, Reid A (2011) E. coli: good, bad, & deadly. Conference: American Academy of Microbiology FAQ, 1–17. Available from: https://www.researchgate.net/publication/281629337_E_coli_Good_bad_deadly/citations. |
| [55] |
Torso LM, Voorhees RE, Forest SA, et al. (2015) Escherichia coli O157:H7 outbreak associated with restaurant beef grinding. J Food Prot 78: 1272–1279. https://doi.org/10.4315/0362-028X.JFP-14-545 doi: 10.4315/0362-028X.JFP-14-545
|
| [56] |
Goss CH, Muhlebach MS (2011) Staphylococcus aureus and MRSA in cystic fibrosis. J Cystic Fibrosis 10: 298–306. https://doi.org/10.1016/j.jcf.2011.06.002 doi: 10.1016/j.jcf.2011.06.002
|
| [57] | Todar K (2012) Staphylococcus aureus and Staphylococcal Disease. Todar's Online Textbook of Bacteriology. Available from: https://textbookofbacteriology.net/staph.html |
| [58] |
Pepicelli M, Binelli MR, Studart AR, et al. (2021) Self-grown bacterial cellulose capsules made through emulsion templating. ACS Biomater Sci Eng 7: 3221–3228. https://doi.org/10.1021/acsbiomaterials.1c00399 doi: 10.1021/acsbiomaterials.1c00399
|
| [59] |
Seddiqi H, Oliaei E, Honarkar H, et al. (2021) Cellulose and its derivatives: Towards biomedical applications. Cellulose 28: 1893–1931. https://doi.org/10.1007/s10570-020-03674-w doi: 10.1007/s10570-020-03674-w
|
| [60] |
Jiang Y, Geng M, Bai L (2020) Targeting biofilms therapy: current research strategies and development hurdles. Microorganisms 8: 1222. https://doi.org/10.3390/microorganisms8081222 doi: 10.3390/microorganisms8081222
|
| [61] |
Danchik C, Casadevall A (2021) Role of cell surface hydrophobicity in the pathogenesis of medically-significant fungi. Front Cell Infect Microbiol 10: 1–7. https://doi.org/10.3389/fcimb.2020.594973 doi: 10.3389/fcimb.2020.594973
|
| [62] |
Abitbol T, Rivkin A, Cao Y, et al. (2016) Nanocellulose, a tiny fiber with huge applications. Curr Opin Biotechnol 39: 76–88. https://doi.org/10.1016/j.copbio.2016.01.002 doi: 10.1016/j.copbio.2016.01.002
|


Figures(4) / Tables(2)

Usman Pato, Yusmarini Yusuf, Emma Riftyan, Evy Rossi, Agrina. Comparison of probiotic properties between free cells and encapsulated cells of Limosilactobacillus fermentum InaCC B1295[J]. AIMS Agriculture and Food, 2024, 9(2): 483-499. doi: 10.3934/agrfood.2024028


 DownLoad: