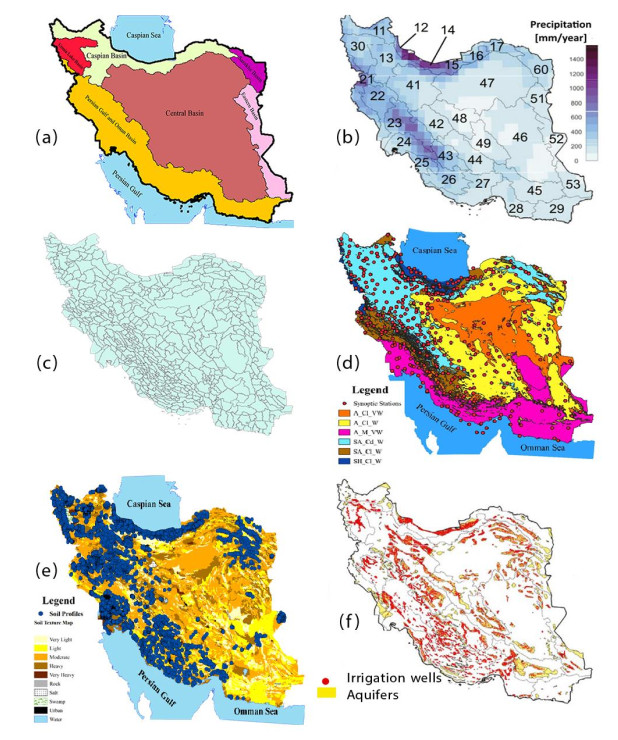
A national web-based simulation portal was developed to estimate the irrigation water requirements at plain scale in Iran. The National Water Portal (NWP) consists of four national databases (climatic, soil, crop, and spatial data), a lumped water balance model, and a graphical user interface (GUI). The irrigation water requirements in standard conditions were estimated based on the dual crop coefficient approach presented by FAO 56. Net irrigation requirements (NIR) and gross irrigation requirements (GIR) were calculated for 125 different crops cultivated in the 609 plains in Iran. Results were aggregated at both political and hydrological scales. The statistical comparison between the estimated NIR and reported values in the literature reviews indicates a correlation coefficient of 75% with root mean square error (RMSE) of less than 280 m3 ha−1. Results showed that sugar cane has the highest NIR value (18318 m3 ha−1) among the studied crops, and sugar beet has the second highest NIR value (5100–11896 m3 ha−1). The aggregated amount of NIR and GIR for the entire country was calculated as 47 and 105 billion cubic meters (BCM), respectively. Results indicate that 3.772 million cubic meter (MCM) of water can be saved by applying 15% water stress. By increasing the irrigation efficiency to 65% without considering any water stress, 3.482 MCM of water can be saved.
Citation: Majid Vazifedoust, Mohammadreza Keshavarz, Ali Mokhtari, Elham Barikani, Mojtaba Palouj. Comprehensive assessment of irrigation water requirements in Iran[J]. AIMS Agriculture and Food, 2024, 9(1): 282-303. doi: 10.3934/agrfood.2024017
A national web-based simulation portal was developed to estimate the irrigation water requirements at plain scale in Iran. The National Water Portal (NWP) consists of four national databases (climatic, soil, crop, and spatial data), a lumped water balance model, and a graphical user interface (GUI). The irrigation water requirements in standard conditions were estimated based on the dual crop coefficient approach presented by FAO 56. Net irrigation requirements (NIR) and gross irrigation requirements (GIR) were calculated for 125 different crops cultivated in the 609 plains in Iran. Results were aggregated at both political and hydrological scales. The statistical comparison between the estimated NIR and reported values in the literature reviews indicates a correlation coefficient of 75% with root mean square error (RMSE) of less than 280 m3 ha−1. Results showed that sugar cane has the highest NIR value (18318 m3 ha−1) among the studied crops, and sugar beet has the second highest NIR value (5100–11896 m3 ha−1). The aggregated amount of NIR and GIR for the entire country was calculated as 47 and 105 billion cubic meters (BCM), respectively. Results indicate that 3.772 million cubic meter (MCM) of water can be saved by applying 15% water stress. By increasing the irrigation efficiency to 65% without considering any water stress, 3.482 MCM of water can be saved.

| [1] | Ebrahimi P (2022) Chapter 14—Analysis of social resilience of villagers in the face of drought using LPCIEA indicator case study: Downstream of Dorodzan dam. In: Pourghasemi HR (Ed.), Computers in Earth and Environmental Sciences, Elsevier, 199–219. https://doi.org/10.1016/B978-0-323-89861-4.00039-7 |
| [2] |
Mokarram M, Pourghasemi HR, Hu M, et al. (2021) Determining and forecasting drought susceptibility in southwestern Iran using multi-criteria decision-making (MCDM) coupled with CA-Markov model. Sci Total Environ 781: 146703. https://doi.org/10.1016/j.scitotenv.2021.146703 doi: 10.1016/j.scitotenv.2021.146703

|
| [3] |
Mafi-Gholami D, Zenner EK, Jaafari A, et al. (2020) Spatially explicit predictions of changes in the extent of mangroves of Iran at the end of the 21st century. Estuarine, Coastal Shelf Sci 237:106644. https://doi.org/10.1016/j.ecss.2020.106644 doi: 10.1016/j.ecss.2020.106644
|
| [4] |
Mesgaran MB, Madani K, Hashemi H, et al. (2017) Iran's land suitability for agriculture. Sci Rep 7: 7670. https://doi.org/10.1038/s41598-017-08066-y doi: 10.1038/s41598-017-08066-y
|
| [5] | Abasi F, Naseri A, Sohran F, et al. (2015) Official Report: Improvement of water consumption efficiency. Agricultural Research Education and Extension Organization of IRAN. |
| [6] |
Saemian P, Tourian MJ, AghaKouchak A, et al. (2022) How much water did Iran lose over the last two decades? J Hydrol: Reg Stud 41: 101095. https://doi.org/10.1016/j.ejrh.2022.101095 doi: 10.1016/j.ejrh.2022.101095
|
| [7] |
Pirmoradian N, Davatgar N (2019) Simulating the effects of climatic fluctuations on rice irrigation water requirement using AquaCrop. Agric Water Manag 213: 97–106. https://doi.org/10.1016/j.agwat.2018.10.003 doi: 10.1016/j.agwat.2018.10.003
|
| [8] | United Nations Educational, Scientific and Cultural Organization (UNESCO) (1979) Map of the world distribution of arid regions: Explanatory note. Paris, 54. |
| [9] | Allen RG, Pereira LS, Raes D, et al. (1998) Crop Evapotranspiration-Guidelines for computing crop water requirements-FAO Irrigation and drainage paper 56. FAO, Rome 300: D05109. |
| [10] |
Shahrokhnia MH, Sepaskhah AR (2013) Single and dual crop coefficients and crop evapotranspiration for wheat and maize in a semi-arid region. Theor Appl Climatol 114: 495–510. https://doi.org/10.1007/S00704-013-0848-6 doi: 10.1007/S00704-013-0848-6
|
| [11] | Doorenbos J (1977) Guidelines for predicting crop water requirements. FAO Irrig Drain Pap 24: 1–179. |
| [12] |
Hargreaves GH, Samani ZA (1985) Reference crop evapotranspiration from temperature. Appl Eng Agric 1: 96–99. https://doi.org/10.13031/2013.26773 doi: 10.13031/2013.26773
|
| [13] |
Rosa RD, Paredes P, Rodrigues GC, et al. (2012) Implementing the dual crop coefficient approach in interactive software. 1. Background and computational strategy. Agric Water Manag 103: 8–24. https://doi.org/10.1016/j.agwat.2011.10.013 doi: 10.1016/j.agwat.2011.10.013
|
| [14] |
Liu Y, Luo Y (2010) A consolidated evaluation of the FAO-56 dual crop coefficient approach using the lysimeter data in the North China Plain. Agric Water Manag 97: 31–40. https://doi.org/10.1016/j.agwat.2009.07.003 doi: 10.1016/j.agwat.2009.07.003
|
| [15] |
Phogat V, Šimůnek J, Skewes MA, et al. (2016) Improving the estimation of evaporation by the FAO-56 dual crop coefficient approach under subsurface drip irrigation. Agric Water Manag 178: 189–200. https://doi.org/10.1016/j.agwat.2016.09.022 doi: 10.1016/j.agwat.2016.09.022
|
| [16] |
Paredes P, Rodrigues GJ, Petry MT, et al. (2018) Evapotranspiration partition and crop coefficients of Tifton 85 Bermudagrass as affected by the frequency of cuttings. Application of the FAO56 Dual Kc Model. Water 10: 558. https://doi.org/10.3390/W10050558 doi: 10.3390/W10050558
|
| [17] |
Abasi F, Sohrab F, Abasi N (2017) Evaluation of irrigation efficiencies in Iran. Irrig Drain Struct Eng Res 17: 113–120. https://doi.org/10.22092/aridse.2017.109617 doi: 10.22092/aridse.2017.109617
|
| [18] |
Mokhtari A, Noory H, Vazifedoust M, et al. (2019) Evaluation of single crop coefficient curves derived from Landsat satellite images for major crops in Iran. Agric Water Manag 218: 234–249. https://doi.org/10.1016/j.agwat.2019.03.024 doi: 10.1016/j.agwat.2019.03.024
|
| [19] | Nasiri A (2014) Water requirements of wheat and barley in Ahar. J Dev Geo 107: 35–40. |
| [20] | Heydari N (2011) Determination and evaluation of water use efficiency of some major crops under farmers management in Iran, J Water Irrig Manag 1: 43–57. https://jwim.ut.ac.ir/article_24582.html?lang = en |
| [21] |
Raoof M (2019) Determination of sugar beet crop coefficient using lysimeter in Ardabil Plain and its comparison with FAO global data. J Water Res Agric 33: 175–188. https://doi.org/10.22092/jwra.2019.119736 doi: 10.22092/jwra.2019.119736
|
| [22] | Shahabifar M, Rahimian M (2008) Measurement of sugar beet water requirements by lysimeter method in Mashhad. J Sugar Beet 23: 177–184. https://www.sid.ir/en/journal/ViewPaper.aspx?id=120647 |
| [23] |
Panahi M, Agdaei M, Rezaei M (2006) Determination of sugar beet standard evapotranspiration by lysimeter method in Kabotar-Abad, Esfahan. J Sugar Beet 22: 37–25. https://doi.org/10.22092/jsb.2006.1663 doi: 10.22092/jsb.2006.1663
|
| [24] | Zare Abyaneh H, Farrokhi E, Bayat Varkeshi M, et al. (2011) Determination of water requirement and the effect of the changes on some quantitative and qualitative characteristics of products of sugar beet. J Sugar Beet 27: 153–167. https://www.sid.ir/en/journal/ViewPaper.aspx?id = 263798 |
| [25] | Gheysari M, Mirlatifi SM, Homaee M, et al. (2006) Determination of crop water use and crop coefficient of corn silage based on crop growth stages. J Agric Eng Res 7: 125–142. |
| [26] | Sepahvand M (2009) Comparison of water requirement, water productivity and economical water productivity of wheat and rapeseed in the west of Iran in wet years. Iran Water Res J 3: 63–68. https://www.sid.ir/en/journal/ViewPaper.aspx?id = 176386 |
| [27] | Niazi JA, Fouladmand HR, Ahmadi SH, et al. (2005) Water requirement and crop coefficient of wheat in Zarghan area, Fars Province. J Sci Technol Agric Natl Resour 9: 1–9. https://www.sid.ir/en/journal/ViewPaper.aspx?id = 34199 |
| [28] | Ghaemi M, Raeini Sarjaz M, Mosavi M (2013) Estimating the crop coefficient and the water requirement of the Gascogne wheat by using energy balance method in Mashhad. Iran J Irrig Water Eng 3: 58–68. https://www.sid.ir/en/journal/ViewPaper.aspx?id = 378207 |
| [29] | Kamaledin H, Dahanzadeh B (2014) Evaluation of irrigation water saving amount in the wheat cultivation in Ahvaz City. J Water Eng 2: 75–86. https://jwe.shoushtar.iau.ir/article_529611.html |
| [30] | Haghighati B (2013) Report of the Promotion Plan—Improving management and optimal water consumption in the process of producing agricultural products. Agricultural and Natural Resources Research Center of Chaharmahal and Bakhtiari. Persian with English abstract. |
| [31] | Absalan S, Heydari N, Sedaghat M (2011) Evaluation of water productivity in the saline areas of lower karkheh basin and determination of its causes: a study from southern Iran. Cercetări Agronomice în Moldova XLIV 3. |
| [32] | Ghasemi Nejad Raeini MR, Maroufi S, Zare Kohan M, et al. (2012) Study of water productivity index and its comparison with current conditions of wheat fields. Irrig Sci Eng 1: 71–77. https://sid.ir/paper/217063/fa |
| [33] | Salamati N, Baghani J, Abbasi F (2018) Determination of wheat water productivity in sprinkler and surface irrigation systems (Case Study in Behbahan). Iran J Soil Water Res 49: 821–830. https://www.sid.ir/en/journal/ViewPaper.aspx?id = 653251 |
| [34] |
Gholami Sefidkouhi MA, Bagheri Khalili Z, GhaleNovi MA (2021) Investigation of rice actual evapotranspiration and crop coefficients for Shiroudi and Hashemi cultivars in Sari. J Water Res Agric 36: 505–515. https://doi.org/10.22092/jwra.2021.123620 doi: 10.22092/jwra.2021.123620
|
| [35] |
Jalali Koutenaei N, Shahnazari A, Ziatabar Ahmadi MK, et al. (2021) Estimation of water requirement and crop coefficients of rice cultivars Kuhsar and Hashemi in different cultivation systems. J Water Res Agric 35: 235–245. https://doi.org/10.22092/jwra.2021.352374.833 doi: 10.22092/jwra.2021.352374.833
|
| [36] |
Shahnazari A, Ziatabar Ahmadi M, Aghajani mazandarani G (2012) The comparison of water balance parameters in traditional and leveled paddy fields in Qaemshahr, Iran. Water Soil 26: 1010–1017. https://doi.org/10.22067/jsw.v0i0.15305 doi: 10.22067/jsw.v0i0.15305
|
| [37] | Modabberi H, Mirlatifi M, Gholami MA (2014) Determination of evapotranspiration and crop coefficient of two rice cultivars in Mordab Plain (Guilan Province). J Hydrol Soil Sci 18: 95–106. |
| [38] | Pirmoradian N, Zekri F, Rezaei M, et al. (2013) Derivation of crop coefficients of three rice varieties based on ETo estimation method in Rasht region. Cereal Res 3: 95–106. https://cr.guilan.ac.ir/article_1603.html |
| [39] | Majnooni-Heris A, Nazemi AH, Sadraddini AA, et al. (2012) Evaluation of Maize Simulation Model (MSM2) by Lysimetric Data. J Water Soil Sci 22: 55. |
| [40] | Mashal M, Varavypour M, Sadatnouri SA, et al. (2009) Optimizing consumptive water depth for corn by deficit-irrigation (Case Study: Varamin area). J Agric Res (Water, Soil and Plants in Agriculture) 8: 123–134. |
| [41] | Zand-Parsa SH, Soltani GHR, Sepaskhah AR (2001) Determination of optimum irrigation depth of corn in sprinkler irrigation. J Hydrol Soil Sci 5: 1–7. |
| [42] | Sheini Dashtegol A, Hamoodi M (2009) Studying the water requirement and plant coefficients of sugarcane by lysimetric method in the sugarcane lands of South Ahvaz. The 11th Iranian Soil Science Congress, Gorgan. Available from: https://civilica.com/doc/291596/. |
| [43] |
Mirzaie-Nodoushan F, Morid S, Dehghanisanij H (2020) Reducing water footprints through healthy and reasonable changes in diet and imported products. Sustain Prod Consum 23: 30–41. https://doi.org/10.1016/j.spc.2020.04.002 doi: 10.1016/j.spc.2020.04.002
|
| [44] |
Karandish F, Nouri H, Brugnach M (2021) Agro-economic and socio-environmental assessments of food and virtual water trades of Iran. Sci Rep 11: 15022. https://doi.org/10.1038/s41598-021-93928-9 doi: 10.1038/s41598-021-93928-9
|
| [45] |
Khorsandi M, Omidi T, Van Oel P (2023) Water-related limits to growth for agriculture in Iran. Heliyon 9: e16132. https://doi.org/10.1016/j.heliyon.2023.e16132 doi: 10.1016/j.heliyon.2023.e16132
|
| [46] |
Khorsandi M, Homayouni S, Van Oel P (2022) The edge of the petri dish for a nation: Water resources carrying capacity assessment for Iran. Sci Total Environ 817: 153038. https://doi.org/10.1016/j.scitotenv.2022.153038 doi: 10.1016/j.scitotenv.2022.153038
|


Figures(6) / Tables(7)

Majid Vazifedoust, Mohammadreza Keshavarz, Ali Mokhtari, Elham Barikani, Mojtaba Palouj. Comprehensive assessment of irrigation water requirements in Iran[J]. AIMS Agriculture and Food, 2024, 9(1): 282-303. doi: 10.3934/agrfood.2024017


 DownLoad: