IL-10-induced DC (DC10) secrete IL-10, thereby promoting aeroallergen tolerance by activation of CD25+Foxp3+ Treg, while retinoic acid-induced DC (DC-RA) foster food allergen tolerance via IL-27-dependent induction of Foxp3− Treg. In some respects, these outcomes reflect those seen with aero- or food allergen-presenting lung and intestinal DC, respectively. Herein we asked whether these DCreg would also be functional in their reciprocal settings. DC-RA expressed lower levels of CCR5, CCR9, and CD103 than DC10, but higher levels of CD40, CD86, MHC II, TGF-β, IL-27 and Aldh1A2. DC-RA were also more effective in suppressing OVA-specific T cell proliferation in vitro (p ≤ 0.05). Co-culture of DC10 or DC-RA with OVA-specific T cells activated a regulatory phenotype therein, with the DC-10-induced Treg being modestly more suppressive in vitro than the DC-RA-induced Treg. We previously reported on lung trafficking of DC10, but DC-RA also traffic through the lungs and mediastinal lymph nodes before accumulating in the mesenteric lymph nodes. Both DCreg populations equally reduced airway hyperresponsiveness, Th2 responses (Th2 cytokines, eosinophilia) to airway allergen challenge, and plasma IgE/IgG1 levels in an OVA-asthma model. Similarly, they were equally effective in our OVA-food allergy model, where they reduced clinical scores (p ≤ 0.001), mast cell activation (p ≤ 0.05) and Th2 cytokine responses to allergen challenge, as well as OVA-specific IgE/IgG1 levels (p ≤ 0.01). Taken together, this data indicates that while DC10 and DC-RA employ distinct operative mechanisms, they were both able to induce tolerance in lung- and gut-associated allergic disease.
Citation: Chunyan Li, Wojciech Dawicki, Xiaobei Zhang, Chris Rudulier, John R. Gordon. IL-10- and retinoic acid-induced regulatory dendritic cells are therapeutically equivalent in mouse models of asthma and food allergy[J]. AIMS Allergy and Immunology, 2021, 5(2): 73-91. doi: 10.3934/Allergy.2021007
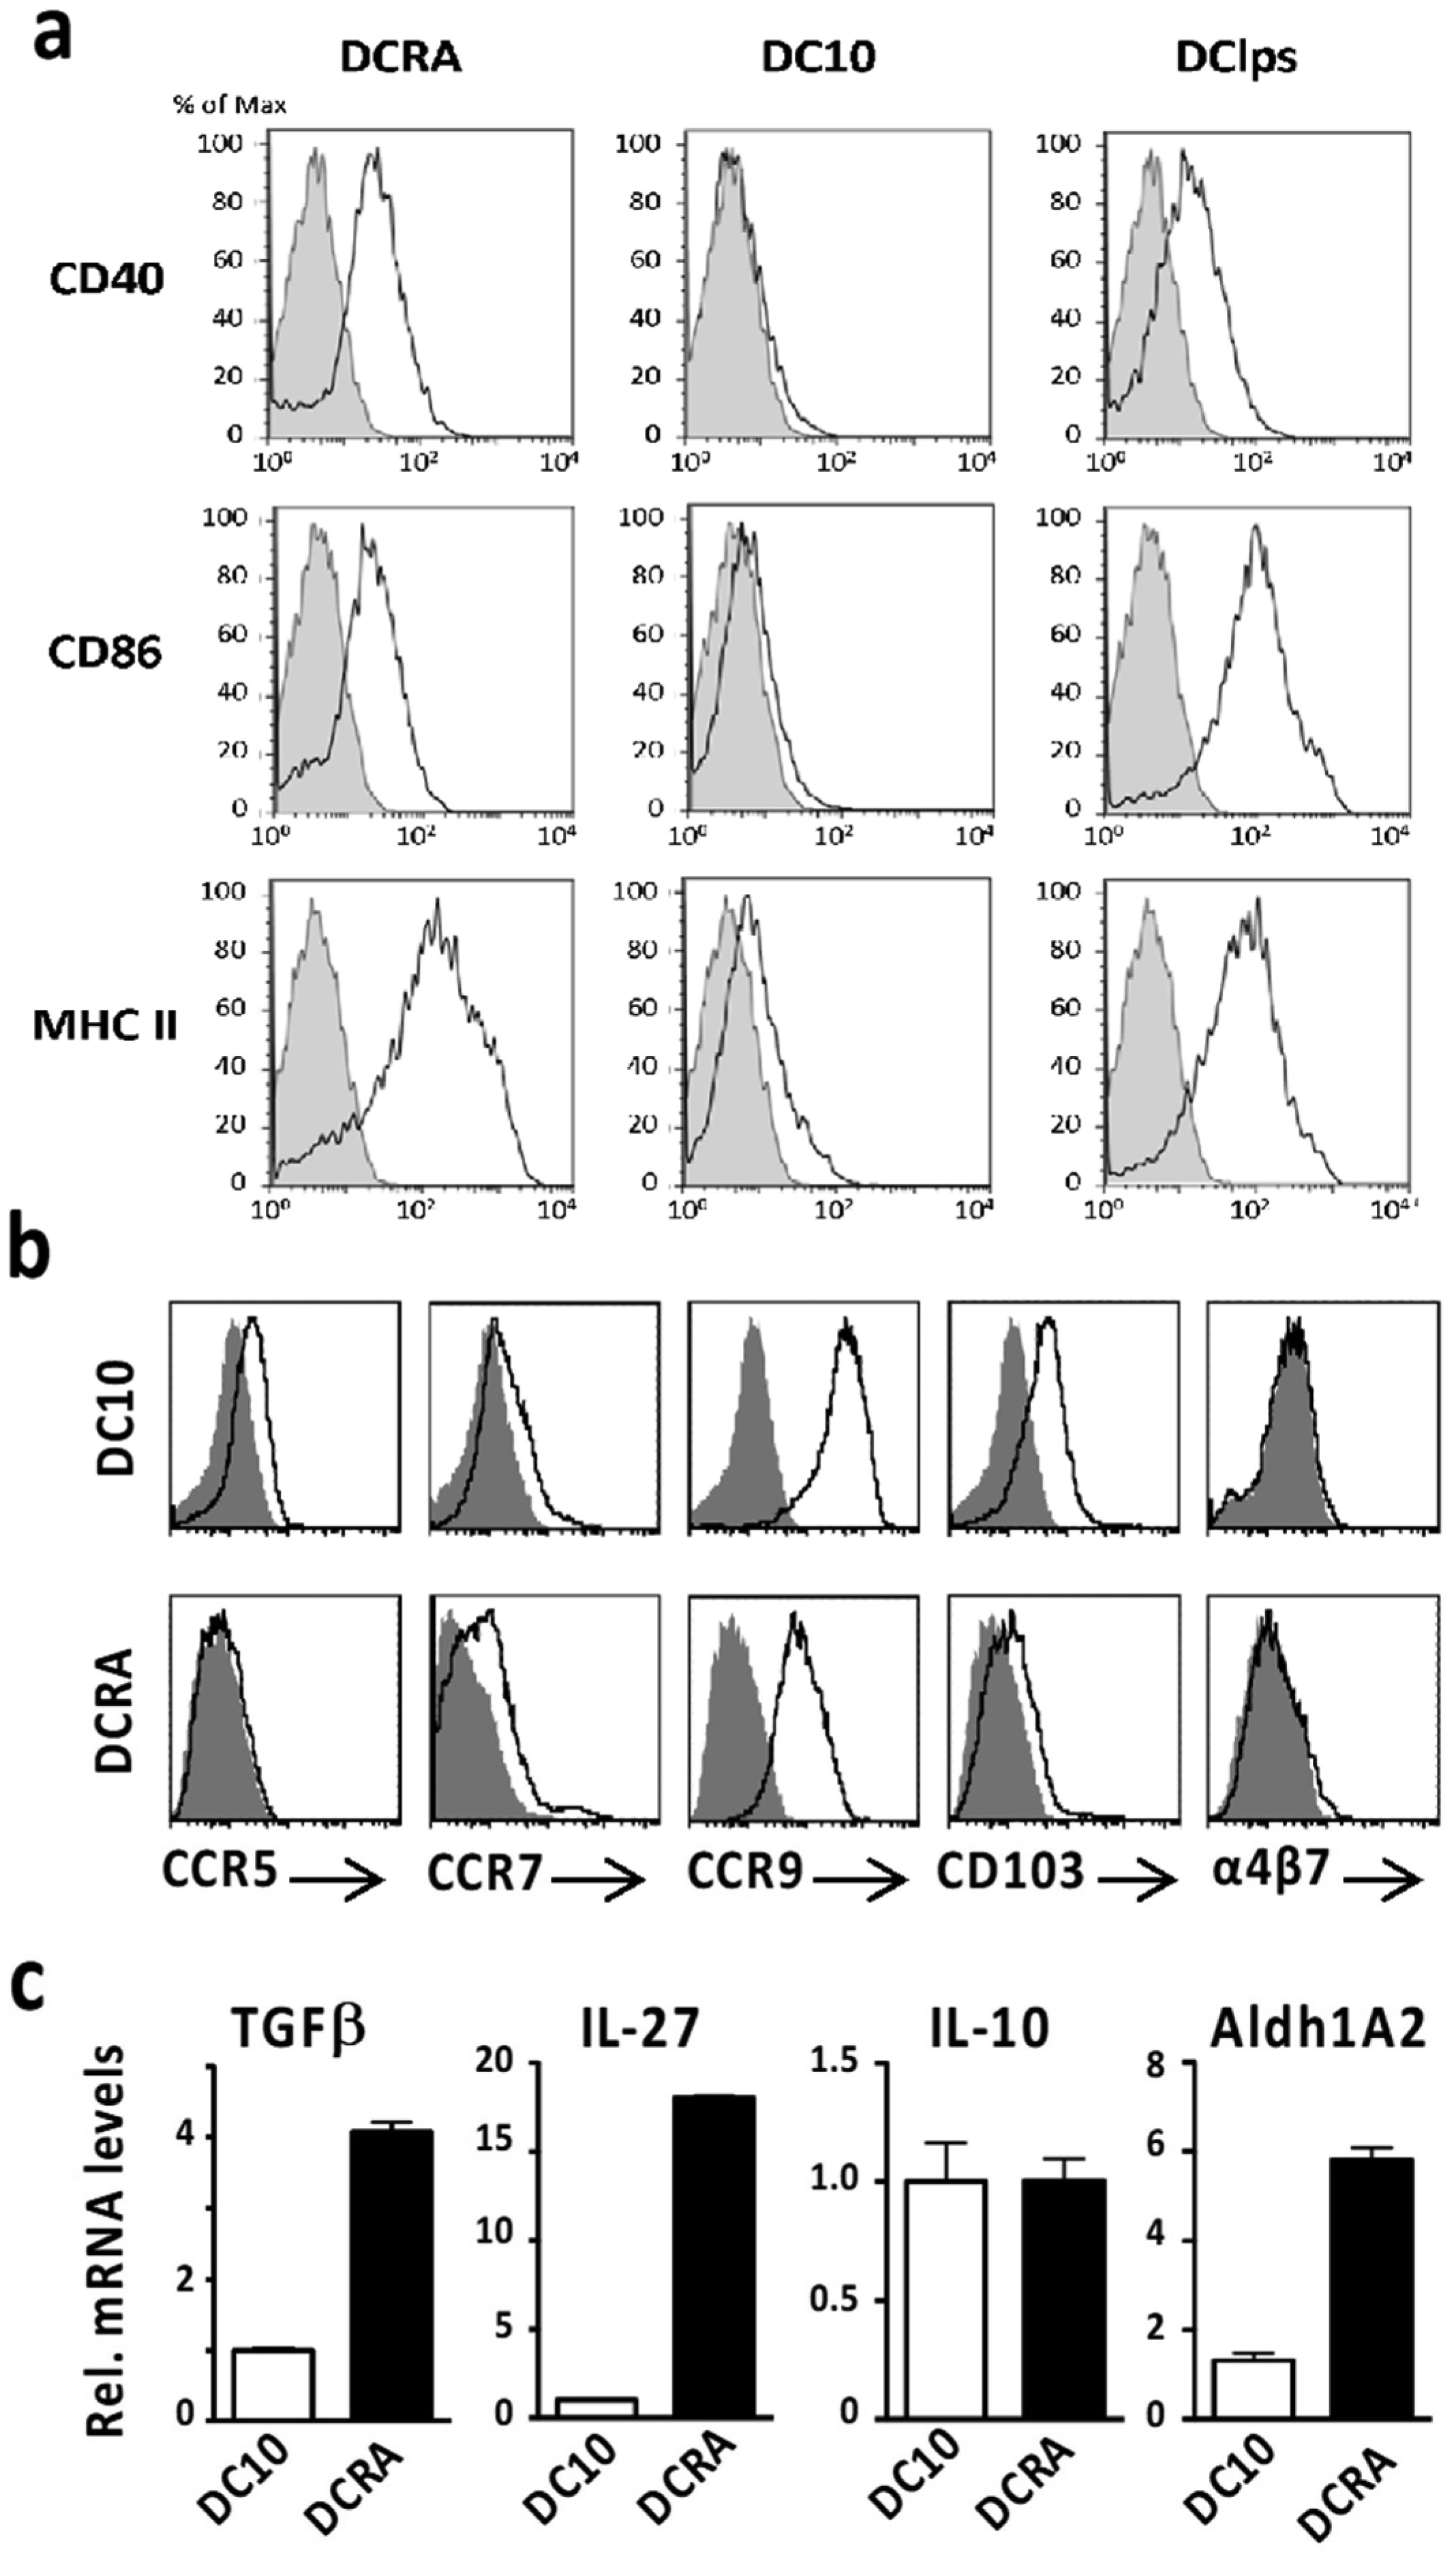
IL-10-induced DC (DC10) secrete IL-10, thereby promoting aeroallergen tolerance by activation of CD25+Foxp3+ Treg, while retinoic acid-induced DC (DC-RA) foster food allergen tolerance via IL-27-dependent induction of Foxp3− Treg. In some respects, these outcomes reflect those seen with aero- or food allergen-presenting lung and intestinal DC, respectively. Herein we asked whether these DCreg would also be functional in their reciprocal settings. DC-RA expressed lower levels of CCR5, CCR9, and CD103 than DC10, but higher levels of CD40, CD86, MHC II, TGF-β, IL-27 and Aldh1A2. DC-RA were also more effective in suppressing OVA-specific T cell proliferation in vitro (p ≤ 0.05). Co-culture of DC10 or DC-RA with OVA-specific T cells activated a regulatory phenotype therein, with the DC-10-induced Treg being modestly more suppressive in vitro than the DC-RA-induced Treg. We previously reported on lung trafficking of DC10, but DC-RA also traffic through the lungs and mediastinal lymph nodes before accumulating in the mesenteric lymph nodes. Both DCreg populations equally reduced airway hyperresponsiveness, Th2 responses (Th2 cytokines, eosinophilia) to airway allergen challenge, and plasma IgE/IgG1 levels in an OVA-asthma model. Similarly, they were equally effective in our OVA-food allergy model, where they reduced clinical scores (p ≤ 0.001), mast cell activation (p ≤ 0.05) and Th2 cytokine responses to allergen challenge, as well as OVA-specific IgE/IgG1 levels (p ≤ 0.01). Taken together, this data indicates that while DC10 and DC-RA employ distinct operative mechanisms, they were both able to induce tolerance in lung- and gut-associated allergic disease.
retinaldehyde 1A2
carboxyfluoryl succinylate ester
CC subfamily chemokine receptor 9
IL-10-skewed tolerogenic dendritic cells
LPS-matured immunostimulatory dendritic cell
retinoic acid-skewed dendritic cells
fetal bovine serum
the transcription factor forkhead box P3
lymphocyte activation gene 3
lipopolysaccaride
mouse mast cell protease-1
ovalbumin
transgenic mice expressing an OVA-specific T cell receptor
regulatory T cell

| [1] |
Gordon JR, Ma Y, Churchman L, et al. (2014) Regulatory dendritic cells for immunotherapy in immunologic diseases. Front Immunol 5: 7. doi: 10.3389/fimmu.2014.00007

|
| [2] |
Weiner HL, da Cunha AP, Quintana F, et al. (2011) Oral tolerance. Immunol Rev 241: 241-259. doi: 10.1111/j.1600-065X.2011.01017.x
|
| [3] |
Dawicki W, Li C, Town J, et al. (2017) Therapeutic reversal of food allergen sensitivity by mature retinoic acid-differentiated dendritic cell induction of LAG3+CD49b−Foxp3− regulatory T cells. J Allergy Clin Immunol 139: 1608-1620. doi: 10.1016/j.jaci.2016.07.042
|
| [4] |
Huang H, Dawicki W, Lu M, et al. (2013) Regulatory dendritic cell expression of MHCII and IL-10 are jointly requisite for induction of tolerance in a murine model of OVA-asthma. Allergy 68: 1126-1135. doi: 10.1111/all.12273
|
| [5] |
Koya T, Matsuda H, Takeda K, et al. (2007) IL-10-treated dendritic cells decrease airway hyperresponsiveness and airway inflammation in mice. J Allergy Clin Immunol 119: 1241-1250. doi: 10.1016/j.jaci.2007.01.039
|
| [6] |
Lu M, Dawicki W, Zhang X, et al. (2011) Therapeutic induction of tolerance by IL-10-differentiated dendritic cells in a mouse model of house dust mite-asthma. Allergy 66: 612-620. doi: 10.1111/j.1398-9995.2010.02526.x
|
| [7] |
Nayyar A, Dawicki W, Huang H, et al. (2012) Induction of prolonged asthma tolerance by IL-10-differentiated dendritic cells: differential impact on airway hyperresponsiveness and the Th2 immunoinflammatory response. J Immunol 189: 72-79. doi: 10.4049/jimmunol.1103286
|
| [8] |
Akbari O, DeKruyff RH, Umetsu DT (2001) Pulmonary dendritic cells producing IL-10 mediate tolerance induced by respiratory exposure to antigen. Nat Immunol 2: 725-731. doi: 10.1038/90667
|
| [9] |
Huang H, Dawicki W, Zhang X, et al. (2010) Tolerogenic dendritic cells induce CD4+ CD25hiFoxp3+ regulatory T cell differentiation from CD4+CD25−/loFoxp3− effector T cells. J Immunol 185: 5003-5010. doi: 10.4049/jimmunol.0903446
|
| [10] |
Bakdash G, Vogelpoel LTC, Van Capel TM, et al. (2015) Retinoic acid primes human dendritic cells to induce gut-homing, IL-10-producing regulatory T cells. Mucosal Immunol 8: 265-278. doi: 10.1038/mi.2014.64
|
| [11] |
Lutz MB, Kukutsch N, Ogilvie AL, et al. (1999) An advanced culture method for generating large quantities of highly pure dendritic cells from mouse bone marrow. J Immunol Methods 223: 77-92. doi: 10.1016/S0022-1759(98)00204-X
|
| [12] | Nayyar A (2009) Therapeutic immunomodulation of allergic lung disease using regulatory dendritic cells in a mouse model of asthma [PhD's thesis] Canada: University of Saskatchewan. |
| [13] |
Gordon JR, Li F, Nayyar A, et al. (2005) CD8 alpha+, but not CD8 alpha−, dendritic cells tolerize Th2 responses via contact-dependent and -independent mechanisms, and reverse airway hyperresponsiveness, Th2, and eosinophil responses in a mouse model of asthma. J Immunol 175: 1516-1522. doi: 10.4049/jimmunol.175.3.1516
|
| [14] |
Schneider AM, Li F, Zhang X, et al. (2001) Induction of pulmonary allergen-specific IgA responses or airway hyperresponsiveness in the absence of allergic lung disease following sensitization with limiting doses of ovalbumin-alum. Cell Immunol 212: 101-109. doi: 10.1006/cimm.2001.1854
|
| [15] |
Glaab T, Daser A, Braun A, et al. (2001) Tidal midexpiratory flow as a measure of airway hyperresponsiveness in allergic mice. Am J Physiol Lung Cell Mol Physiol 280: 565-573. doi: 10.1152/ajplung.2001.280.3.L565
|
| [16] |
Vijayaraghavan R, Schaper M, Thompson R, et al. (1994) Computer assisted recognition and quantitation of the effects of airborne chemicals acting at different areas of the respiratory tract in mice. Arch Toxicol 68: 490-499. doi: 10.1007/s002040050101
|
| [17] |
Li X, Yang A, Huang H, et al. (2010) Induction of Type 2 T helper cell allergen tolerance by IL-10-differentiated regulatory dendritic cells. Am J Resp Cell Molec Biol 42: 190-199. doi: 10.1165/rcmb.2009-0023OC
|
| [18] |
Campbell I (2007) Chi-squared and Fisher–Irwin tests of two-by-two tables with small sample recommendations. Stat Med 26: 3661-3675. doi: 10.1002/sim.2832
|
| [19] |
Huang H, Ma Y, Dawicki W, et al. (2013) Comparison of induced versus natural regulatory T cells of the same TCR specificity for induction of tolerance to an environmental antigen. J Immunol 191: 1136-1143. doi: 10.4049/jimmunol.1201899
|
| [20] |
Dai Z, Zhang S, Xie Q, et al. (2014) Natural CD8+CD122+ T cells are more potent in suppression of allograft rejection than CD4+CD25+ regulatory T cells. Am J Transplant 14: 39-48. doi: 10.1111/ajt.12515
|
| [21] | Yoffey JM, Courtice FC (1970) Lymphatics, Lymph and the Lymphomyeloid Complex London: Academic Press. |
| [22] |
Ruane D, Brane L, Reis BS, et al. (2013) Lung dendritic cells induce migration of protective T cells to the gastrointestinal tract. J Exp Med 210: 1871-1888. doi: 10.1084/jem.20122762
|
| [23] |
Lopez-Pacheco C, Soldevila G, Du Pont G, et al. (2016) CCR9 is a key regulator of early phases of allergic airway inflammation. Mediators Inflamm 2016: 3635809. doi: 10.1155/2016/3635809
|
| [24] |
Yurchenko E, Shio MT, Huang TC, et al. (2012) Inflammation-driven reprogramming of CD4+Foxp3+ regulatory T cells into pathogenic Th1/Th17 T effectors is abrogated by mTOR inhibition in vivo. PLoS One 7: e35572. doi: 10.1371/journal.pone.0035572
|
| [25] | Ness S, Lin S, Gordon JR (2021) Regulatory dendritic cells, T cell tolerance and dendritic cell therapy for immunologic disease. Front Immunol 12: 633436. |
| [26] |
Giannoukakis N, Phillips B, Finegold D, et al. (2011) Phase I (safety) study of autologous tolerogenic dendritic cells in type 1 diabetic patients. Diabetes Care 34: 2026-2032. doi: 10.2337/dc11-0472
|
| [27] |
Bell GM, Anderson AE, Diboll J, et al. (2017) Autologous tolerogenic dendritic cells for rheumatoid and inflammatory arthritis. Ann Rheum Dis 76: 227-234. doi: 10.1136/annrheumdis-2015-208456
|
| [28] |
Jauregui-Amezaga A, Cabezón R, Ramírez-Morros A, et al. (2015) Intraperitoneal administration of autologous tolerogenic dendritic cells for refractory Crohn's disease: a phase I study. J Crohns Colitis 9: 1071-1078. doi: 10.1093/ecco-jcc/jjv144
|
| [29] |
Zubizarreta I, Florez-Grau G, Vila G, et al. (2019) Immune tolerance in multiple sclerosis and neuromyelitis optica with peptide-loaded tolerogenic dendritic cells in a phase 1b trial. Proc Natl Acad Sci USA 116: 8463-8470. doi: 10.1073/pnas.1820039116
|
| [30] | Macedo C, Tran LM, Zahorchak AF, et al. (2020) Donor-derived regulatory dendritic cell infusion results in host cell cross-dressing and T cell subset changes in prospective living donor liver transplant recipients. Am J Transplant In press. |
| [31] |
Thomson AW, Ezzelarab MB (2020) Generation and functional assessment of nonhuman primate regulatory dendritic cells and their therapeutic efficacy in renal transplantation. Cell Immunol 351: 104087. doi: 10.1016/j.cellimm.2020.104087
|


Figures(6)

Chunyan Li, Wojciech Dawicki, Xiaobei Zhang, Chris Rudulier, John R. Gordon. IL-10- and retinoic acid-induced regulatory dendritic cells are therapeutically equivalent in mouse models of asthma and food allergy[J]. AIMS Allergy and Immunology, 2021, 5(2): 73-91. doi: 10.3934/Allergy.2021007


 DownLoad: