Research article Special Issues

Local Spatial Analysis and Dynamic Simulation of Childhood Obesity and Neighbourhood Walkability in a Major Canadian City

  • Received: 15 May 2015 Accepted: 03 September 2015 Published: 08 September 2015
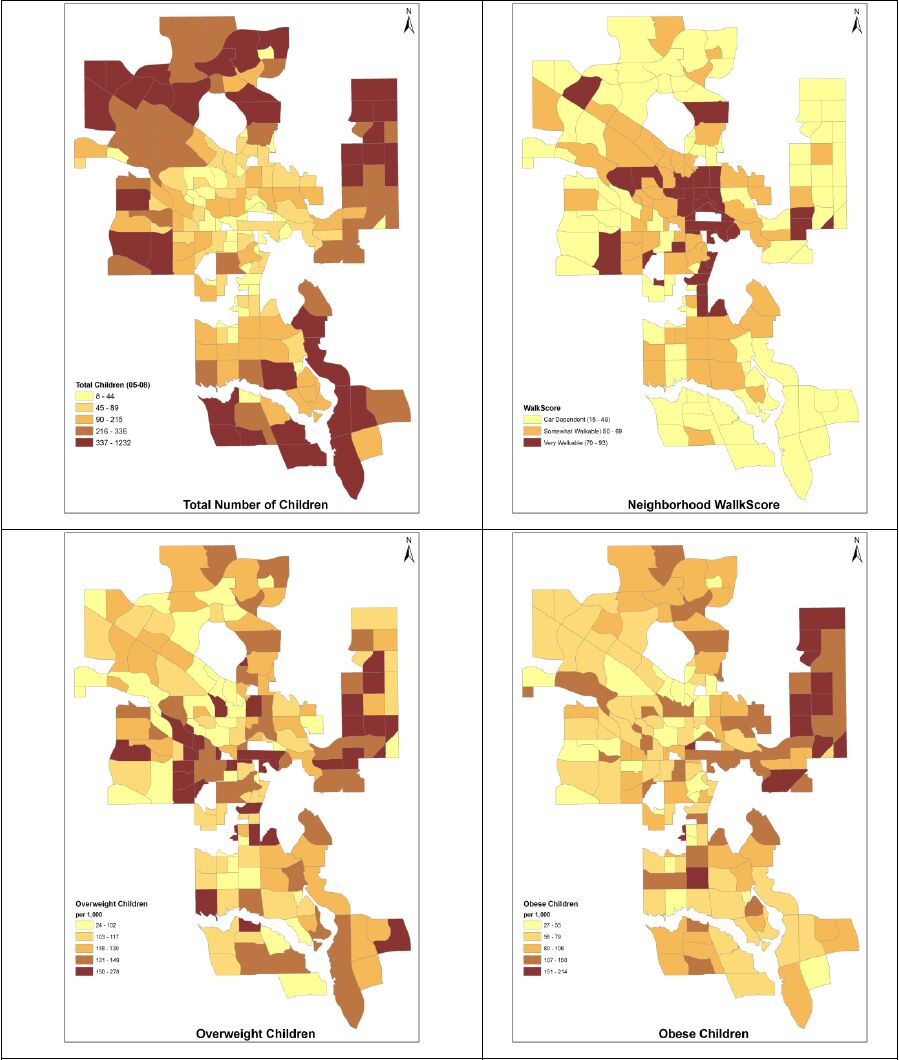
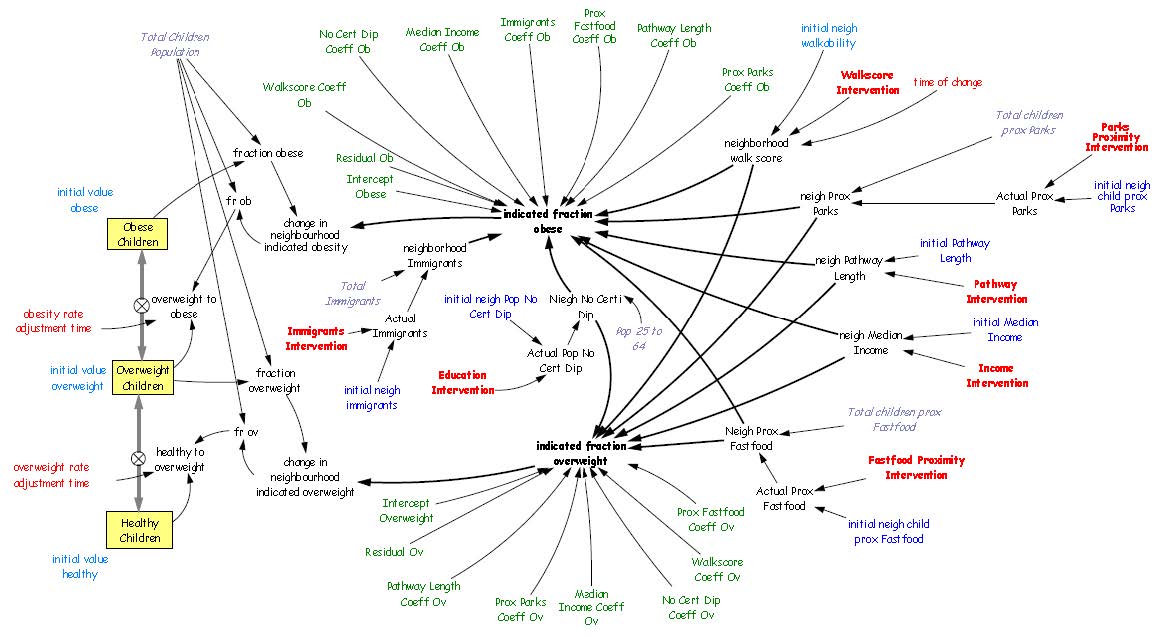
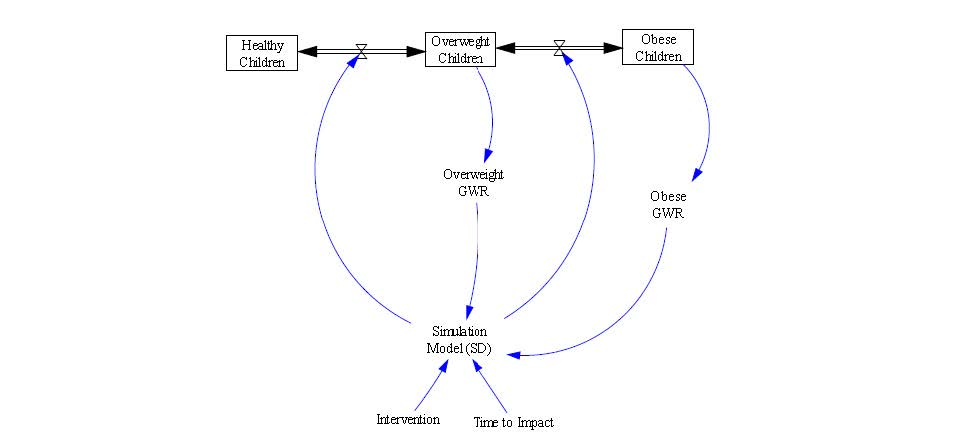
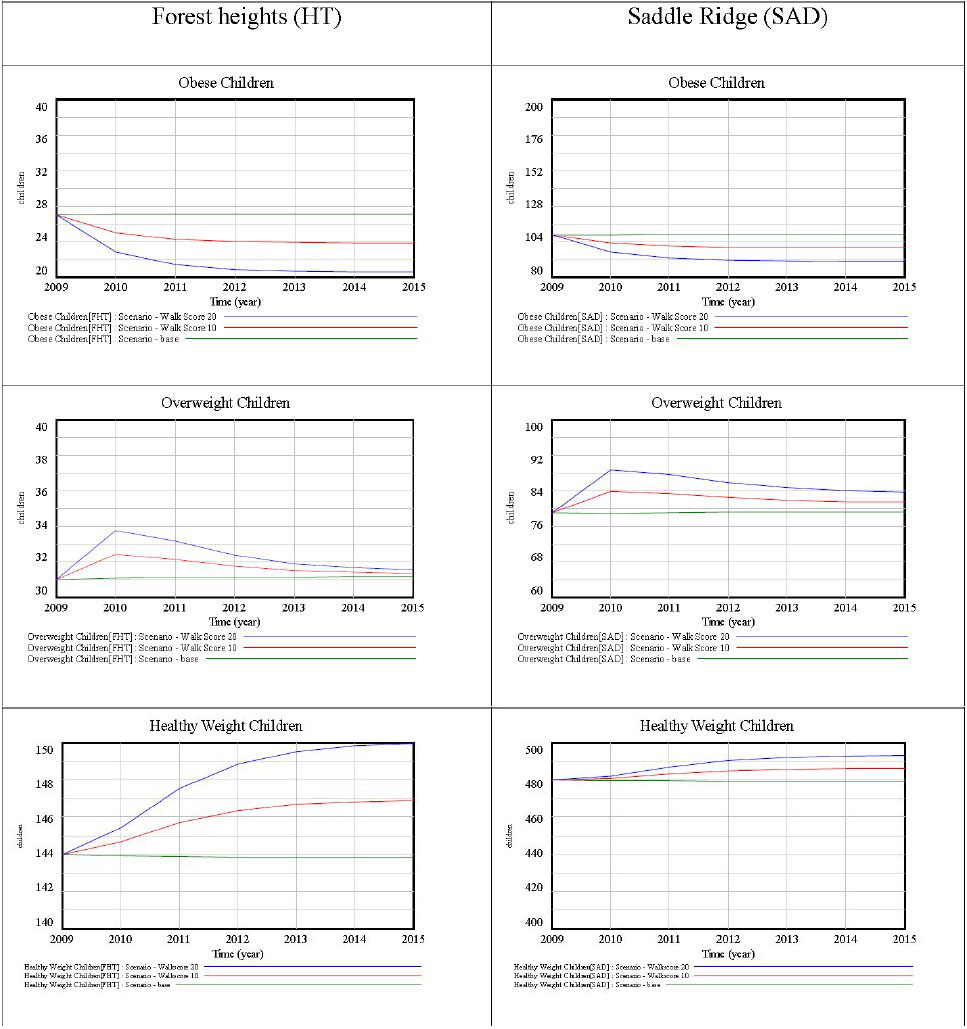
  • Body weight is an important indicator of current and future health and it is even more critical in children, who are tomorrow’s adults. This paper analyzes the relationship between childhood obesity and neighbourhood walkability in Calgary, Canada. A multivariate analytical framework recognizes that childhood obesity is also associated with many factors, including socioeconomic status, foodscapes, and environmental factors, as well as less measurable factors, such as individual preferences, that could not be included in this analysis. In contrast with more conventional global analysis, this research employs localized analysis and assesses need-based interventions. The one-size-fit-all strategy may not effectively control obesity rates, since each neighbourhood has unique characteristics that need to be addressed individually. This paper presents an innovative framework combining local analysis with simulation modeling to analyze childhood obesity. Spatial models generally do not deal with simulation over time, making it cumbersome for health planners and policy makers to effectively design and implement interventions and to quantify their impact over time. This research fills this gap by integrating geographically weighted regression (GWR), which identifies vulnerable neighbourhoods and critical factors for childhood obesity, with simulation modeling, which evaluates the impact of the suggested interventions on the targeted neighbourhoods. Neighbourhood walkability was chosen as a potential target for localized interventions, owing to the crucial role of walking in developing a healthy lifestyle, as well as because increasing walkability is relatively more feasible and less expensive then modifying other factors, such as income. Simulation results suggest that local walkability interventions can achieve measurable declines in childhood obesity rates. The results are encouraging, as improvements are likely to compound over time. The results demonstrate that the integration of GWR and simulation modeling is effective, and the proposed framework can assist in designing local interventions to control and prevent childhood obesity.

    Citation: Rizwan Shahid, Stefania Bertazzon. Local Spatial Analysis and Dynamic Simulation of Childhood Obesity and Neighbourhood Walkability in a Major Canadian City[J]. AIMS Public Health, 2015, 2(4): 616-637. doi: 10.3934/publichealth.2015.4.616

    Related Papers:

    [1] Kevin R Caffrey, Mari S Chinn, Matthew W Veal . Biomass supply chain management in North Carolina (part 1): predictive model for cropland conversion to biomass feedstocks. AIMS Energy, 2016, 4(2): 256-279. doi: 10.3934/energy.2016.2.256
    [2] Hamid Shahandeh, Frank M. Hons, Jason P. Wight, Joseph O. Storlien . Harvest strategy and N fertilizer effects on bioenergy sorghum production. AIMS Energy, 2015, 3(3): 377-400. doi: 10.3934/energy.2015.3.377
    [3] Hamid Shahandeh, Frank M. Hons, Joseph O. Storlien, Jason P. Wight . Long-term bioenergy sorghum harvest strategy and soil quality. AIMS Energy, 2016, 4(4): 633-657. doi: 10.3934/energy.2016.4.633
    [4] Javier Sánchez, María Dolores Curt, Marina Sanz, Jesús Fernández . A proposal for pellet production from residual woody biomass in the island of Majorca (Spain). AIMS Energy, 2015, 3(3): 480-504. doi: 10.3934/energy.2015.3.480
    [5] Bimal Acharya, Ranjan R. Pradhan, Animesh Dutta . Qualitative and kinetic analysis of torrefaction of lignocellulosic biomass using DSC-TGA-FTIR. AIMS Energy, 2015, 3(4): 760-773. doi: 10.3934/energy.2015.4.760
    [6] S. Vinoth John Prakash, P.K. Dhal . Cost optimization and optimal sizing of standalone biomass/diesel generator/wind turbine/solar microgrid system. AIMS Energy, 2022, 10(4): 665-694. doi: 10.3934/energy.2022032
    [7] Leonel J. R. Nunes . Potential exportation of wood pellets and torrefied biomass pellets logistics cost analysis: A comparative case study from Portugal. AIMS Energy, 2024, 12(1): 45-61. doi: 10.3934/energy.2024003
    [8] Giorgio Guariso, Fabio de Maria . Economic feasibility of a wood biomass energy system under evolving demand. AIMS Energy, 2016, 4(1): 104-118. doi: 10.3934/energy.2016.1.104
    [9] Gustavo Aguilar, Pranjali D. Muley, Charles Henkel, Dorin Boldor . Effects of biomass particle size on yield and composition of pyrolysis bio-oil derived from Chinese tallow tree (Triadica Sebifera L.) and energy cane (Saccharum complex) in an inductively heated reactor. AIMS Energy, 2015, 3(4): 838-850. doi: 10.3934/energy.2015.4.838
    [10] Juan A. Conesa, A. Domene . Synthesis gas production from various biomass feedstocks. AIMS Energy, 2013, 1(1): 17-27. doi: 10.3934/energy.2013.1.17
  • Body weight is an important indicator of current and future health and it is even more critical in children, who are tomorrow’s adults. This paper analyzes the relationship between childhood obesity and neighbourhood walkability in Calgary, Canada. A multivariate analytical framework recognizes that childhood obesity is also associated with many factors, including socioeconomic status, foodscapes, and environmental factors, as well as less measurable factors, such as individual preferences, that could not be included in this analysis. In contrast with more conventional global analysis, this research employs localized analysis and assesses need-based interventions. The one-size-fit-all strategy may not effectively control obesity rates, since each neighbourhood has unique characteristics that need to be addressed individually. This paper presents an innovative framework combining local analysis with simulation modeling to analyze childhood obesity. Spatial models generally do not deal with simulation over time, making it cumbersome for health planners and policy makers to effectively design and implement interventions and to quantify their impact over time. This research fills this gap by integrating geographically weighted regression (GWR), which identifies vulnerable neighbourhoods and critical factors for childhood obesity, with simulation modeling, which evaluates the impact of the suggested interventions on the targeted neighbourhoods. Neighbourhood walkability was chosen as a potential target for localized interventions, owing to the crucial role of walking in developing a healthy lifestyle, as well as because increasing walkability is relatively more feasible and less expensive then modifying other factors, such as income. Simulation results suggest that local walkability interventions can achieve measurable declines in childhood obesity rates. The results are encouraging, as improvements are likely to compound over time. The results demonstrate that the integration of GWR and simulation modeling is effective, and the proposed framework can assist in designing local interventions to control and prevent childhood obesity.


    Consumption of fresh vegetables has increased worldwide as a result of their nutritional value and the growing interest of consumers for a healthy diet [1]. There is a variety of these produce, including conventional (non-organic) and organic fresh vegetables. Organic farming implies a very limited use of chemical fertilizers and synthetic pesticides, as well as the absence of routine administration of growth hormones and antibiotics to livestock [2]. For these reasons, consumption of organic fresh produce is continuously gaining preference among consumers during last decades, and consequently organic farming has been also proportionally increased. Besides, to facilitate consumption of fresh produce, a variety of them is marketed in a ready-to-eat form that does not require any additional sanitizing process prior to consumption (fresh-cut vegetables) [3,4].

    During last decades the foodborne outbreaks due to consumption of fresh produce has also increased, most of them associated to bacterial (mainly to species belonging to the Enterobacteriaceae family) contamination [5,6,7]. Fresh vegetables contain non-pathogenic epiphytic bacteria, and can be contaminated with pathogenic and non-pathogenic bacteria from human and animal sources at any step from farm (growth and harvest) to the consumers [8,9,10,11]. An important source of contamination is the use of manure and irrigation water that can incorporate bacteria from animal and/or human origin to soil and vegetables [12,13,14,15]. We have previously described that fresh vegetables marketed in Valencia (Spain) harbor at high frequency non-pathogenic Enterobacteriaceae species belonging to genera Enterobacter (mainly E. cloacae) and Klebsiella, and that Enterobacteriaceae species are also found in samples of organic produce [16,17,18].

    A significant concern derived from the presence of enterobacteria in fresh vegetables is related to the antibiotic resistances, as Enterobacteriaceae isolates from fresh produce are often resistant to antibiotics [19,20,21]. Most enterobacteria isolates from fresh vegetables from Valencia are resistant to penicillins (amoxillin/clavulanic and ampicillin) and in a minor extent to other antibiotics [16,17]. Antibiotic resistant bacteria in fresh vegetables can arise from the use of antibiotics in husbandry (through manure and contaminated irrigation water) and plant agriculture, which either can incorporate resistant bacteria into vegetables or select resistance in vegetable microbiota [12,13,14,15]. In addition, the fact that fresh vegetables are often eaten raw points another issue: ingestion of antibiotic resistant enterobacteria by the consumer may result in the transmission of resistances to other commensal or pathogenic gut microbiota through horizontal mechanisms of gene transfer [20,21,22,23]. It should be noted that enterobacteria from fresh produce may, at least transiently, colonize the gastrointestinal tract, a niche considered as a hot spot for gene transfer among bacteria [24]. We have previously qualified this process as a silent food safety concern [16], which may contribute to disseminate antibiotic resistances within the community and to agammaavate the increasing problem of the antibiotic resistance in Gram-negative bacteria both in hospital settings and in the community [25,26].

    Therefore, it seems relevant to compare the presence of enterobacteria in different fresh vegetable produce (conventional, organic, and fresh-cut and prepared salads), their identification at the species level and the determination of their antibiotic resistances, in order to find out any differences among types of samples related with their hygienic quality and safety for consumers; so in this work we have extended our former studies to a higher number of bacterial species and fresh vegetable types (above cited) and compiled all data in order to show a comparison among them.

    Samples (n: 230) (carrot, ruccola/arugula and various lettuce and tomato types) of conventional vegetables (n: 90) and fresh-cut vegetables (conventionally grown) (n: 60) were purchased from supermarkets and retail greengrocers in the city of Valencia, and organic produce (n: 50) were purchased in retail greengrocers specialized in produce grown in the area of Valencia. All samples were purchased in bulk, except fresh-cut vegetables that were purchased in unit packets. Prepared salads (n: 30) were obtained from the daily menu of primary schools and restaurants in the city of Valencia.

    All microbiological procedures were performed according to standard methods as described elsewhere [16,17,18]. Briefly, selected portions of each sample (2–5 g) were homogenized in a Classic Masticator for 1 min at room temperature. In the case of salads, parts all ingredients were taken to obtain the homogenates. Serial dilutions (10-1, 10-2 and 10-3) were used to determine the most probably number of coliform bacteria/g (MPN) by growth and gas formation following 24–48 h incubation in Brilliant Green Bile Lactose Broth (BGBL) (Conda, Spain); the detection limits of the method range between < 3 and > 2400 coliforms/g. Single colonies were isolated by plating on selective EMB Levine agar (Liofilchem, Italy) and incubation for 24 h at 37 ℃. Identification of isolates at the species level was performed by biochemical test using the BBL Crystal E/NF identification system (Becton Dickinson, USA) according to the instructions and software provided by the manufacturer. In order to quantify the diversity of bacterial species isolated from each vegetable type, we calculated the diversity ratio (DR), defined as ratio between the number of the different species identified and the total number of isolates (the maximum theoretical value of DR is one, which indicates that each isolate belongs to a different species).

    Determination of antibiotic susceptibility was performed by disk diffusion-based tests according to standard microbiological procedures previously described [16,17,18]. Eleven chemotherapeutic agents (most of them antibiotics) commonly used against Gram-negative bacteria were tested: amoxicillin/clavulanic, ampicillin, cefotaxime, ceftazidime, ciprofloxacin, chloramphenicol, cotrimoxazole, streptomycin, gentamicin, nitrofurantoin, and tetracycline (Liofilchem, Italy). Two indexes have been used to show the antibiotic resistance level of each bacterial species: the resistance index 11 (RI11) that indicates the average absolute number of resistances to the eleven antibacterial agents tested (with values ranging between 0 and 11), and the relative resistance index (RRI) defined as the ratio RI11/11 (with values ranging between 0 and 1).

    Results of a total of 200 vegetable samples were compared in this study, as well as 30 prepared salads. The coliform burden of all vegetable samples was determined as an indicator of their hygienic quality, as coliforms include Enterobacteriaceae species (mainly belonging to the genera Enterobacter, Klebsiella, Escherichia and Serratia) widely distributed in nature, including vegetables epiphytic bacteria and enterobacteria of the gastrointestinal tract of mammals. Results (Table 1) showed that fresh vegetables were the most contaminated, compared to conventional and organic produce, looking at both negative results and samples with high coliform burden. Prepared salads showed the highest levels of coliform burden, result that is not surprising as the analyzed samples of salads contained various vegetables ingredients and their preparation requires greater manipulation.

    Table 1.  Coliform burden in vegetables samples from different source.
    MPN Conventional (n: 90) Organic (n: 50) Fresh-cut (n: 60) Prepared salads (n: 30)
    < 3 52 (57.8%) 23 (46%) 15 (25%) 3 (10%)
    3–1100 27 (30%) 25 (50%) 33 (55%) 19 (63.4%)
    > 2400 11 (12.2%) 2 (4%) 12 (20%) 8 (26.6%)

     | Show Table
    DownLoad: CSV

    The identified bacterial species in each type of fresh produce are shown in Tables 2 and 3. The methodology used for bacterial isolation allowed the identification of coliforms as well as other non- coliform Enterobacteriaceae and other Gram-negative species that are able to growth in BGBL cultures. Coliform isolates were the most frequently identified in all samples (67–85%), except in organic fresh vegetables, where most frequent isolates corresponded to non-coliform Enterobacteriaceae species (62%). A low proportion of non-Enterobacteriaceae Gram-negative isolates were only found in conventional, and particularly in fresh-cut vegetables. The average number of isolates per sample was similar in conventional and organic vegetables (0.69 and 0.74, respectively), and higher in fresh-cut and prepared salads (1.05 and 1.10, respectively); these results suggest that a greater manipulation of the produce represents a greater risk of contamination and therefore is associated with a higher number of isolates (Table 2).

    Table 2.  Types of bacterial isolates in fresh vegetables.
    Type of isolate Number of bacterial isolates in vegetable samples (%)*
    Conventional Organic Fresh-cut Prepared salads
    Coliforms 50 (80.6%) 14 (37.8%) 42 (66.7%) 29 (84.8%)
    Non-coliform Enterobacteriaceae 10 (16.1%) 23 (62.1%) 15 (23.8%) 4 (15.1%)
    Other Gram-negative species 2 (3.2%) nd 6 (9.5%) nd
    All types 62 37 63 33
    Note: *nd: not detected.

     | Show Table
    DownLoad: CSV
    Table 3.  Bacterial species isolated from fresh vegetables.
    Bacterial species Number of isolates in vegetable samples (%)*
    Conventional Organic Fresh-cut Prepared salads
    Enterobacter cloacae 29 (46.7%) 5 (13.5%) 29 (46.0%) 13 (39.3%)
    Klebsiella oxytoca 13 (20.9%) 2 (5.4%) 1 (1.6%) 9 (27.2%)
    Pantoea agglomerans 5 (8.1%) 9 (24.3%) 1 (1.6%) 2 (6.1%)
    Serratia marcescens 2 (3.2%) 6 (16.2%) 3 (4.7%) 1 (3.0%)
    Klebsiella pneumoniae 6 (9.6%) 1 (2.7%) 4 (6.3%) nd
    Cronobacter sakazakii nd 2 (5.4%) 5 (7.9%) 1 (3.0%)
    Citrobacter freundii nd nd 3 (4.7%) 3 (9.1%)
    Klyuvera ascorbata 2 (3.2%) 1 (2.7%) 2 (3.2%) 1 (3.0%)
    Enterobacter aerogenes nd 3 (8.1%) 2 (3.2%) nd
    Enterobacter cancerogenus nd 2 (5.4%) nd 2 (6.1%)
    Escherichia coli 2 (3.2%) nd 1 (1.6%) 1 (3.0%)
    Flavimonas oryzihabitans nd nd 4 (6.3%) nd
    Hafnia alvei nd 2 (5.4%) 2 (3.2%) nd
    Enterobacter gergoviae nd nd 2 (3.2%) nd
    Kluyvera cryocrescens nd 2 (5.4%) nd nd
    Pseudomonas putida nd nd 2 (3.2%) nd
    Serratia plymuthica nd nd 2 (3.2%) nd
    Acinetobacter baumanii 1 (1.6%) nd nd nd
    Escherichia vulneris nd 1 (2.7%) nd nd
    Leclercia adecarboxylata nd 1 (2.7%) nd nd
    Serratia rubidaea 1 (1.6%) nd nd nd
    Stenotrophomonas maltophilia 1 (1.6%) nd nd nd
    TOTAL 62 37 63 33
    DR (diversity ratio) 0.16 0.35 0.24 0.27
    Note: *nd: not detected.

     | Show Table
    DownLoad: CSV

    The species most frequently isolated from conventional, fresh-cut vegetables and salads was Enterobacter cloacae, whereas in organic produce it was Pantoea agglomerans, a non-coliform Enterobacteriaceae species; the second most frequent species were Klebsiella oxytoca in conventional vegetables and salads, Serratia marcescens and E. cloacae in organic samples, and Klebsiella pneumoniae, Cronobacter sakazakii and Flavimonas orizyhabitans in fresh-cut produce (Table 3). Looking at the diversity of the isolates, the lower diversity ratio was observed in conventional fresh vegetables (DR: 0.16), followed by fresh-cut vegetables (DR: 0.24), and organic produce (DR: 0.35), whereas salads had an intermediate value (DR: 0.27).

    When grouped by genera, Enterobacter and Klebsiella spp. represented roughly 60–77% of isolates from conventional, fresh-cut vegetables and prepared salads (about 50% corresponding to Enterobacter spp.), although the percentage of Klebsiella spp. was lower in fresh-cut vegetables (8%) than in samples of conventional and prepared salads (roughly 30%). In organic produce Enterobacter spp. represented 27% of isolates, whereas only 8% belonged to Klebsiella spp. Other genera, as Pantoea and Serratia represented 40% of isolates in organic produce (Table 4). Isolates belonging to non-Enterobacteriaceae species such as Flavimonas (F. orizyhabitans) and Pseudomonas (Ps. putida) were only found in fresh-cut samples.

    Table 4.  Bacterial species isolated from fresh vegetables, grouped by genera.
    Genus Number of isolates in vegetable samples (%)*
    Conventional Organic Fresh-cut Prepared salads
    Enterobacter 29 (46.7%) 10 (27.0%) 33 (52.4%) 16 (48.5%)
    Klebsiella 19 (30.6%) 3 (8.1%) 5 (7.9%) 9 (27.3%)
    Pantoea 5 (8.1%) 9 (24.3%) 1 (1.6%) 2 (6.1%)
    Serratia 3 (4.8%) 6 (16.2%) 5 (7.9%) 1 (3.0%)
    Kluyvera 2 (3.2%) 3 (8.1%) 2 (3.2%) 1 (3.0%)
    Cronobacter nd 2 (5.4%) 5 (7.9%) nd
    Citrobacter nd nd 3 (4.8%) 3 (9.1%)
    Escherichia 2 (3.2%) 1 (2.7%) 1 (1.6%) 1 (3.0%)
    Flavimonas nd nd 4 (6.3%) nd
    Hafnia nd 2 (5.4%) 2 (3.8%) nd
    Pseudomonas nd nd 2 (3.8%) nd
    Acinetobacter 1 (1.6%) nd nd nd
    Leclercia nd 1 (2.7%) nd nd
    Stenotrophomonas 1 (1.1%) nd nd nd
    Note: *nd: not detected.

     | Show Table
    DownLoad: CSV

    Taken together these results indicate that organic vegetables contain a different pattern of bacterial burden, as compared with conventional fresh produce. These differences may arise from the distinct farming practices, as both type of samples are mostly grown in the same geographical area. Furthermore, diversity of bacterial burden in organic produce was the highest among all sample types, probably due to the limited use of chemical fertilizers and synthetic pesticides/antibiotics in organic farming practice [2,27], which may allow the growth of non-resistant bacteria, whereas the use of pesticides and antibiotics in conventional farming may reduce bacterial diversity. Besides, fresh-cut vegetables showed bacterial burdens and bacterial diversity higher than conventional fresh produce, despite to be ready for consumption. Bacteria possess mechanisms for adhesion to vegetable surfaces, which make inefficient the washing/sanitizing methods to remove/inactivate bacteria, and manipulation of vegetables to obtain fresh-cut produce is an additional risk of contamination [4,6,8,10,28]; besides when they are cut, bacteria can enter into vegetable damaged tissues and access to nutrient molecules that favor bacterial proliferation and limit the efficacy of conventional sanitizing methods [3,4,29,30]. Results of prepared salads indicate that vegetable ingredients maintain a significant bacterial burden that is ingested by the consumer, showing the inefficiency of tap water washing methods for bacterial removal at home [31], and their bacterial content and diversity suggest that the salads analyzed in this study were prepared probably using mostly conventional produce. Furthermore, most of the identified isolates belonged to opportunist pathogenic species, and therefore their presence in fresh vegetables may be regarded as a potential risk for the immunocompromised or debilitated consumers, and a source for cross-contaminating other foods at home. In summary, our results, together with other reports, support the question raised by Vestrheim et al. [32]: “are ready-to-eat salads ready to eat?” and point to the need of better methods to diminish the bacterial content of these produce [4,9,10,30].

    Next, resistance to eleven chemotherapeutic agents was determined in all isolates. Results of resistances in isolates from each vegetable type are shown in Table 5. Only a low percentage of isolates showed no resistances in all cases (9.5–13.5%). Most isolates from each vegetable type were resistant to ampicillin (64–85 %) and amoxicillin/clavulanic (70–77%, except in the case of organic produce, were about 40% of isolates were resistant). Resistance to cephalosporins was detected at very low frequency (0–3%), except for resistance to cefotaxime in isolates from organic produce (11%). Resistance to nitrofurantoin was relatively frequent, and higher in isolates from organic and fresh-cut vegetables (16% and 19% of resistant isolates, respectively) than in conventional and prepared salads (8% and 6%, respectively). Resistance to tetracycline was also found, particularly in conventional produce (11% of resistant isolates) as compared to other vegetable types (roughly 3–5% of resistance). Resistance to other chemotherapeutic agents was also very low in most cases (roughly between 0–3%), particularly to ciprofloxacin (0% for all vegetable types). The differences in the resistance patterns between isolates from conventional and organic produce may be caused, at least partially, by the differences in the bacterial species isolated from both produce, above described. Remarkably, all isolates from organic vegetable showed no resistances to 5 out the 11 antibacterial agents tested, whereas isolates from conventional produce showed no resistances only to two agents. These results suggest that organic farming practices may have a relative but significant effect in avoiding selection of resistant bacteria. The resistence pattern of isolates from fresh-cut vegetables and salads resembles that of conventional produce, with some exceptions above cited.

    Table 5.  Resistance to chemotherapeutic agents in isolates from each fresh vegetable type.
    Chemotherapeutic agent Number of resistant isolates (%)
    Conventional (n: 62) Organic (n: 37) Fresh-cut (n: 63) Prepared salads (n: 33)
    Ampicillin 53 (85.0%) 31 (83.7%) 41 (65.0%) 21 (63.6%)
    Amoxicillin/clavulanic 48 (77.4%) 15 (40.5%) 46 (73.0%) 23 (69.6%)
    Cefotaxime 1 (1.6%) 4 (10.8%) 2 (3.1%) 0
    Ceftazidime 0 0 1 (1.5%) 0
    Ciprofloxacin 0 0 0 0
    Chloramphenicol 1 (1.6%) 0 0 0
    Cotrimoxazole 2 (3.2%) 0 0 1 (3.0%)
    Streptomycin 1 (1.6%) 0 2 (3.1%) 0
    Gentamicin 1 (1.6%) 1 (2.7%) 0 0
    Nitrofurantoin 5 (8.0%) 6 (16.2%) 12 (19.0%) 2 (6.0%)
    Tetracycline 7 (11.2%) 2 (5.2%) 3 (4.7%) 1 (3.0%)
    None 7 (11.2%) 5 (13.5%) 6 (9.5%) 4 (12.1%)

     | Show Table
    DownLoad: CSV

    Multi-resistances to more than one chemotherapeutic agents in isolates from each type of fresh produce are shown in Table 6. Comparison among vegetable types does not reveal evident differences. Almost 80% of isolates from conventional produce were resistant to more than one chemotherapeutic agent, a value higher than in other vegetable types: fresh-cut produce (54%), salads (52%) and particularly organic produce (43%). Resistance to two agents was the most frequently observed in isolates from all vegetable types (almost 60% in conventional produce), except for organic produce, where most isolates showed only one resistance (43%). Percentages of multi-resistant isolates to 3–4 agents were similar in all produce types (about 16%), except in prepared salads (6%), and only two isolates were resistant to five antibacterial agents (one from conventional vegetables and another one from fresh-cut produce). Comparison of the RI11 and RRI values indicates a higher levels of resistance in isolates from conventional produce compared to organic vegetables; fresh-cut vegetables showed intermediate values between conventional and organic vegetables, and isolates from salads had the lower values. These results again suggest a higher level of resistance in isolates from conventional produce, supporting the notion that organic farming may contribute to diminish selection and spreading of resistant bacteria. Results concerning resistant isolates from salads were intermediate between conventional, organic and fresh-cut produce, and the absence of multi-resistant isolates to 4–5 agents (probably due to the lower number of samples/isolates analyzed) accounts for lower RI11 and RRI values.

    Table 6.  Multi-resistance to chemotherapeutic agents in isolates from each fresh vegetable type.
    Number of resistances Number of resistent isolates (%)
    Conventional (n: 62) Organic (n: 37) Fresh-cut (n: 63) Prepared salads (n: 33)
    0 7 (11.3 %) 5 (13.5%) 6 (9.5%) 4 (12.1%)
    1 7 (11.3%) 16 (43.2%) 22 (34.9%) 12 (36.4%)
    2 37 (59.7%) 10 (27.0%) 23 (36.5%) 15 (45.4%)
    3 7 (11.3%) 1 (2.7%) 8 (12.7%) 2 (6.1%)
    4 3 (4.8%) 5 (13.5%) 3 (4.8%) 0
    5 1 (1.6%) 0 1 (1.6%) 0
    RI11 1.91 1.59 1.73 1.45
    RRI 0.173 0.138 0.157 0.132

     | Show Table
    DownLoad: CSV

    Multi-resistances to chemotherapeutic agents in bacterial species isolated from fresh vegetables, grouped by resistance patterns, are shown in Table 7. The 13 multi-resistant isolates to 4-5 agents belonged to E. cloacae (5 isolates), S. marcescens (2 isolates), K. pneumoniae, C. freundii, Cr. sakazakii, P. agglomerans and A. baumanii (one isolate each) species, including isolates from conventional, fresh-cut and organic vegetables (see Table 6).

    Table 7.  Multi-resistance to chemotherapeutic agents in bacterial species isolated from fresh vegetables.
    Bacterial species (Total isolates) Number of resistances (%) RI11 RRI
    0 1 2 3 4 5
    E. cloacae (n: 76) 5 (6.6%) 5 (6.6%) 49 (64.5%) 12 (15.8%) 3 (3.9%) 2 (2.6%) 2.12 0.192
    K. oxytoca (n: 25) 2 (8.0%) 10 (40.0%) 12 (48.0%) 1 (4.0%) 0 0 1.48 0.134
    P. agglomerans (n: 17) 5 (29.4%) 8 (47.0%) 3 (17.6%) 0 1 (5.9%) 0 1.05 0.095
    S. marcescens (n: 12) 3 (25.0%) 4 (33.3%) 3 (25.0%) 0 2 (16.7%) 0 1.50 0.136
    K. pneumoniae (n: 11) 0 4 (36.3%) 5 (45.4%) 1 (9.1%) 1 (9.1%) 0 1.91 0.173
    Cr. sakazakii (n: 8) 1 (12.5%) 5 (62.5%) 1 (12.5%) 0 1 (12.5%) 0 1.37 0.124
    C. freundii (n: 6) 0 3 (50.0%) 2 (33.3%) 0 1 (16.7%) 0 1.83 0.166
    Kl. ascorbata (n: 6) 0 4 (66.7%) 2 (33.3%) 0 0 0 1.33 0.121
    E. aerogenes (n: 5) 0 3 (60.0%) 2 (40.0%) 0 0 0 1.40 0.127
    E. cancerogenus (n: 4) 1 (25.0%) 3 (75.0%) 0 0 0 0 0.75 0.068
    E. coli (n: 4) 1 (25.0%) 2 (50.0%) 1 (25.0%) 0 0 0 1.00 0.091
    F. oryzihabitans (n: 4) 0 1 (25.0%) 0 2 (50.0%) 1 (25.0%) 0 2.75 0.250
    H. alvei (n: 4) 0 1 (25.0%) 2 (50.0%) 1 (25.0%) 0 0 2.00 0.182
    E. gergoviae (n: 2) 2 (100%) 0 0 0 0 0 0 0
    Kl. cryocrescens (n: 2) 0 1 (50.0%) 1 (50.0%) 0 0 0 1.50 0.136
    Ps. putida (n: 2) 0 0 2 (100%) 0 0 0 2.00 0.182
    S. plymuthica (n: 2) 0 2 (100%) 0 0 0 0 1.00 0.091
    A. baumannii (n: 1) 0 0 0 0 1 (100%) 0 4.00 0.363
    E. vulneris (n: 1) 0 1 (100%) 0 0 0 0 1.00 0.091
    L. adecarboxylata (n: 1) 1 (100%) 0 0 0 0 0 0 0
    S. rubidaea (n: 1) 0 0 0 1 (100%) 0 0 3.00 0.273
    St. maltophilia (n: 1) 1 (100%) 0 0 0 0 0 0 0

     | Show Table
    DownLoad: CSV

    The significance of the resistance indexes should be considered only for species with the higher amount of isolates; comparison of RI11 and RRI among species with more than 10 isolates indicates that the highest values of RRI corresponded to E. cloacae (0.192), and K. pneumoniae (0.173), followed by S. marcescens and K. oxytoca (0.136 and 0.134, respectively), and the lowest value was found for P. agglomerans isolates (0.095).

    The presence of antibiotic-resistant bacteria in produce that are often eaten raw points out to the role of their consumption as a means for the entry of resistant bacteria into the consumer [20,21,22]. In addition, bacteria associated with fresh produce have a high diversity of self-transmissible multiple resistance plasmids that could be transferred to gut bacteria (both non-pathogen and pathogen species) through horizontal gene transfer mechanisms [23,24], therefore contributing to the spreading of resistant bacteria in the community, and consequently to agammaavate the increasingly growing problem of infections caused by resistant Gram-negative bacteria [25,26].

    The presence of Enterobacteriaceae (and other Gram-negative) species in all type of fresh vegetables (including fresh-cut vegetables and prepared salads) confirms that their consumption may be considered (i) as a food safety concern, even in the absence of pathogenic species, as most of the identified isolates correspond to opportunistic pathogens able to cause infection in immunocompromised individuals, and (ii) as a means for the of entry resistant bacteria into the consumer, therefore contributing to the spreading of resistant bacteria into the community. Thus, it could be relevant to include the detection of antibiotic-resistant non-pathogenic Enterobacteriaceae species in fresh vegetables in the epidemiological surveillance routine in order obtain valuable information about the extent of dissemination of antibiotic-resistant bacteria into the non-hospital environment, and to evaluate the potential role of consumption of fresh vegetables in spreading resistances into community. Our results indicate that sanitizing methods for fresh vegetables are not efficient enough to diminish their microbial burden, and therefore improved sanitizing processes are needed. Consequently, the development of farming strategies to prevent microbial contamination of fresh vegetables is an important key to increase the safety of their consumption. Finally, organic farming practices may favor bacterial diversity and a minor level of antibiotic-resistant bacteria in fresh produce, although a minor content of antibiotic-resistant bacteria would be desirable as an indicator of the quality of organic fresh produce.

    This work was supported by the Research Funds of the University of Valencia (Spain).

    The authors declare no conflict of interest.

    [1] Ulijaszek Sj, Lofink H (2006) Obesity in biocultural perspective. Ann Rev Anthropol 35: 337-360. doi: 10.1146/annurev.anthro.35.081705.123301
    [2] James WPT (2008) The epidemiology of obesity: the size of the problem. J Inter Med 236: 336-352.
    [3] WHO: World Health Organization (1997) Obesity: Preventing and Managing the Global Epidemic. Report of a WHO Consultation on Obesity. Geeneva.
    [4] Pouliou T, Elliott SJ (2010) Individual and socio-environmental determinants of overweight and obesity in urban Canada. Health & Place 16: 389-398.
    [5] Statistics Canada (2011) Overweight and obese adults (Self Reported). Catalogue 82-625- X.
    [6] Colls R, Evans B (2014) Making space for fat bodies?: A critical account of ‘the obesogenic environment’. Progress Human Geog 38(6): 733-753.
    [7] Cugnetto ML, Saab PG, Llabre MM, et al. (2008) Lifestyle factors, body mass index, and lipid profile in adolescents. J Pediatr Psycho 33(7): 761-771.
    [8] Catenacci VA, Hill JO, Wyatt HR (2009) The obesity epidemic, Clin Chest Med 30:415-444.
    [9] Petit CL, Berthelot J-M (2006) Obesity-a growing issue, Health Reports 17(3), Statistics Canada, Catalogue 82-003.
    [10] Behan DF, Cox SH, et al. [Internet]. Obesity and its relation to mortality and morbidity costs, The Society of Actuaries Report; [updated 2010 Nov 30; cited 2015 May 13]. Available from: https://www.soa.org/Files/Research/Projects/research-2011-obesity-relation- mortality.pdf.
    [11] CDC Newsroom [Internet]. New CDC data show encouraging development in obesity rates among 2 to 5 years old; [updated 2014 Nov 25; cited 2015 May 05]. Available from: http://www.cdc.gov/media/releases/2014/p0225-child-obesity.html.
    [12] Fraser LK, Edwards KL (2010) The association between the geography of fast food outlets and childhood obesity rates in Leeds, UK. Health & Place 16: 1124-1128.
    [13] Levy E, Zambo ZM, Edellm D, Borys J-M (2015) The potential of reducing the prevalence of overweight and obese children in Canada using the EPOSE methodology. Can J Diabetes 39(1): S70-71.
    [14] Shields M (2006) Overweight and Obesity among children and youth. Health Reports 17(3), Statistics Canada Catalogue 82-003.
    [15] Alberta Health Services: Obesity Facts [Internet]. AHS, Alberta Health Services; [cited 2015 Apr 22]. Available from: http://www.albertahealthservices.ca/7467.asp.
    [16] Belluck P: The New York Times [Internet]. Children’s life expectancy being cut short by obesity; [updated 2005 Mar 17; cited 2015 May 13]. Available from: http://query.nytimes.com/gst/fullpage.html?res=9F01E3D7133CF934A25750C0A9639C8B6 3&sec=health&spon=&pagewanted=all.
    [17] WHO: World Health Organization (2014) Obesity: Preventing and Managing the Global Epidemic. WHO Technical Report Series No. 894. Geeneva.
    [18] Dehghan S, Akhtar-Danesh N, Merchant AT (2005) Childhood obesity, prevalence and prevention, Nutrition, 4:24.
    [19] Kuczmarski RJ, Ogden CL, Grummer-Strawn LM, Flegal KM, Guo SS, Wei R & others (2000) CDC growth charts: United States. Adv Data, 314, 1-27.
    [20] Smith DM, Cummins S (2009) Obese cities: how our environment shaped overweight. Geogra Com 3(1): 518-534.
    [21] Stunkard AJ (2000) Factors in Obesity: Current Views, Obesity and Poverty, In: Pena M, Bacallao J (eds) Obesity and Poverty: A new Public Health Challenge. Pan Am H Organ: 23-28.
    [22] Carnell S, Wardle J (2007) Measuring behavioural susceptibility to obesity: validation of the child eating behaviour questionnaire. Appetite 48 (1): 104-113.
    [23] Burgoine T, Alvandies S, Lake AA (2013) Creating ‘obesogenic realities’; do our methodological choices make a difference when measuring the food environment? Inter J H Geog 12: 33. doi: 10.1186/1476-072X-12-33
    [24] Spence JC, Cutumisu N, Edward J, et al. (2009). Relation between local food environments and obesity among adults. BMC Public Health 9: 192.
    [25] Marks J, Barnett LM, Foulkes C, et al. (2013) Using social network analysis to identify key child care center staff for obesity prevention interventions: A pilot study. Obesity 2013: 2013.
    [26] Chalkias C, Papadopoulos AG, Kalogeropoulos K, et al. (2013) Geographical heterogeneity of the relationship between childhood obesity and socio-environmental status: empirical evidence from Athens, Greece. App Geog 37: 34-43. doi: 10.1016/j.apgeog.2012.10.007
    [27] Wen TH, Chen DR, Tsai MJ (2010) Identifying geographical variations in poverty- obesity relationships: empirical evidence from Taiwan. Geospatial H 4(2): 257-265.
    [28] Lake AA, Burgoine T, Stamp E, Grieve R (2012) The foodscape: classification and field validation of secondary data sources across urban/rural and socio-economic classifications in England. Inter J Behavi Nutrition Physical Act 9: 35. doi: 10.1186/1479-5868-9-35
    [29] McCormack GR, Shiell A, Giles-Corti B, et al. (2012) The association between sidewalk length and walking for different purposes in established neighborhoods. Inter J Behavi Nutrition Physical Act 9: 92. doi: 10.1186/1479-5868-9-92
    [30] Spence JC, Holt NL, Sprysak CJ, et al. (2012) Non-refundable tax Credits are an inequitable policy instrument for promoting physical activity among Canadian children. Can J P H 103(3): 175-177.
    [31] Shannon J (2014) Food deserts: Governing obesity in the neoliberal city. Progress Human Geog38(2: 248-266.
    [32] Inagami S, Cohen DA, Brown AF, Steven MA (2009) Body mass index, neighbourhood fast food and restaurant concentration, and car ownership. J Urban Health: Bulletin of the New York Academ Med 86(5): 683-695.
    [33] Niedzwiedz C, Katikireddi SV, Pell JP, Mitchell R (2012) Life course socio-economic position and quality of life in adulthood: a systematic review of life course models. BMC Public Health 12: 628. doi: 10.1186/1471-2458-12-628
    [34] Potestio ML, Patel AB, Powell CD, et al. (2009) Is there an association between spatial access to parks/green space and childhood overweight/obesity in Calgary, Canada? Inter J Behavi Nutrition and Physical Act 6: 77.
    [35] Tjepkema M (2006) Adult obesity, Health Reports 17(3). Statistics Canada, Catalogue 82-003.
    [36] Janssen I, Boyce W, Simpson K, Pickett W (2006) Influence of individual- and area-level measures of socioeconomic status on obesity, unhealthy eating, and physical inactivity in Canadian adolescents. Am J Clinic Nutrition 83: 139-145.
    [37] Belanger-Ducharme F, Tremblay A (2005) Prevalence of obesity in Canada. Obesity Rev 6(3): 183-186.
    [38] Kirchengast S, Schober E (2006) To be an immigrant: a risk factor for developing overweight and obesity during childhood and adolescence? J Biosocial Sci 38: 695-705. doi: 10.1017/S0021932005027094
    [39] A concise report, Alberta Centre for Active Living [Internet]. Alberta Walking Survey; [cited 2015 May 13]. Available from: http://www.albertahealthservices.ca/HealthWellness/hi-hw-al-wc-survey.pdf
    [40] Abdel-Hamid TK (2009) Thinking in circles about obesity, applying systems thinking to weight management, Springer.
    [41] Raghunathan R, Naylor RW, Hoyer WD (2006) The unhealthy = tasty intuition and its effects on taste inferences, enjoyment, and choice of food products. J Am Market Ass 70(4): 170-184.
    [42] Hollands S, Campbell MK, Gilliland J, Sarma S (2013) A spatial analysis of the association between restaurant density and body mass index in Canadian adults. Prevent Med 13: S0091-7435.
    [43] Sadler RC, Gilliland JA, Arku G (2013) A food retail-based intervention on food security and consumption. Inter J Environ Res Public Health 10: 3325-3346. doi: 10.3390/ijerph10083325
    [44] Andreyeva T, Kelly IR, Harris JL (2011) Exposure to food advertising on television: Associations with children’s fast food and soft drink consumption and obesity. Economics & Human Biology 9(3): 221-223.
    [45] Duncan DT, Aldstadt J, Whalen J, et al. (2011) Validation of Walkscore for estimating neighborhood walkability; an analysis of four US metropolitan areas. Inter J Environ Res. Public Health 8: 4160-4179. doi: 10.3390/ijerph8114160
    [46] Sandalack BA, Uribe FGA, Zanjani AE, et al. (2013) Neighbourhood type and walkshed size. J Urbanism: Inter Res Placemaking Urban Sustain 11: 11
    [47] McCormack G, Giles-Corti B, Lange A, et al (2004) An update of recent evidence of the relationship between objective and self-report measure of the physical environment and physical activity behaviours. J Sci Med Sport 7(1): Supplement, 81-92.
    [48] Laxer RE, Janssen I (2013) The proportion of youth’s physical inactivity attributable to neighborhood built environment features. Inter J Health Geog 12: 31. doi: 10.1186/1476-072X-12-31
    [49] Carr LJ, Dunsiger SI, Marcus BH (2010) Walk Score as a global estimate of neighbourhood walkability. Am J Prevent Med 39(5): 460-463.
    [50] Dewulf B, Neutens T, Dyck DV, et al. (2012) Correspondence between objective and perceived walking time to urban destinations: influence of physical activity, neighbourhood walkability, and socio-demographics. Inter J Health Geog 11: 43. doi: 10.1186/1476-072X-11-43
    [51] Dyck DV, Sallis JF, Cardon G, et al. (2013) Associations of neighbourhood characteristics with active park use: an observational study in two cities in the USA and Belgium. Inter J Health Geog 12: 26. doi: 10.1186/1476-072X-12-26
    [52] Kligerman M, Sallis JF, Ryan S, et al. (2007) Association of neighborhood design and recreation environment variables with physical activity and body mass index in adolescents. Am J Health Promotion 21(4): 274-277.
    [53] Karanfil O, Moore T, Finley P, et al. (2011) A multi-scale paradigm to design policy options for obesity prevention: exploring the integration of individual-based modeling and system dynamics. Proceedings of the 29th Inter Confer Sys D Soci, July 24-28, 2011. Washington DC, USA.
    [54] Homer J, Milstein B, Dietz W, et al. (2006) Obesity Population Dynamics: Exploring historical growth and plausible future in the US. Proceedings of the 24th Inter Confer Sys D Soci, July 23-27, 2006. Nijmegen, Netherlands.
    [55] Ahmad S, Simonovic SP (2004) Spatial system dynamics: new approach for simulation of water resources systems. J Comp Civil Eng 18(4): 331-340.
    [56] Fotheringham AS, Brunsdon C, Charlton M (2002) Geographically Weighted Regression: The analysis of spatially varying relationships. Wiley, West Sussex.
    [57] Mahamoud A, Roche B, Homer J. (2013) Modeling the social determinants of health and simulating short-term and long-term intervention impacts for the city of Toronto, Canada. Social Sci & Med 93: 247-255.
    [58] Bailie A, Beckstead C: PEMBINA Institute [Internet]. Canada's Coolest Cities. Technical Report; [updated 2010 May 26; cited 2015 Apr 25]. Available from: http://www.pembina.org/pub/2021.
    [59] Statistics Canada (2006) Community Profiles.
    [60] Gauvin L, Robitaille R, Riva M, et al. (2007) Conceptualizing and operationalizing and neighbourhoods: the conundrum of identifying territorial units. Can J Public Health 98: 518-526.
    [61] Riger S, Lavrakas PJ (1981) Community ties: patterns of attachment and social interaction in urban neighborhoods, Am J Com Psycho 9(1): 55-66.
    [62] Grigsby-Toussaint D, Chi S-H, Fiese BH (2011) Where they live, how they play: neighborhood greenness and outdoor physical activity among preschoolers. Inter J Health Geog 10: 66. doi: 10.1186/1476-072X-10-66
    [63] Routine immunization schedule [Internet]. Alberta Health; [cited 2013 Nov 09]. Available from: http://www.health.alberta.ca/health-info/imm-routine-schedule.html.
    [64] PCTF (Postal Code Translator File), 2013, Alberta Health.
    [65] ESRI: Environmental System Research Institute [Internet]. Redlands, CA (USA); [cited 2013 Apr 21]. Available from: http://www.esri.com.
    [66] Preston S, Heuveline P, Guillot M (2000) Demography: Measuring and Modeling Population Processes, Blackwell Publishing, Oxford.
    [67] Census Dictionary (2006). Statistics Canada, Catalogue no. 92-566-X.
    [68] DMTI EPOI (2011) Enhanced Point of Interest, User Manual, V2011.3.
    [69] Schoeppe S, Duncan MJ, Badland H, et al. (2014) Associations between children’s independent mobility and physical activity. BMC Public Health 14: 19. doi: 10.1186/1471-2458-14-19
    [70] Jones LR (2010) Investigating neighborhood walkability and its association with physical activity levels and body composition of a sample of Maryland adolescent girls. E & B T D, UMD Thesis and Dissertations.
    [71] Walkscore [Internet]. USA; [cited 2013 Feb 17]. Available from: http://www.walkscore.com.
    [72] Open data, Pathways and Bikeway [Internet]. City of Calgary; [cited 2013 Apr 21]. Available from http://www.calgary.ca/CSPS/Parks/Pages/Pathways/Pathways-in- Calgary.aspx.
    [73] Brunsdon C, Charlton M, Harris P (2012) Living with collinearity in local regression models, Proceedings of the 10th Inter Sym Spatial Accur Ass Natural Res Environ Sci, Florianopolis SC, Brazil.
    [74] Cho S-H, Lambert DM, Chen Z (2010) Geographically weighted regression bandwidth selection and spatial autocorrelation: an empirical example using Chinese agriculture data, App Eco L 17, 767-772.
    [75] Wheeler D, Calder CA (2007) An assessment of coefficient accuracy in linear regression models with spatially varying coefficients, J Geog Sys 9, 145-166.
    [76] Brunsdon C, Fotheringham AS, Charlton ME (1996) Geographically weighted regression: a method for exploring spatial non-stationarity. Geog Anal 28(4): 281-298.
    [77] Weisent J, Rohrbach B, Dunn J, Odoi A (2012) Socioeconomic determinants of geographic disparities in campylobacteriosis risk: a comparison of global and local modeling approaches. Inter J Health Geog 11: 45. doi: 10.1186/1476-072X-11-45
    [78] Mennis J (2006) Mapping the results of geographically weighted regression. Cart J 43(2): 171-179.
    [79] Ingalls EJ, Kolesar P, Walker WE (2008) Using simulation to develop and validate analytic models: some case studies. Operations Res 26(2): 237-253.
    [80] Hovmand PS, Pitner R (2005) Combining system dynamics, social networks, and geographic information systems, perception of safety. Proceedings of the 23rd International Conference of the System Dynamics Society, July 17-21, 2005. Boston MA, USA.
    [81] Forrester JW (1971) Principles of Systems. Waltham: Pegasus Communications, Inc.
    [82] Sterman JD (2000) Business Dynamics: System Thinking and Modeling for a Complex World. Bosten, M: Irwin McGraw-Hill.
    [83] Vensim. Ventana Systems Inc. [Internet]. Harvard, MA (USA); [cited 2013 May05]. Available from: http://vensim.com/.
    [84] Babb C, Burke M, Tranter P (2011) Developing neighbourhood ‘walkability’ indices for children’s active transport, Proceedings of the Healthy City and Planning, Track 18, 3rd World Planning Schools Congress, Perth (WA).
    [85] Holt NL, Spence JC, Sehn ZL, Cutumisu N (2008) Neighborhood and developmental differences in children’s perceptions of opportunities for play and physical activity. Health & Place 14(1): 2-14.
    [86] Finn K, Johannsen N, Specker B (2003) Factors associated with physical activity in preschool children, J Pedi 140(1): 81-85.
    [87] Weinberger R, Sweet MN (2012) Integrating walkability into planning practice, Transportation Research Record. J Transport Res B 2322: 20-20. doi: 10.3141/2322-03
    [88] Robinson WS (2009) Ecological correlations and the behavior of individuals. Inter J Epidem38(2), 337-341.
    [89] Openshaw S (1977) A geographical solution to scale and aggregation problems in region- building, partitioning, and spatial modelling. Transact I Brit Geog, New series 2, 459-472.
    [90] Parenteau M-P, Sawada MC (2011) The modifiable areal unit problem (MAUP) in the relationship between exposure to NO2 and respiratory health. Inter J Health Geog 10(1), 58.
  • This article has been cited by:

    1. Emanuela Melis, Andrea Vincis, Pier F. Orrù, An Overview of Current Models and Approaches to Biomass Supply Chain Design and Management, 2018, 5, 2196-3010, 138, 10.1007/s40518-018-0108-6
    2. Nawa Raj Baral, Ryan Davis, Thomas H. Bradley, Supply and value chain analysis of mixed biomass feedstock supply system for lignocellulosic sugar production, 2019, 13, 1932-104X, 635, 10.1002/bbb.1975
    3. Mir Saman Pishvaee, Shayan Mohseni, Samira Bairamzadeh, 2021, 9780128206409, 37, 10.1016/B978-0-12-820640-9.00003-9
    4. Yanan Zheng, Feng Qiu, Bioenergy in the Canadian Prairies: Assessment of accessible biomass from agricultural crop residues and identification of potential biorefinery sites, 2020, 140, 09619534, 105669, 10.1016/j.biombioe.2020.105669
    5. Fangzhou Sun, Maichel M. Aguayo, Rahul Ramachandran, Subhash C. Sarin, Biomass feedstock supply chain design – a taxonomic review and a decomposition-based methodology, 2018, 56, 0020-7543, 5626, 10.1080/00207543.2018.1475766
    6. Tasmin Hossain, Daniela Jones, Damon Hartley, L. Michael Griffel, Yingqian Lin, Pralhad Burli, David N. Thompson, Matthew Langholtz, Maggie Davis, Craig Brandt, The nth-plant scenario for blended feedstock conversion and preprocessing nationwide: Biorefineries and depots, 2021, 294, 03062619, 116946, 10.1016/j.apenergy.2021.116946
    7. Beibei Liu, Qiaoran Wu, Feng Wang, Regional optimization of new straw power plants with greenhouse gas emissions reduction goals: A comparison of different logistics modes, 2017, 161, 09596526, 871, 10.1016/j.jclepro.2017.06.015
  • Reader Comments
  • © 2015 the Author(s), licensee AIMS Press. This is an open access article distributed under the terms of the Creative Commons Attribution License (http://creativecommons.org/licenses/by/4.0)
通讯作者: 陈斌, bchen63@163.com
  • 1. 

    沈阳化工大学材料科学与工程学院 沈阳 110142

  1. 本站搜索
  2. 百度学术搜索
  3. 万方数据库搜索
  4. CNKI搜索

Metrics

Article views(9517) PDF downloads(1523) Cited by(16)

Figures and Tables

Figures(4)  /  Tables(3)

Other Articles By Authors

/

DownLoad:  Full-Size Img  PowerPoint
Return
Return

Catalog