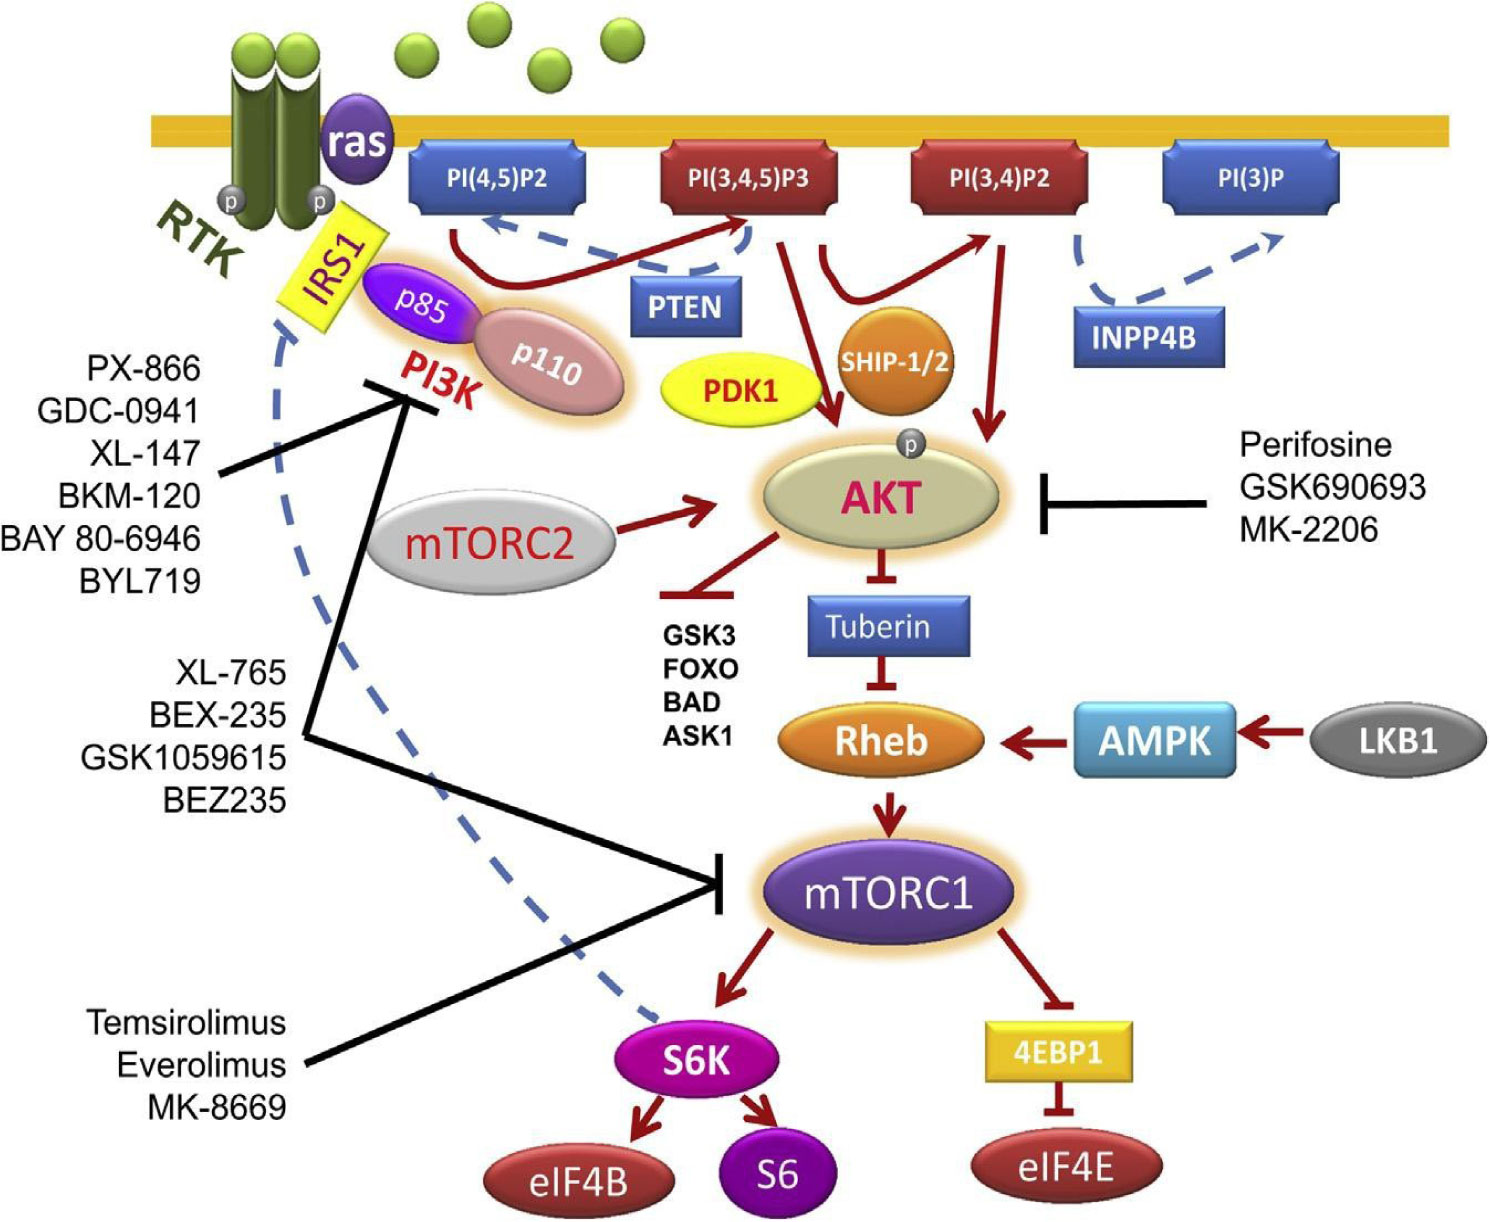
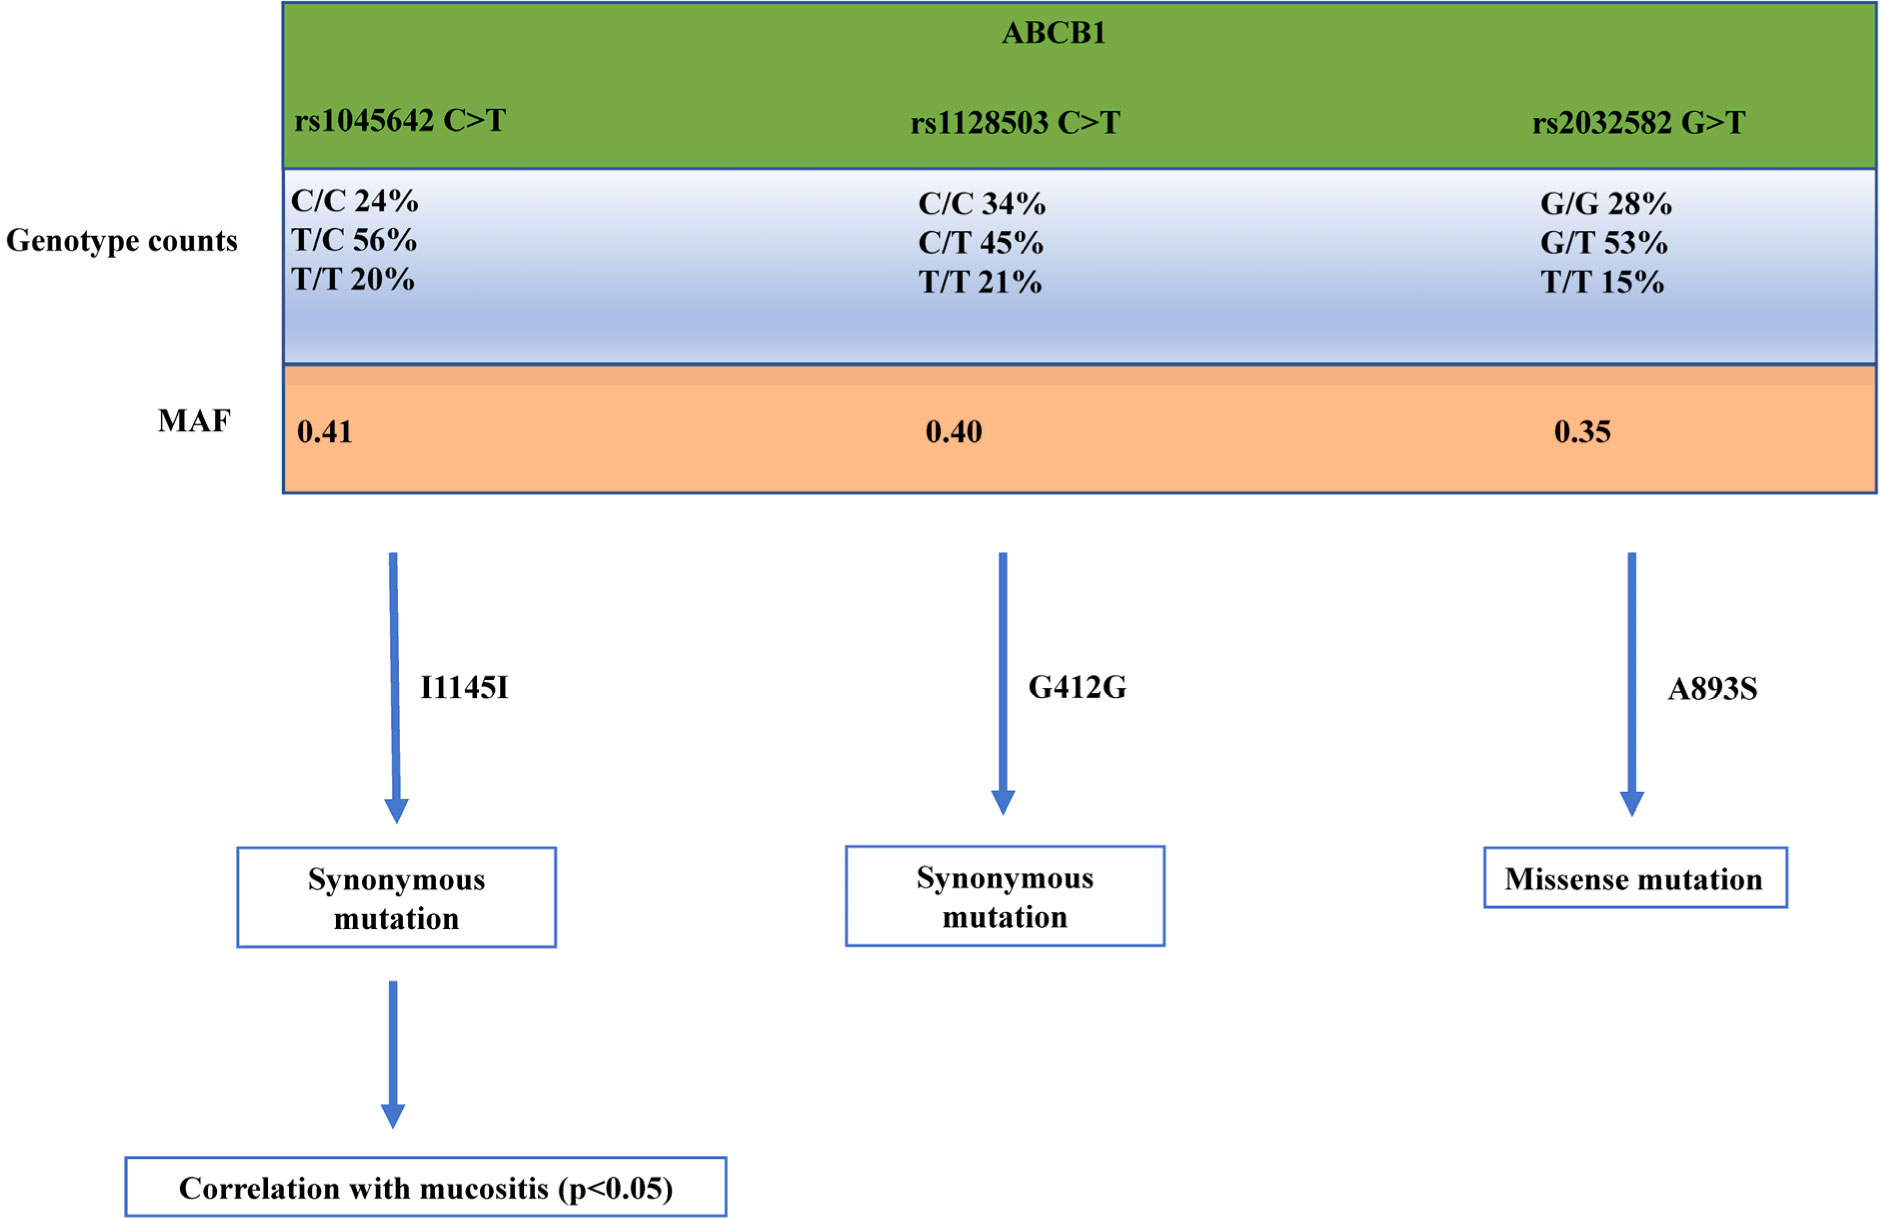
Breast cancer is one of the most devastating diseases in the world, the most diffused cancer in women. Despite the incredible progress made in the field, the mortality rate in the metastatic setting is still quite high. Among the different drugs used to treat this disease, the mTOR inhibitor everolimus is one of the most promising ones, that has been approved to be used together with exemestane in the treatment of oestrogen receptor positive/human epidermal growth factor receptor 2 negative BC patients in combination with exemestane in patients who have progressed to anastrozole or letrozole, following the encouraging results coming from BOLERO-2 clinical trial showing a significant increase in progression-free-survival of patients compared to patients treated with exemestane and placebo. In this article we will discuss how the toxicity of this drug could be increased with Rs1045642 C>T genetic alteration in ATP Binding Cassette Subfamily B Member 1 (ABCB1), a pump that expels this drug from the cells, leading to a more inactive ABCB1. With an inactivation of ABCB1 more everolimus would linger within the cancer cells, exerting more of its anti-tumor work. Future diagnosis of genetic alteration of Rs1045642 C>T in ABCB1 could be pivotal for determining if patients would benefit more from everolimus.
Citation: Simone Leggeri, Navid Sobhani. Single nucleotide polymorphisms Rs1045642 C>T genetic alteration in ATP Binding Cassette Subfamily B Member 1 role in increasing everolimus toxicity in metastatic breast cancer[J]. AIMS Molecular Science, 2020, 7(1): 1-11. doi: 10.3934/molsci.2020001
Breast cancer is one of the most devastating diseases in the world, the most diffused cancer in women. Despite the incredible progress made in the field, the mortality rate in the metastatic setting is still quite high. Among the different drugs used to treat this disease, the mTOR inhibitor everolimus is one of the most promising ones, that has been approved to be used together with exemestane in the treatment of oestrogen receptor positive/human epidermal growth factor receptor 2 negative BC patients in combination with exemestane in patients who have progressed to anastrozole or letrozole, following the encouraging results coming from BOLERO-2 clinical trial showing a significant increase in progression-free-survival of patients compared to patients treated with exemestane and placebo. In this article we will discuss how the toxicity of this drug could be increased with Rs1045642 C>T genetic alteration in ATP Binding Cassette Subfamily B Member 1 (ABCB1), a pump that expels this drug from the cells, leading to a more inactive ABCB1. With an inactivation of ABCB1 more everolimus would linger within the cancer cells, exerting more of its anti-tumor work. Future diagnosis of genetic alteration of Rs1045642 C>T in ABCB1 could be pivotal for determining if patients would benefit more from everolimus.

| [1] |
Ambudkar S V, Lelong IH, Zhang J, et al. (1992) Partial purification and reconstitution of the human multidrug-resistance pump: Characterization of the drug-stimulatable ATP hydrolysis. Proc Natl Acad Sci U S A 89: 8472-8476. doi: 10.1073/pnas.89.18.8472

|
| [2] |
Hoffmeyer S (2000) Functional polymorphisms of the human multidrug-resistance gene: Multiple sequence variations and correlation of one allele with P-glycoprotein expression and activity in vivo. Proc Natl Acad Sci 97: 3473-3478. doi: 10.1073/pnas.97.7.3473
|
| [3] |
Kimchi-Sarfaty C, Oh JM, Kim IW, et al. (2007) A “silent” polymorphism in the MDR1 gene changes substrate specificity. Science 315: 525-528. doi: 10.1126/science.1135308
|
| [4] |
Fung KL, Pan J, Ohnuma S, et al. (2014) MDR1 synonymous polymorphisms alter transporter specificity and protein stability in a stable epithelial monolayer. Cancer Res 74: 598-608. doi: 10.1158/0008-5472.CAN-13-2064
|
| [5] | Al-Eitan LN, Rababa'h DM, Alghamdi MA, et al. (2019) Role of Four ABC Transporter Genes in Pharmacogenetic Susceptibility to Breast Cancer in Jordanian Patients. J Oncol 2019. |
| [6] |
Wang Z, Wang T, Bian J (2013) Association between MDR1 C3435T polymorphism and risk of breast cancer. Gene 532: 94-99. doi: 10.1016/j.gene.2013.09.050
|
| [7] |
Pascual T, Apellániz-Ruiz M, Pernaut C, et al. (2017) Polymorphisms associated with everolimus pharmacokinetics, toxicity and survival in metastatic breast cancer. PLoS One 12: e0180192. doi: 10.1371/journal.pone.0180192
|
| [8] |
Marzolini C, Paus E, Buclin T, et al. (2004) Polymorphisms in human MDR1 (P-glycoprotein): Recent advances and clinical relevance. Clin Pharmacol Ther 75: 13-33. doi: 10.1016/j.clpt.2003.09.012
|
| [9] |
Baselga J (2011) Targeting the phosphoinositide-3 (PI3) kinase pathway in breast cancer. Oncologist 16: 12-9. doi: 10.1634/theoncologist.2011-S1-12
|
| [10] |
Arcaro A, Guerreiro A (2007) The Phosphoinositide 3-Kinase Pathway in Human Cancer: Genetic Alterations and Therapeutic Implications. Curr Genomics 8: 271-306. doi: 10.2174/138920207782446160
|
| [11] |
Saxton RA, Sabatini DM (2017) mTOR Signaling in Growth, Metabolism, and Disease. Cell 168: 960-976. doi: 10.1016/j.cell.2017.02.004
|
| [12] |
Sonenberg N, Hinnebusch AG (2009) Regulation of Translation Initiation in Eukaryotes: Mechanisms and Biological Targets. Cell 136: 731-745. doi: 10.1016/j.cell.2009.01.042
|
| [13] |
Sobhani N, Corona SP, Zanconati F, et al. (2017) Cyclin dependent kinase 4 and 6 inhibitors as novel therapeutic agents for targeted treatment of malignant mesothelioma. Genes Cancer 8: 495-496. doi: 10.18632/genesandcancer.138
|
| [14] |
Pelletier J, Thomas G, Volarevi S (2017) Ribosome biogenesis in cancer: New players and therapeutic avenues. Nat Rev Cancer 18: 51-63. doi: 10.1038/nrc.2017.104
|
| [15] |
Iadevaia V, Liu R, Proud CG (2014) MTORC1 signaling controls multiple steps in ribosome biogenesis. Semin Cell Dev Biol 36: 113-120. doi: 10.1016/j.semcdb.2014.08.004
|
| [16] |
Qin X, Jiang B, Zhang Y (2016) 4E-BP1, a multifactor regulated multifunctional protein. Cell Cycle 15: 781-786. doi: 10.1080/15384101.2016.1151581
|
| [17] |
Hay N, Sonenberg N (2004) Upstream and downstream of mTOR. Genes Dev 18: 1926-1945. doi: 10.1101/gad.1212704
|
| [18] |
Reynolds TH, Bodine SC, Lawrence JC (2002) Control of Ser2448 phosphorylation in the mammalian target of rapamycin by insulin and skeletal muscle load. J Biol Chem 277: 17657-17662. doi: 10.1074/jbc.M201142200
|
| [19] | Sekulić A, Hudson CC, Homme JL, et al. (2000) A direct linkage between the phosphoinositide 3-kinase-AKT signaling pathway and the mammalian target of rapamycin in mitogen-stimulated and transformed cells. Cancer Res 60: 3504-3513. |
| [20] |
Navé BT, Ouwens DM, Withers DJ, et al. (1999) Mammalian target of rapamycin is a direct target for protein kinase B: Identification of a convergence point for opposing effects of insulin and amino-acid deficiency on protein translation. Biochem J 344: 427-431. doi: 10.1042/bj3440427
|
| [21] |
Scott PH, Brunn GJ, Kohn AD, et al. (1998) Evidence of insulin-stimulated phosphorylation and activation of the mammalian target of rapamycin mediated by a protein kinase B signaling pathway. Proc Natl Acad Sci U S A 95: 7772-7777. doi: 10.1073/pnas.95.13.7772
|
| [22] |
Zhou H, Huang S (2010) The Complexes of Mammalian Target of Rapamycin. Curr Protein Pept Sci 11: 409-424. doi: 10.2174/138920310791824093
|
| [23] |
Pópulo H, Lopes JM, Soares P (2012) The mTOR signalling pathway in human cancer. Int J Mol Sci 13: 1886-1918. doi: 10.3390/ijms13021886
|
| [24] |
Yang J, Chi Y, Burkhardt BR, et al. (2010) Leucine metabolism in regulation of insulin secretion from pancreatic beta cells. Nutr Rev 68: 270-279. doi: 10.1111/j.1753-4887.2010.00282.x
|
| [25] |
Dennis MD, Jefferson LS, Kimball SR (2012) Role of p70S6K1-mediated phosphorylation of eIF4B and PDCD4 proteins in the regulation of protein synthesis. J Biol Chem 287: 42890-42899. doi: 10.1074/jbc.M112.404822
|
| [26] |
Huang J, Manning BD (2008) The TSC1-TSC2 complex: A molecular switchboard controlling cell growth. Biochem J 412: 179-190. doi: 10.1042/BJ20080281
|
| [27] |
Zaha VG, Young LH (2012) AMP-activated protein kinase regulation and biological actions in the heart. Circ Res 111: 800-814. doi: 10.1161/CIRCRESAHA.111.255505
|
| [28] |
Yardley DA, Noguchi S, Pritchard KI, et al. (2013) Everolimus plus exemestane in postmenopausal patients with HR+ breast cancer: BOLERO-2 final progression-free survival analysis. Adv Ther 30: 870-884. doi: 10.1007/s12325-013-0060-1
|
| [29] |
Zanger UM, Schwab M (2013) Cytochrome P450 enzymes in drug metabolism: Regulation of gene expression, enzyme activities, and impact of genetic variation. Pharmacol Ther 138: 103-141. doi: 10.1016/j.pharmthera.2012.12.007
|
| [30] |
Baselga J, Campone M, Piccart M, et al. (2012) Everolimus in postmenopausal hormone-receptor-positive advanced breast cancer. N Engl J Med 366: 520-529. doi: 10.1056/NEJMoa1109653
|
| [31] |
Levran O, O'Hara K, Peles E, et al. (2008) ABCB1 (MDR1) genetic variants are associated with methadone doses required for effective treatment of heroin dependence. Hum Mol Genet 17: 2219-2227. doi: 10.1093/hmg/ddn122
|
| [32] |
Jackson SE, Chester JD (2015) Personalised cancer medicine. Int J Cancer 137: 262-266. doi: 10.1002/ijc.28940
|
| [33] | Goutsouliak K, Veeraraghavan J, Sethunath V, et al. (2019) Towards personalized treatment for early stage HER2-positive breast cancer. Nat Rev Clin Oncol . |
| [34] |
Chen L, Qi H, Zhang L, et al. (2018) Effects of FGFR gene polymorphisms on response and toxicity of cyclophosphamide-epirubicin-docetaxel-based chemotherapy in breast cancer patients. BMC Cancer 18: 1038. doi: 10.1186/s12885-018-4951-z
|
| [35] |
Sawyer MB, Pituskin E, Damaraju S, et al. (2016) A Uridine Glucuronosyltransferase 2B7 Polymorphism Predicts Epirubicin Clearance and Outcomes in Early-Stage Breast Cancer. Clin Breast Cancer 16: 139-144.e3. doi: 10.1016/j.clbc.2015.09.006
|
Figures(2) / Tables(1)

Simone Leggeri, Navid Sobhani. Single nucleotide polymorphisms Rs1045642 C>T genetic alteration in ATP Binding Cassette Subfamily B Member 1 role in increasing everolimus toxicity in metastatic breast cancer[J]. AIMS Molecular Science, 2020, 7(1): 1-11. doi: 10.3934/molsci.2020001


 DownLoad: