Review Topical Sections

Transglutaminase inhibition: possible therapeutic mechanisms to protect cells from death in neurological disorders

  • Transglutaminases are a family of Ca2+-dependent enzymes which catalyze post-translational modifications of proteins. The main activity of these enzymes is the cross-linking of glutaminyl residues of a protein/peptide substrate to lysyl residues of a protein/peptide co-substrate. In addition to lysyl residues, other second nucleophilic co-substrates may include monoamines or polyamines (to form mono- or bi-substituted/crosslinked adducts) or −OH groups (to form ester linkages). In absence of co-substrates, the nucleophile may be water, resulting in the net deamidation of the glutaminyl residue. Transglutaminase activity has been suggested to be involved in molecular mechanisms responsible for both physiological or pathological processes. In particular, transglutaminase activity has been shown to be responsible for human autoimmune diseases, and Celiac Disease is just one of them. Interestingly, neurodegenerative diseases, such as Alzheimer’s Disease, Parkinson’s Disease, supranuclear palsy, Huntington’s Disease and other polyglutamine diseases, are characterized in part by aberrant cerebral transglutaminase activity and by increased cross-linked proteins in affected brains. Here we describe the possible molecular mechanisms by which these enzymes could be responsible for such diseases and the possible use of transglutaminase inhibitors for patients with diseases characterized by aberrant transglutaminase activity.

    Citation: Nicola Gaetano Gatta, Rosaria Romano, Elenamaria Fioretti, Vittorio Gentile. Transglutaminase inhibition: possible therapeutic mechanisms to protect cells from death in neurological disorders[J]. AIMS Molecular Science, 2017, 4(4): 399-414. doi: 10.3934/molsci.2017.4.399
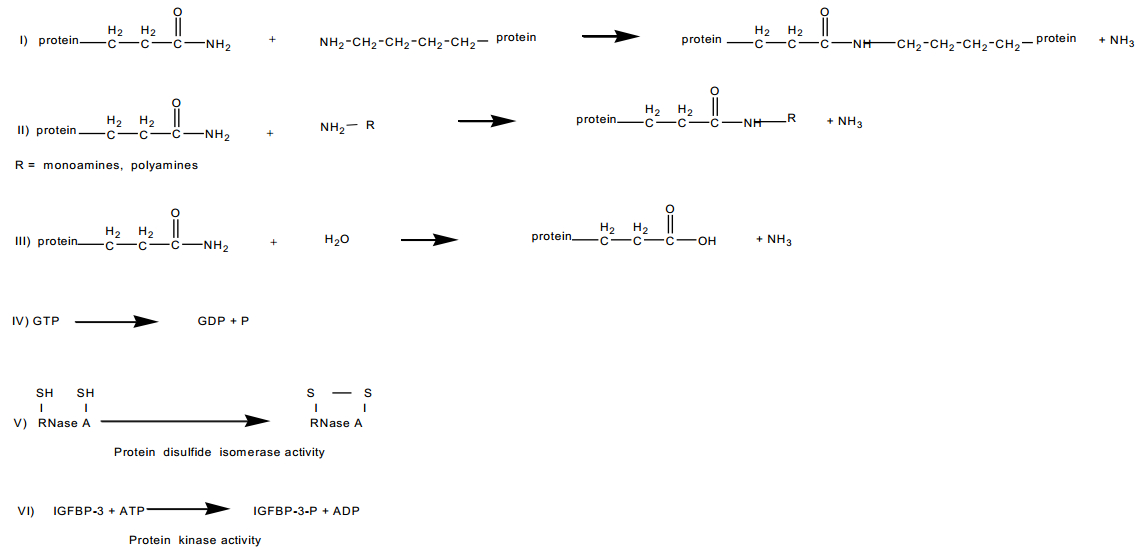
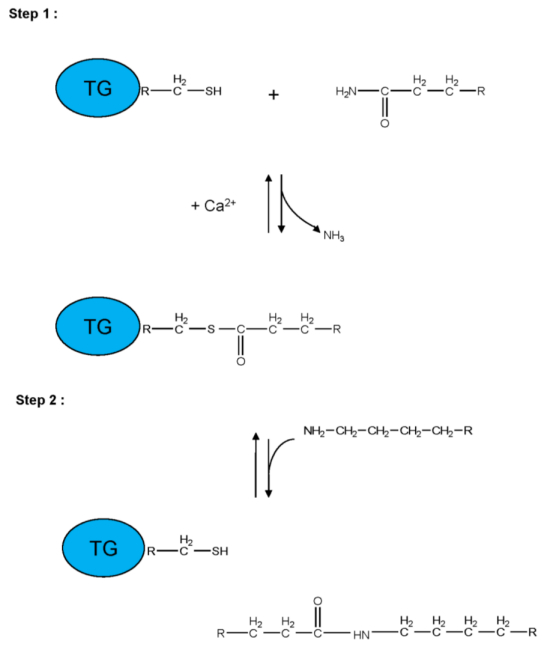
    Related Papers:

    [1] Rujing Zhao, Xiulan Lai . Evolutionary analysis of replicator dynamics about anti-cancer combination therapy. Mathematical Biosciences and Engineering, 2023, 20(1): 656-682. doi: 10.3934/mbe.2023030
    [2] Kangbo Bao . An elementary mathematical modeling of drug resistance in cancer. Mathematical Biosciences and Engineering, 2021, 18(1): 339-353. doi: 10.3934/mbe.2021018
    [3] Ami B. Shah, Katarzyna A. Rejniak, Jana L. Gevertz . Limiting the development of anti-cancer drug resistance in a spatial model of micrometastases. Mathematical Biosciences and Engineering, 2016, 13(6): 1185-1206. doi: 10.3934/mbe.2016038
    [4] Alexis B. Cook, Daniel R. Ziazadeh, Jianfeng Lu, Trachette L. Jackson . An integrated cellular and sub-cellular model of cancer chemotherapy and therapies that target cell survival. Mathematical Biosciences and Engineering, 2015, 12(6): 1219-1235. doi: 10.3934/mbe.2015.12.1219
    [5] Cristian Tomasetti, Doron Levy . An elementary approach to modeling drug resistance in cancer. Mathematical Biosciences and Engineering, 2010, 7(4): 905-918. doi: 10.3934/mbe.2010.7.905
    [6] Urszula Ledzewicz, Shuo Wang, Heinz Schättler, Nicolas André, Marie Amélie Heng, Eddy Pasquier . On drug resistance and metronomic chemotherapy: A mathematical modeling and optimal control approach. Mathematical Biosciences and Engineering, 2017, 14(1): 217-235. doi: 10.3934/mbe.2017014
    [7] Tinevimbo Shiri, Winston Garira, Senelani D. Musekwa . A two-strain HIV-1 mathematical model to assess the effects of chemotherapy on disease parameters. Mathematical Biosciences and Engineering, 2005, 2(4): 811-832. doi: 10.3934/mbe.2005.2.811
    [8] Urszula Ledzewicz, Heinz Schättler, Mostafa Reisi Gahrooi, Siamak Mahmoudian Dehkordi . On the MTD paradigm and optimal control for multi-drug cancer chemotherapy. Mathematical Biosciences and Engineering, 2013, 10(3): 803-819. doi: 10.3934/mbe.2013.10.803
    [9] Ana Costa, Nuno Vale . Strategies for the treatment of breast cancer: from classical drugs to mathematical models. Mathematical Biosciences and Engineering, 2021, 18(5): 6328-6385. doi: 10.3934/mbe.2021316
    [10] Natalia L. Komarova . Mathematical modeling of cyclic treatments of chronic myeloid leukemia. Mathematical Biosciences and Engineering, 2011, 8(2): 289-306. doi: 10.3934/mbe.2011.8.289
  • Transglutaminases are a family of Ca2+-dependent enzymes which catalyze post-translational modifications of proteins. The main activity of these enzymes is the cross-linking of glutaminyl residues of a protein/peptide substrate to lysyl residues of a protein/peptide co-substrate. In addition to lysyl residues, other second nucleophilic co-substrates may include monoamines or polyamines (to form mono- or bi-substituted/crosslinked adducts) or −OH groups (to form ester linkages). In absence of co-substrates, the nucleophile may be water, resulting in the net deamidation of the glutaminyl residue. Transglutaminase activity has been suggested to be involved in molecular mechanisms responsible for both physiological or pathological processes. In particular, transglutaminase activity has been shown to be responsible for human autoimmune diseases, and Celiac Disease is just one of them. Interestingly, neurodegenerative diseases, such as Alzheimer’s Disease, Parkinson’s Disease, supranuclear palsy, Huntington’s Disease and other polyglutamine diseases, are characterized in part by aberrant cerebral transglutaminase activity and by increased cross-linked proteins in affected brains. Here we describe the possible molecular mechanisms by which these enzymes could be responsible for such diseases and the possible use of transglutaminase inhibitors for patients with diseases characterized by aberrant transglutaminase activity.


    Cancer is a group of diseases involving abnormal cell growth [1,2]. Currently, despite great progresses of many newly developed therapeutic methods [3,4,5], chemotherapy is still a common treatment method for many cancers. Patients are often administrated with high-dose of cytotoxic chemotherapeutics trying to eliminate tumor cells as much as possible [6,7,8,9,10,11]. Nevertheless, it is difficult to determine the proper dosage of chemotherapy, low dosage is ineffective in killing tumor cells, whereas excessive dosage may result in additional toxicity that is intolerable to patients [6]. Clinically, patients are often dosed at maximum or near maximum tolerated dose, which is carefully determined in phase Ⅰ studies [7,12]. However, high level doses often induce series side-effects, increasing the chemotherapy dose (also the treatment cost) would not yield the decreasing of the recurrence rate [13,14]. The recurrent tumors often show drug resistance, which is a major cause of treatment failure in chemotherapeutic drugs [15,16,17].

    Drug resistance has been a major challenge in cancer therapy. The mechanisms of drug resistance are complex, and many reasons are involved, including cellular plasticity [18], heterogenous tumor cells [19], or therapy induced gene mutations [20,21]. In this study, we focus on a mechanism of drug resistance due to chemotherapy-induced genome instability. Chemotherapy agents are cytotoxic by means of interfering with cell division in a way of damaging or stressing cells, and leading to cell death through apoptosis. During the early stage of apoptosis, apoptotic chromosome fragmentation (C-Frag) are produced through the cleavage by caspase-3 activated DNase (CAD) [22]. Nevertheless, C-Frag does not always result in cell death, sometimes the chromosome fragments can randomly rejoin to form genome chaos so that the cells survive from crisis [23,24]. These survived cells carry non-clonal chromosome aberrations (NCCAs), the major form of genome variation and the key index of genome instability in cancer cells [25,26,27,28]. It was proposed that such genome instability induced by chemotherapy is a source of drug resistance in cancer therapy [26,27]; quantitative control of drug dosages is important for the long-term clinical effects.

    Mathematical modelling approaches have been widely used in cancer research from different aspects [2,29]. A variety of models have been established to study the mechanisms of drug resistance after chemotherapy [30,31,32,33,34]. However, there are rare quantitative studies on how tumor cells population change in response to chemotherapy and drug resistance due to therapy-induced chromosome recombination. The roles of NCCAs in tumor recurrence is still controversial [35].

    In this study, we intend to investigate how NCCAs may affect tumor growth, and present a mathematical model for chromosome recombination-induced drug resistance in cancer therapy. The model extends the previously well studied G0 cell cycle model [36,37,38,39], and includes cell survival from C-Frag [23,24]. We mainly study cell population responses to various doses of chemotherapy, and show that there is an optimal dose (within the maximum tolerated dose) so that the steady state tumor cell number is relative low after chemotherapy. Moreover, the model implies that persistent extreme high dose therapy may induce oscillations in cell number, which is clinically inappropriate and should be avoided.

    In this study, we model the process of tumor growth through formulations of stem cell regeneration. Here, we mainly consider chemotherapy for leukemia, and mathematical models of hematopoiesis are referred in our modeling. We refer the classical G0 cell cycle model that has long been studied in literatures [40,41,42] (Figure. 1(a)). In the model, leukemia stem cells are classified as either resting or proliferative phase cells. Resting phase cells (Q, cells/kg) either enter the proliferative phase at a rate β (day1), or be removed from the pool of resting phase due to differentiation, senescence, or death, at a rate κ (day1). The cells at the proliferative phase undergo apoptosis in a rate μ (day1), and the duration of the proliferative phase is τ (days), each survived cell divides into two daughter cells through mitosis at the end of the proliferative phase. These processes can be described by a delay differential equation model [36,37,38,39]:

    dQdt=(β(Q)+κ)Q+2eμτβ(Qτ)Qτ. (2.1)
    Figure 1.  The G0 cell cycle model of leukemia stem cell regeneration. (a) Leukemia stem cell regeneration without chemotherapy. All stem cells are classified into the resting and the proliferative phase. During stem cell regeneration, resting phase cells either enter the proliferating phase with a rate β, or be removed from the resting pool with a rate κ due to differentiation, senescence, or death. The proliferating cells undergo apoptosis with a rate μ. At the end of the resting phase, each cell divides into two daughter cells through mitosis. (b) Leukemia stem cell regeneration under chemotherapy. Chemotherapy agents interfere the process of cell division and promote apoptosis [49]. During apoptosis, after the early stage of chromosome fragmentation, some cells survive from crisis (with a probability q(μ1)) through chromosome recombination, and the survived cells re-enter the G0 phase. Here the extra apoptosis rate μ1 is a parameter associated with the chemotherapy dose.

    Here, the subscript means the time delay, i.e., Qτ=Q(tτ). The equation (2.1) has been widely applied in the study of hematopoietic stem cell regeneration dynamics and blood disease [43,44,45,46], as well as the hematopoietic responses to chemotherapy [47,48].

    The proliferation rate β is a function of the resting phase cell number Q, indicating the regulation of cell proliferation through cytokines secreted from all stem cells. Normally, the proliferation rate is a decrease function of the cell number, and approaches 0 when the cell number Q is large enough [50]. Nevertheless, in the situation of cancer, the function can be non-monotonic because cancer cells can evade growth suppressors, and produce self-sustaining proliferative signaling [51].

    Now, we consider the effects of chemotherapy, which often promote cell death during the proliferative phrase due to the toxicity [49]. Hence, we write the apoptosis rate as μ=μ0+μ1, where μ0 represents the baseline apoptosis rate in the absence of chemotherapy, and μ1 the extra apoptosis rate due to treatment stress (the rate μ1 is often increase with the chemotherapy dose, hence we also refer μ1 as the dose for short). At the early apoptosis stage, the cells undergo chromosome fragmentation (C-Frag) (cell number given by (1eμτ)β(Qτ)Qτ). However, in a small population of cells with C-Frag, the fragments can rejoin to yield chromosome recombination and the cells survive from crisis and re-enter the G0 phase; other cells continue the apoptosis process (Figure. 1(b)). We assume that the probability of chromosome recombination, q(μ1) (0q(μ1)<1), is dependent on the chemotherapy dose, so that q(μ1) is an increase function. Therefore, we modify the above G0 cell cycle model (2.1) to include chromosome recombination, the cell number Q satisfies the following delay differential equation:

    dQdt=(β(Q)+κ)Q+(2eμτ+(1eμτ)q(μ1))β(Qτ)Qτ, (2.2)

    where

    μ=μ0+μ1. (2.3)

    Hereafter, we always assume that β(Q) is a decrease function, and q(μ1) is an increase function.

    For model simulation, we refer the classical models for hematopoietic stem cells (Table 1), and take the proliferation rate β(Q) and the probability of chromosome recombination q(μ1) as Hill type functions [44,50]:

    β(Q)=β0θnθn+Qn+β1,q(μ1)=q1μm1em+μm1. (2.4)
    Table 1.  Default parameter values. The parameter values for hematopoietic stem cells are referred to [44,50,52], and β1 is set to 0 for default, other parameters for the chemotherapy effect are taken arbitrary.
    Parameter Value Unit Source
    Q 1.53 ×10⁶ cells/kg [44,52]
    β0 8.0 day1 [44,50]
    β1 0 day1 -
    θ 0.096 ×10⁶ cells/kg [44,50]
    n 2 - [44]
    q1 1 day1 -
    e 0.34 day1 -
    m 4 - -
    κ 0.02 day1 [44,50]
    τ 2.8 days [44,52]
    μ0 0.001 day1 [44,50]

     | Show Table
    DownLoad: CSV

    From (2.2), the steady state Q(t)Q is given by the equation

    (β(Q)+κ)Q+(2eμτ+(1eμτ)q(μ1))β(Q)Q=0.

    Obviously, there is a zero solution Q=0. When the proliferation rate β(Q) is a decrease function, there is a positive steady state Q>0 if and only if the condition

    β0>κ2eμτ1+(1eμτ)q(μ1)β1>0 (3.1)

    is satisfied, and the steady state is given by the root of

    β(Q)=κ2eμτ1+(1eμτ)q(μ1). (3.2)

    From (3.1), there exists a positive steady state when the recombination rate q(μ1) satisfies

    κ(β0+β1)(1eμτ)<q(μ1)+2eμτ11eμτ<κβ1(1eμτ). (3.3)

    Specifically, if

    q(μ1)+2eμτ11eμτ<κ(β0+β1)(1eμτ), (3.4)

    the system has only zero solution steady state, and the zero solution is global stable which means the situation of no cells; and if

    q(μ1)+2eμτ11eμτ>κβ1(1eμτ), (3.5)

    the zero solution is unstable and all positive solutions approach to +, which means the situation of uncontrolled cell growth.

    Next, we consider the stability of the steady states. Let x(t)=Q(t)Q and linearize the equation (2.2) at x=0, we obtain

    dxdt=ax+bxτ, (3.6)

    where

    a=β(Q)+κ+β(Q)Q,b=[2eμτ+(1eμτ)q(μ1)][β(Q)+β(Q)Q].

    The zero solution of equation (3.6) is stable if and only if the coefficients a and b take values from the region S defined as

    S={(a,b)R2|asecωτ<b<a,where ω=atanωτ,a>1τ,ω(0,πτ)}. (3.7)

    For the zero solution Q(t)Q=0, we have

    a=β0+κ>0, b=(2eμτ+(1eμτ)q(μ1))β0>0.

    Hence, the zero solution is stable if and only if b<a, i.e., the inequality (3.4) is satisfied.

    For the positive steady state Q(t)=Q>0, we have

    a=ˉβ+κˆβ, b=(2eμτ+(1eμτ)q(μ1))(ˉβˆβ), (3.8)

    where ˉβ=β(Q)>0 and ˆβ=β(Q)Q>0. Hence, when the condition (3.1) is satisfied, the equation (3.7) gives the Hopf bifurcation curve for the positive steady state

    {ˆβcrit=[2eμτ+(1eμτ)q(μ1)](secωτ1)2eμτsecωτ+(1eμτ)q(μ1)ˉβ,ω=ˉβ[2eμτ+(1eμτ)q(μ1)][2eμτ1+(1eμτ)q(μ1)]2eμτsecωτ+(1eμτ)q(μ1)tanωτ, (3.9)

    where ω can be solved from the second equation of (3.9), and

    ω[1τarccos12eμτ+(1eμτ)q(μ1),πτ]. (3.10)

    When ˆβ<ˆβcrit, the positive steady state solution of equation (2.2) is stable, and when ˆβ>ˆβcrit, the steady state becomes unstable. Biologically, the Hopf bifurcation curve (3.9) gives the critical proliferation rate ˆβcrit, so that the steady state is stable when the proliferation rate is less than the critical rate, but when the proliferation rate is larger than the critical rate, the steady state becomes unstable and the system exhibits oscillatory dynamics, which can be a source of dynamical blood diseases [42].

    In summary, we have the following conclusion:

    Theorem 1. Consider the model equation (2.2), where β(Q) (β0>β(Q)>β1) is a decrease function, and 0q(μ1)<1. The equation always has zero steady state Q(t)0; if and only if the condition

    β0>κ2eμτ1+(1eμτ)q(μ1))β1>0 (3.11)

    is satisfied, equation (2.2) has a unique positive steady state solution Q(t)=Q, which is given by

    β(Q)=κ2eμτ1+(1eμτ)q(μ1)). (3.12)

    Moreover,

    (1) the zero steady state is stable if and only if

    q(μ1)+2eμτ11eμτ<κ(β0+β1)(1eμτ); (3.13)

    (2) when (3.11) is satisfied and let ˉβ=β(Q), ˆβ=β(Q)Q, for any μ1>0, there is a critical proliferation rate ˆβcrit>0, defined by (3.9), so that the positive steady state is stable if and only if ˆβ<ˆβcrit.

    When the functions β(Q) and q(μ1) are defined by (2.4), equation (3.2) gives

    ˉβ=κf,f=2eμτ1+(1eμτ)q(μ1), (3.14)

    and

    ˆβ=β(Q)Q=n(ˉββ1)(1ˉββ1β0). (3.15)

    Applying the default parameter values in Table 1, when μ1 varies from 0 to 1.2, the critical proliferation rate ˆβcrit (black line, given by (3.9)) and proliferation rate at the steady state ˆβ (red line, given by (3.15)) are shown in Figure 2(a). Here, ˆβ>ˆβcrit implies the parameter region with unstable steady state, and there are oscillatory solutions due to Hopf bifurcation (Figure 2(b)).

    Figure 2.  Bifurcation analysis of the model system. (a) Dependence of the bifurcation curve ˆβcrit (black line) in equation (3.9) and ˆβ (red line) in equation (3.15) on the parameter μ1. (b) Sample dynamics of cell population. Different color lines are obtained from different μ1 values (same color dots in (a)): μ1=0.1(blue line), μ1=0.3(green line), μ1=0.5(magenta line), and μ1=1.1(black line). Other values are the same as default values in Table 1. In simulations, we first set the parameters as their default values, Q(t)0.5 for t<0, and solve the equation to t=300 day.

    From Figure 2(a), when the drug dose is low, we have ˆβ<ˆβcrit, and (2.2) has a stable positive steady state (Figure 2(b), blue line). The steady state cell number depends on the dose μ1, and reach a local minimum when μ1 takes intermediate values (green dot in Figure 2(a), also referred to Figure 3). When the drug dose further increase to a high level (black dot), the steady state of (2.2) becomes unstable, and the cell populations show oscillatory dynamics (Figure 2(b), black line).

    Figure 3.  Dependence of the steady state Q with chemotherapy dose μ1. Black lines show the steady state, with solid line for the stable steady state, and dashed line for the unstable steady state. Red lines show the upper and lower bounds of the oscillation solutions when the steady state is unstable.

    From the above analyses, when

    f=2eμτ1+(1eμτ)q(μ1)>0, β1<κf<β0+β1, (3.16)

    the equation (2.2) has a unique positive steady state Q(t)=Q. Moreover, let ˉβ=β(Q), then ˉβ=κ/f, and

    0<ˉββ1<β0.

    Hence, the steady state can be expressed explicitly as

    Q=θnβ0ˉββ11. (3.17)

    Equation (3.17) shows that the steady state Q is dependent on the chemotherapy dose parameter μ1 through ˉβ=κ/f. The following theorem shows that under certain conditions, there is an optimal dose (within a tolerated dose) so that the steady state cell number reach a local minimum.

    Theorem 3.2. Consider the equation (2.2), if the following conditions are satisfied

    (1) the functions β(Q) and q(μ1) are continuous, and satisfy

    β0+β1>β(Q)>β10, 1q(μ1)0, β(Q)<0, q(μ1)>0,

    (2) the parameters (β0,β1,κ,μ0, and τ) satisfy the condition (3.16) (here we note μ=μ0+μ1),

    (3) both q(0) and q(0) are sufficiently small,

    (4) there exists μ1>0 so that conditions (1)-(2) are satisfied when μ1(0,μ1), and

    q(μ1)+q(μ1)τ1(e(μ0+μ1)τ1)>2,

    the steady state Q reaches a local minimum value at an optimal dose μ1=ˆμ1(0,μ1).

    Proof. When the conditions (1) and (2) are satisfied, equation (2.2) has a unique positive steady state Q(t)Q, which is given by (3.17). Hence, we have

    dQdμ1=θn(β0ˉββ11)1n1β0(ˉββ1)2dˉβdμ1=θn(β0ˉββ11)1n1β0(ˉββ1)2κf2dfdμ1=θn(β0ˉββ11)1n1β0κ(ˉββ1)2f2dfdμ1,

    and

    dfdμ1=τeμτ(q(μ1)+q(μ1)τ1(eμτ1)2). (3.18)

    Hence, the sign of dQdμ1 is determined by the sign of dfdμ1.

    The condition (3) implies dfdμ1|μ1=0<0, and condition (4) implies dfdμ1|μ1=μ1>0. Hence, there exists an optimal value ˆμ1(0,μ1), so that dQdμ1|μ1=ˆμ1=0, thus Q reaches a local minimum value at μ1=ˆμ1.

    Figure 3 shows the dependence of steady state with the dose μ1 when we take parameters from Table 1, which exhibits a local minimum at about ˆμ1=0.3. Here we note that the steady state cell number Q decrease with further increasing of μ1>0.5 and approaches zero when μ1 is large enough. However, clinically, higher level μ1 may exceed the maximum tolerated dose, and have a risk to induce oscillatory dynamics (Figure 2, and the discussion below). Hence, there is an optimal dose within a certain region (for example, μ1<0.5) so that the cell number reaches a relative low level.

    Above analyses show that chemotherapy may induce oscillatory dynamics through Hopf bifurcation when μ1 takes proper values. Here, we further analyze the condition for Hopf bifurcation, and identify how clinical conditions may affect the chemotherapy-induced oscillations [46]. Hematopoiesis can exhibit oscillations in one or several circulating cell types and show symptoms of periodic hematological diseases [43,53]. Here, we show the conditions to induce oscillations, and try to identify the criteria to avoid therapy-induced oscillations in cancer treatments.

    Using the previously introduced notations ˉβ and f in (3.14), the bifurcation curve (3.9) can be rewritten as

    {ˆβcrit=(f+1)(secωτ1)f+1secωτˉβ,ω=ˉβf(f+1)tanωτf+1secωτ, (3.19)

    and hence

    ˆβcrit=ω1cosωτfsinωτ. (3.20)

    Moreover, from equation (3.15), we have

    ˉβ=κf,ˆβ=β(Q)Q=n(κfβ1)(1κ/fβ1β0). (3.21)

    Hence, from (3.19)–(3.21), and the bifurcation condition ˆβcrit=ˆβ, we obtain the bifurcation curve in terms of f and κ (defined by a parameter ω>0) as

    {ω1cosωτfsinωτ=n(κfβ1)(1κ/fβ1β0),ω=κ(f+1)tanωτf+1secωτ. (3.22)

    Thus, given the parameter β0,β1,n,τ, equation (3.22) defines a bifurcation curve in the κ-f plane when ω varies over the region in (3.10).

    Figure 4 shows the bifurcation curves obtained from (3.22). For any κ>0, there exist an upper bound ¯f and a lower bound f_, so that the positive steady state (if exists) is stable when f_<f<¯f. Moreover, when the self-sustained proliferation rate β1 increases, the lower bound f_ is independent of β1, while the upper bound ¯f decreases with β1. Here, we note that f depends on the dose parameter μ1 through (3.14), these results provide a strategy to quantitatively control the chemotherapy dose to avoid therapy-induced oscillation, i.e., try to take values from the gray region for different differentiation rate κ.

    Figure 4.  Hopf bifurcation curve in the κ-f plane. The black solid lines are obtained from (3.22) with β0=0, the blue dashed line is obtained from (3.22) with β1=0.05. Gray shadow shows the parameter region of stable steady state.

    The era of chemotherapy has been ruled by the routine use of dose-intense protocols based on the "maximum-tolerate dose" concept. This protocol plays a prominent role in veterinary oncology, however there are many debates on using the high dose chemotherapy because of the side effects and recurrence rates [54]. Chromosome recombination induced by chemotherapy is a source to produce chaotic genome in cancer cells and may lead to drug resistance. Here, we present a mathematical model to consider cell population dynamics in response to chemotherapy with occasional occurrence of chromosome recombination. Model analyses show that maximum-tolerate dose may not always result in the best outcome when the probability of chromosome recombination is dependent on the dose; there is an optimal dose within a tolerated dose so that the steady state tumor cell number reaches a relative low level. Moreover, sustained administration of high dose chemotherapy may induced oscillatory cell population dynamics through Hopf bifurcation. Clinically, the long period oscillation can be considered as the frequent recurrence of tumor cells, which is a result of drug-resistant or chemotherapy-induced dynamical disease. For instance, the periodic chronic myelogenous leukemia show obvious oscillations in circulating blood cells [55]. We identify the parameter regions for the occurrence of oscillation dynamics, which is valuable when we try to avoid the frequent recurrence. To our knowledge, this is the first try to quantitatively study the tumor cell population dynamics in response to chemotherapy when chromosome recombination is induced. Genome chaotic has been widely reported in studies of genomic structure of cancer cells, however how genome chaotic play roles in cancer development and drug resistance is not well documented. The current study is the first try to consider this issue. Here, the proposed model only consider the main effect of cell survival from C-Frag through chromosome recombination. Nevertheless, many other effects should be included for a complete understanding of drug resistance due to the chromosome changes induced by cancer therapy. Moreover, the cell heterogeneity can also play important roles in drug resistance. These effects should be extended to the current model in order to obtain an optimal dose of chemotherapy.

    This work was supported by grant from National Natural Science Foundation of China (91730301, 11762011).

    No potential conflicts of interest were disclosed.

    [1] Folk JE (1983) Mechanism and basis for specificity of transglutaminase-catalyzed e-(g-glutamyl) lysine bond formation. Adv Enzymol Relat Areas Mol Biol 54: 1-56.
    [2] Lorand L, Conrad SM (1984) Transglutaminases. Mol Cell Biochem 58: 9-35. doi: 10.1007/BF00240602
    [3] Piacentini M, Martinet N, Beninati S, et al. (1988) Free and protein conjugated-polyamines in mouse epidermal cells. Effect of high calcium and retinoic acid. J Biol Chem 263: 3790-3794.
    [4] Song Y, Kirkpatrick LL, Schilling AB, et al. (2013) Transglutaminase and polyamination of tubulin: posttranslational modification for stabilizing axonal microtubules. Neuron 78: 109-123. doi: 10.1016/j.neuron.2013.01.036
    [5] Achyuthan KE, Greenberg CS (1987) Identification of a guanosine triphosphate-binding site on guinea pig liver transglutaminase. Role of GTP and calcium ions in modulating activity. J Biol Chem 262: 1901-1906.
    [6] Hasegawa G, Suwa M, Ichikawa Y, et al. (2003) A novel function of tissue-type transglutaminase: protein disulfide isomerase. Biochem J 373: 793-803. doi: 10.1042/bj20021084
    [7] Lahav J, Karniel E, Bagoly Z, et al. (2009) Coagulation factor XIII serves as protein disulfide isomerase. Thromb Haemost 101: 840-844.
    [8] Iismaa SE, Mearns BM, Lorand L, et al. (2009) Transglutaminases and disease: lessons from genetically engineered mouse models and inherited disorders. Physiol Rev 89: 991-1023. doi: 10.1152/physrev.00044.2008
    [9] Smethurst PA, Griffin M (1996) Measurement of tissue transglutaminase activity in a permeabilized cell system: its regulation by calcium and nucleotides. Biochem J 313: 803-808. doi: 10.1042/bj3130803
    [10] Nakaoka H, Perez DM, Baek KJ, et al. (1994) Gh: a GTP-binding protein with transglutaminase activity and receptor signalling function. Science 264: 1593-1596.
    [11] Gentile V, Porta R, Chiosi E, et al. (1997) Tissue transglutaminase and adenylate cyclase interactions in Balb-C 3T3 fibroblast membranes. Biochim Biophys Acta 1357: 115-122. doi: 10.1016/S0167-4889(97)00024-4
    [12] Nanda N, Iismaa SE, Owens WA, et al. (2001) Targeted inactivation of Gh/tissue transglutaminase II. J Biol Chem 276: 20673-20678. doi: 10.1074/jbc.M010846200
    [13] Mian S, El Alaoui S, Lawry J, et al. (1995) The importance of the GTP binding protein tissue transglutaminase in the regulation of cell cycle progression. FEBS Lett 370: 27-31. doi: 10.1016/0014-5793(95)00782-5
    [14] Olaisen B, Gedde-Dahl TJR, Teisberg P, et al. (1985) A structural locus for coagulation factor XIIIA (F13A) is located distal to the HLA region on chromosome 6p in man. Am J Hum Genet 37: 215-220.
    [15] Yamanishi K, Inazawa J, Liew F-M, et al. (1992) Structure of the gene for human transglutaminase 1. J Biol Chem 267: 17858-17863.
    [16] Gentile V, Davies PJA, Baldini A (1994) The human tissue transglutaminase gene maps on chromosome 20q12 by in situ fluorescence hybridization. Genomics 20: 295-297.
    [17] Wang M, Kim IG, Steinert PM, et al. (1994) Assignment of the human transglutaminase 2 (TGM2) and transglutaminase 3 (TGM3) genes to chromosome 20q11.2. Genomics 23: 721-722.
    [18] Gentile V, Grant F, Porta R, et al. (1995) Human prostate transglutaminase is localized on chromosome 3p21.33-p22 by in situ fluorescence hybridization. Genomics 27: 219-220.
    [19] Grenard P, Bates MK, Aeschlimann D (2001) Evolution of transglutaminase genes: identification of a transglutaminases gene cluster on human chromosome 15q. Structure of the gene encoding transglutaminase X and a novel gene family member, transglutaminase Z. J Biol Chem 276: 33066-33078.
    [20] Thomas H, Beck K, Adamczyk M, et al. (2013) Transglutaminase 6: a protein associated with central nervous system development and motor function. Amino Acids 44: 161-177. doi: 10.1007/s00726-011-1091-z
    [21] Bailey CDC, Johnson GVW (2004) Developmental regulation of tissue transglutaminase in the mouse forebrain. J Neurochem 91: 1369-1379. doi: 10.1111/j.1471-4159.2004.02825.x
    [22] Kim SY, Grant P, Lee JHC, et al. (1999) Differential expression of multiple transglutaminases in human brain. Increased expression and cross-linking by transglutaminase 1 and 2 in Alzheimer's disease. J Biol Chem 274: 30715-30721.
    [23] lannaccone M, Giuberti G, De Vivo G, et al. (2013) Identification of a FXIIIA variant in human neuroblastoma cell lines. Int J Biochem Mol Biol 4: 102-107.
    [24] Citron BA, Santa Cruz KS, Davies PJ, et al. (2001) Intron-exon swapping of transglutaminase mRNA and neuronal tau aggregation in Alzheimer's disease. J Biol Chem 276: 3295-3301. doi: 10.1074/jbc.M004776200
    [25] De Laurenzi V, Melino G (2001) Gene disruption of tissue transglutaminase. Mol Cell Biol 21: 148-155.
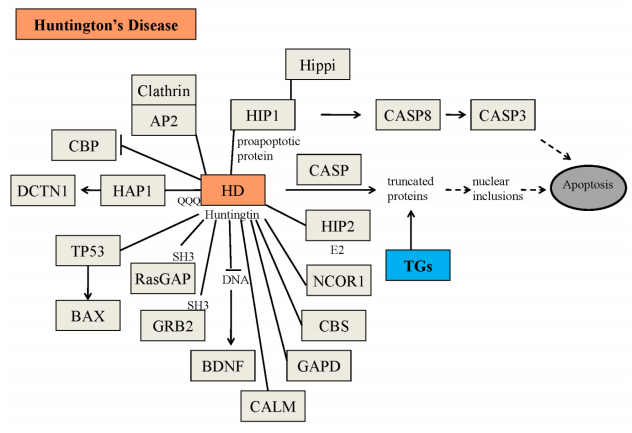
    [26] Mastroberardino PG, Iannicola C, Nardacci R, et al. (2002) 'Tissue' transglutaminase ablation reduces neuronal death and prolongs survival in a mouse model of Huntington's disease. Cell Death Differ 9: 873-880.
    [27] Lorand L, Graham RM (2003) Transglutaminases: crosslinking enzymes with pleiotropic functions. Nature Mol Cell Biol 4: 140-156. doi: 10.1038/nrm1014
    [28] Wolf J, Jäger C, Lachmann I, et al. (2013) Tissue transglutaminase is not a biochemical marker for Alzheimer's disease. Neurobiol Aging 34: 2495-2498. doi: 10.1016/j.neurobiolaging.2013.05.008
    [29] Wilhelmus MMM, Drukarch B (2014) Tissue transglutaminase is a biochemical marker for Alzheimer's disease. Neurobiol Aging 35: 3-4.
    [30] Wolf J, Jäger C, Morawski M, et al. (2014) Tissue transglutaminase in Alzheimer's disease-facts and fiction: a reply to "Tissue transglutaminase is a biochemical marker for Alzheimer's disease". Neurobiol Aging 35: 5-9.
    [31] Adams RD, Victor M (1993) Principles of Neurology.
    [32] Selkoe DJ, Abraham C, Ihara Y (1982) Alzheimer's disease: insolubility of partially purified paired helical filaments in sodium dodecyl sulfate and urea. Proc Natl Acad Sci USA 79: 6070-6074. doi: 10.1073/pnas.79.19.6070
    [33] Grierson AJ, Johnson GV, Miller CC (2001) Three different human isoforms and rat neurofilament light, middle and heavy chain proteins are cellular substrates for transglutaminase. Neurosci Lett 298: 9-12. doi: 10.1016/S0304-3940(00)01714-6
    [34] Singer SM, Zainelli GM, Norlund MA (2002) Transglutaminase bonds in neurofibrillary tangles and paired helical filament t early in Alzheimer's disease. Neurochem Int 40: 17-30. doi: 10.1016/S0197-0186(01)00061-4
    [35] Halverson RA, Lewis J, Frausto S, et al. (2005) Tau protein is cross-linked by transglutaminase in P301L tau transgenic mice. J Neurosci 25: 1226-33. doi: 10.1523/JNEUROSCI.3263-04.2005
    [36] Jeitner TM, Matson WR, Folk JE, et al. (2008) Increased levels of g-glutamylamines in Huntington disease CSF. J Neurochem 106: 37-44. doi: 10.1111/j.1471-4159.2008.05350.x
    [37] Dudek SM, Johnson GV (1994) Transglutaminase facilitates the formation of polymers of the beta-amyloid peptide. Brain Res 651: 129-33. doi: 10.1016/0006-8993(94)90688-2
    [38] Hartley DM, Zhao C, Speier AC, et al. (2008) Transglutaminase induces protofibril-like amyloid b protein assemblies that are protease-resistant and inhibit long-term potentiation. J Biol Chem 283: 16790-16800. doi: 10.1074/jbc.M802215200
    [39] Citron BA, Suo Z, SantaCruz K, et al. (2002) Protein crosslinking, tissue transglutaminase, alternative splicing and neurodegeneration. Neurochem Int 40: 69-78. doi: 10.1016/S0197-0186(01)00062-6
    [40] Junn E, Ronchetti RD, Quezado MM, et al. (2003) Tissue transglutaminase-induced aggregation of a-synuclein: Implications for Lewy body formation in Parkinson's disease and dementia with Lewy bodies. Proc Natl Acad Sci USA 100: 2047-2052. doi: 10.1073/pnas.0438021100
    [41] Zemaitaitis MO, Lee JM, Troncoso JC, et al (2000) Transglutaminase-induced cross-linking of tau proteins in progressive supranuclear palsy. J Neuropathol Exp Neurol 59: 983-989. doi: 10.1093/jnen/59.11.983
    [42] Zemaitaitis MO, Kim SY, Halverson RA, et al. (2003) Transglutaminase activity, protein, and mRNA expression are increased in progressive supranuclear palsy. J Neuropathol Exp Neurol 62: 173-184. doi: 10.1093/jnen/62.2.173
    [43] Iuchi S, Hoffner G, Verbeke P, et al. (2003) Oligomeric and polymeric aggregates formed by proteins containing expanded polyglutamine. Proc Natl Acad Sci USA 100: 2409-2414. doi: 10.1073/pnas.0437660100
    [44] 
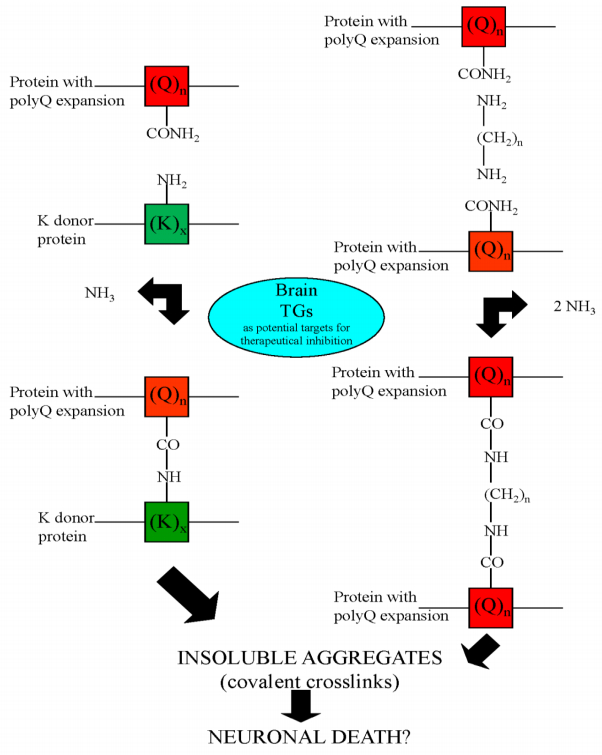
Gentile V, Sepe C, Calvani M, et al. (1998) Tissue transglutaminase-catalyzed formation of high-molecular-weight aggregates in vitro is favored with long polyglutamine domains: a possible mechanism contributing to CAG-triplet diseases. Arch Biochem Biophys 352: 314-321. doi: 10.1006/abbi.1998.0592
    [45] Kahlem P, Green H, Djian P (1998) Transglutaminase action imitates Huntington's disease: selective polymerization of huntingtin containing expanded polyglutamine. Mol Cell 1: 595-601. doi: 10.1016/S1097-2765(00)80059-3
    [46] Karpuj MV, Garren H, Slunt H, et al (1999) Transglutaminase aggregates huntingtin into nonamyloidogenic polymers, and its enzymatic activity increases in Huntington's disease brain nuclei. Proc Natl Acad Sci USA 96: 7388-7393. doi: 10.1073/pnas.96.13.7388
    [47] Segers-Nolten IM, Wilhelmus MM, Veldhuis G, et al. (2008) Tissue transglutaminase modulates α-synuclein oligomerization. Protein Sci 17: 1395-1402. doi: 10.1110/ps.036103.108
    [48] Lai TS, Tucker T, Burke JR, et al. (2004) Effect of tissue transglutaminase on the solubility of proteins containing expanded polyglutamine repeats. J Neurochem 88: 1253-1260. doi: 10.1046/j.1471-4159.2003.02249.x
    [49] Konno T, Mori T, Shimizu H, et al. (2005) Paradoxical inhibition of protein aggregation and precipitation by transglutaminase-catalyzed intermolecular cross-linking. J Biol Chem 280: 17520-17525. doi: 10.1074/jbc.M413988200
    [50] The Huntington's Disease Collaborative Research Group (1993) A novel gene containing a trinucleotide repeat that is expanded and unstable on Huntington's disease chromosome. Cell 72: 971-983. doi: 10.1016/0092-8674(93)90585-E
    [51] Banfi S, Chung MY, Kwiatkowski TJ, et al. (1993) Mapping and cloning of the critical region for the spinocerebellar ataxia type 1 gene (SCA1) in a yeast artificial chromosome contig spanning 1.2 Mb. Genomics 18: 627-635. doi: 10.1016/S0888-7543(05)80365-9
    [52] Sanpei K, Takano H, Igarashi S, et al. (1996) Identification of the spinocerebellar ataxia type 2 gene using a direct identification of repeat expansion and cloning technique, DIRECT. Nat Genet 14: 277-284. doi: 10.1038/ng1196-277
    [53] Pujana MA, Volpini V, Estivill X (1998) Large CAG/CTG repeat templates produced by PCR, usefulness for the DIRECT method of cloning genes with CAG/CTG repeat expansions. Nucleic Acids Res 1: 1352-1353.
    [54] Fletcher CF, Lutz CM, O'Sullivan TN, et al. (1996) Absence epilepsy in tottering mutant mice is associated with calcium channel defects. Cell 87: 607-617. doi: 10.1016/S0092-8674(00)81381-1
    [55] Vincent JB, Neves-Pereira ML, Paterson AD, et al. (2000) An unstable trinucleotide-repeat region on chromosome 13 implicated in spinocerebellar ataxia: a common expansion locus. Am J Hum Genet 66: 819-829. doi: 10.1086/302803
    [56] Holmes SE, O'Hearn E, Margolis RL (2003) Why is SCA12 different from other SCAs? Cytogenet Genome Res 100: 189-197. doi: 10.1159/000072854
    [57] Imbert G, Trottier Y, Beckmann J, et al. (1994) The gene for the TATA binding protein (TBP) that contains a highly polymorphic protein coding CAG repeat maps to 6q27. Genomics 21: 667-668. doi: 10.1006/geno.1994.1335
    [58] La Spada AR, Wilson EM, Lubahn DB, et al. (1991) Androgen receptor gene mutations in X-linked spinal and bulbar muscular atrophy. Nature 352: 77-79. doi: 10.1038/352077a0
    [59] Onodera O, Oyake M, Takano H, et al. (1995) Molecular cloning of a full-length cDNA for dentatorubral-pallidoluysian atrophy and regional expressions of the expanded alleles in the CNS. Am J Hum Genet 57: 1050-1060.
    [60] Cooper AJL, Sheu K-FR, Burke JR, et al. (1999) Pathogenesis of inclusion bodies in (CAG)n/Qn-expansion diseases with special reference to the role of tissue transglutaminase and to selective vulnerability. J Neurochem 72: 889-899.
    [61] Hadjivassiliou M, Maki M, Sanders DS, et al. (2006) Autoantibody targeting of brain and intestinal transglutaminase in gluten ataxia. Neurology 66: 373-377. doi: 10.1212/01.wnl.0000196480.55601.3a
    [62] Boscolo S, Lorenzon A, Sblattero D, et al. (2010) Anti transglutaminase antibodies cause ataxia in mice. Plos One 5: e9698. doi: 10.1371/journal.pone.0009698
    [63] Stamnaes J, Dorum S, Fleckenstein B, et al. (2010) Gluten T cell epitope targeting by TG3 and TG6; implications for dermatitis herpetiformis and gluten ataxia. Amino Acids 39: 1183-1191. doi: 10.1007/s00726-010-0554-y
    [64] Lerner A, Matthias T (2016) GUT-the Trojan horse in remote organs' autoimmunity. J Clin Cell Immunol 7: 401.
    [65] Matthias T, Jeremias P, Neidhofer S, et al. (2016) The industrial food additive microbial transglutaminase, mimics the tissue transglutaminase and is immunogenic in celiac disease patients. Autoimmun Rev 15: 1111-1119. doi: 10.1016/j.autrev.2016.09.011
    [66] Lerner A, Neidhofer S, Matthias T (2015) Transglutaminase 2 and anti transglutaminase 2 autoantibodies in celiac disease and beyond: Part A: TG2 double-edged sword: gut and extraintestinal involvement. Immunome Res 11: 101-105.
    [67] Wakshlag JJ, Antonyak MA, Boehm JE, et al. (2006) Effects of tissue transglutaminase on beta-amyloid 1-42-induced apoptosis. Protein J 25: 83-94. doi: 10.1007/s10930-006-0009-1
    [68] Lee JH, Jeong J, Jeong EM, et al. (2014) Endoplasmic reticulum stress activates transglutaminase 2 leading to protein aggregation. Int J Mol Med 33: 849-855. doi: 10.3892/ijmm.2014.1640
    [69] Grosso H, Woo JM, Lee KW, et al. (2014) Transglutaminase 2 exacerbates α-synuclein toxicity in mice and yeast. FASEB J 28: 4280-4291. doi: 10.1096/fj.14-251413
    [70] Zhang J, Wang S, Huang W, et al. (2016) Tissue transglutaminase and its product isopeptide are increased in Alzheimer's disease and APPswe/PS1dE9 double transgenic mice brains. Mol Neurobiol 53: 5066-5078. doi: 10.1007/s12035-015-9413-x
    [71] Wilhelmus MM, De JM, Smit AB, et al (2016) Catalytically active tissue transglutaminase colocalises with Ab pathology in Alzheimer's disease mouse models. Sci Rep 6: 20569. doi: 10.1038/srep20569
    [72] Wilhelmus MMM, De JM, Rozemuller AJM, et al. (2012) Transglutaminase 1 and its regulator Tazarotene-induced gene 3 localize to neuronal tau inclusions in tauopathies. J Pathol 226: 132-142. doi: 10.1002/path.2984
    [73] Basso M, Berlin J, Xia L, et al. (2012) Transglutaminase inhibition protects against oxidative stress-induced neuronal death downstream of pathological ERK activation. J Neurosci 39: 6561-6569.
    [74] Lee J, Kim YS, Choi DH, et al. (2004) Transglutaminase 2 induces nuclear factor-kB activation via a novel pathway in BV-2 microglia. J Biol Chem 279: 53725-53735. doi: 10.1074/jbc.M407627200
    [75] Kumar S, Mehta K (2012) Tissue transglutaminase constitutively activates HIF-1a promoter and nuclear factor-kB via a non-canonical pathway. Plos One 7: e49321
    [76] Lu S, Saydak M, Gentile V, et al. (1995) Isolation and characterization of the human tissue transglutaminase promoter. J Biol Chem 270: 9748-9755. doi: 10.1074/jbc.270.17.9748
    [77] Ientile R, Currò M, Caccamo D (2015) Transglutaminase 2 and neuroinflammation. Amino Acids 47: 19-26. doi: 10.1007/s00726-014-1864-2
    [78] Griffith OW, Larsson A, Meister A (1977) Inhibition of g-glutamylcysteine synthetase by cystamine: an approach to a therapy of 5-oxoprolinuria (pyroglutamic aciduria). Biochem Biophys Res Commun 79: 919-925. doi: 10.1016/0006-291X(77)91198-6
    [79] Igarashi S, Koide R, Shimohata T, et al. (1998) Suppression of aggregate formation and apoptosis by transglutaminase inhibitors in cells expressing truncated DRPLA protein with an expanded polyglutamine stretch. Nat Genet 18: 111-117. doi: 10.1038/ng0298-111
    [80] Karpuj MV, Becher MW, Springer JE, et al. (2002) Prolonged survival and decreased abnormal movements in transgenic model of Huntington disease, with administration of the transglutaminase inhibitor cystamine. Nat Med 8: 143-149.
    [81] Dedeoglu A, Kubilus JK, Jeitner TM, et al. (2002) Therapeutic effects of cystamine in a murine model of Huntington's disease. J Neurosci 22: 8942-8950.
    [82] Lesort M, Lee M, Tucholski J, et al. (2003) Cystamine inhibits caspase activity. Implications for the treatment of polyglutamine disorders. J Biol Chem 278: 3825-3830.
    [83] Dubinsky R, Gray C (2006) CYTE-I-HD: Phase I Dose Finding and Tolerability Study of Cysteamine (Cystagon) in Huntington's Disease. Movement Disord 21: 530-533. doi: 10.1002/mds.20756
    [84] Langman CB, Greenbaum LA, Sarwal M, et al. (2012) A randomized controlled crossover trial with delayed-release cysteamine bitartrate in nephropathic cystinosis: effectiveness on white blood cell cystine levels and comparison of safety. Clin J Am Soc Nephrol 7: 1112-1120. doi: 10.2215/CJN.12321211
    [85] Besouw M, Masereeuw R, Van DHL, et al. (2013) Cysteamine: an old drug with new potential. Drug Discov Today 18: 785-792. doi: 10.1016/j.drudis.2013.02.003
    [86] Hadjivassiliou M, Aeschlimann P, Strigun A, et al. (2008) Autoantibodies in gluten ataxia recognize a novel neuronal transglutaminase. Ann Neurol 64: 332-343. doi: 10.1002/ana.21450
    [87] Krasnikov BF, Kim SY, McConoughey SJ, et al. (2005) Transglutaminase activity is present in highly purified nonsynaptosomal mouse brain and liver mitochondria. Biochemistry 44: 7830-7843. doi: 10.1021/bi0500877
    [88] Menalled LB, Kudwa AE, Oakeshott S, et al. (2014) Genetic deletion of transglutaminase 2 does not rescue the phenotypic deficits observed in R6/2 and zQ175 mouse models of Huntington's disease. Plos One 9: e99520-e99520. doi: 10.1371/journal.pone.0099520
    [89] Bailey CD, Johnson GV (2005) Tissue transglutaminase contributes to disease progression in the R6/2 Huntington's disease mouse model via aggregate-independent mechanisms. J Neurochem 92: 83-92. doi: 10.1111/j.1471-4159.2004.02839.x
    [90] Davies JE, Rose C, Sarkar S, et al. (2010) Cystamine suppresses polyalanine toxicity in a mouse model of oculopharyngeal muscular dystrophy. Sci Transl Med 2: 34-40.
    [91] Keillor JW, Apperley KYP (2016) Transglutaminase inhibitors: a patent review. Expert Opin Ther Pat 26: 49-63. doi: 10.1517/13543776.2016.1115836
    [92] Song M, Hwang H, Im CY, et al. (2017) Recent progress in the development of Transglutaminase 2 (TGase2) inhibitors. J Med Chem 60: 554-567. doi: 10.1021/acs.jmedchem.6b01036
    [93] Pietsch M, Wodtke R, Pietzsch J, et al. (2013) Tissue transglutaminase: An emerging target for therapy and imaging. Bioorg Med Chem Lett 23: 6528-6543. doi: 10.1016/j.bmcl.2013.09.060
    [94] Bhatt MP, Lim YC, Hwang J, et al. (2013) C-peptide prevents hyperglycemia-induced endothelial apoptosis through inhibition of reactive oxygen species-mediated transglutaminase 2 activation. Diabetes 62: 243-253. doi: 10.2337/db12-0293
  • This article has been cited by:

    1. Haifeng Zhang, Meirong Zhang, Jinzhi Lei, A mathematical model with aberrant growth correction in tissue homeostasis and tumor cell growth, 2023, 86, 0303-6812, 10.1007/s00285-022-01837-w
    2. Lingling Li, Mengyao Shao, Xingshi He, Shanjing Ren, Tianhai Tian, Risk of lung cancer due to external environmental factor and epidemiological data analysis, 2021, 18, 1551-0018, 6079, 10.3934/mbe.2021304
    3. Ling Xue, Hongyu Zhang, Xiaoming Zheng, Wei Sun, Jinzhi Lei, Treatment of melanoma with dendritic cell vaccines and immune checkpoint inhibitors: A mathematical modeling study, 2023, 00225193, 111489, 10.1016/j.jtbi.2023.111489
  • Reader Comments
  • © 2017 the Author(s), licensee AIMS Press. This is an open access article distributed under the terms of the Creative Commons Attribution License (http://creativecommons.org/licenses/by/4.0)
通讯作者: 陈斌, bchen63@163.com
  • 1. 

    沈阳化工大学材料科学与工程学院 沈阳 110142

  1. 本站搜索
  2. 百度学术搜索
  3. 万方数据库搜索
  4. CNKI搜索

Metrics

Article views(6029) PDF downloads(973) Cited by(1)

Figures and Tables

Figures(5)  /  Tables(3)

/

DownLoad:  Full-Size Img  PowerPoint
Return
Return

Catalog