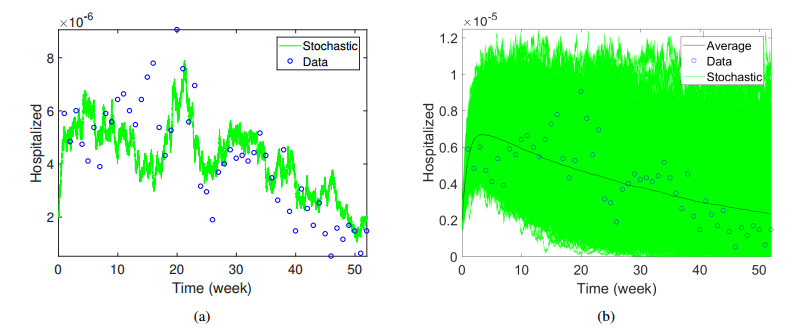
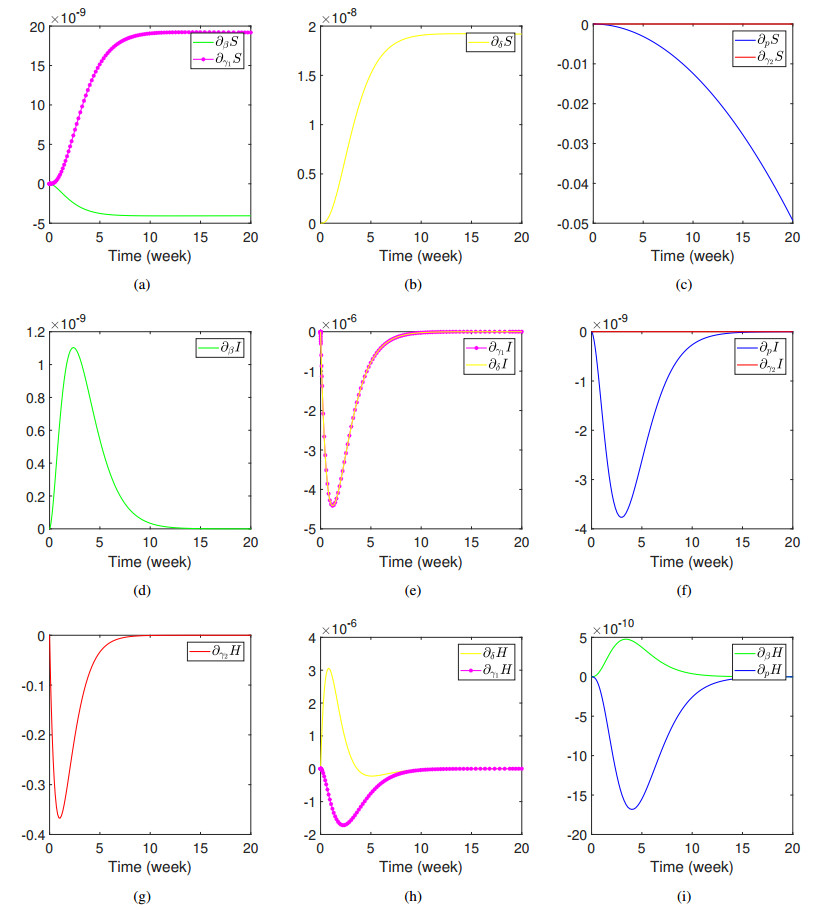
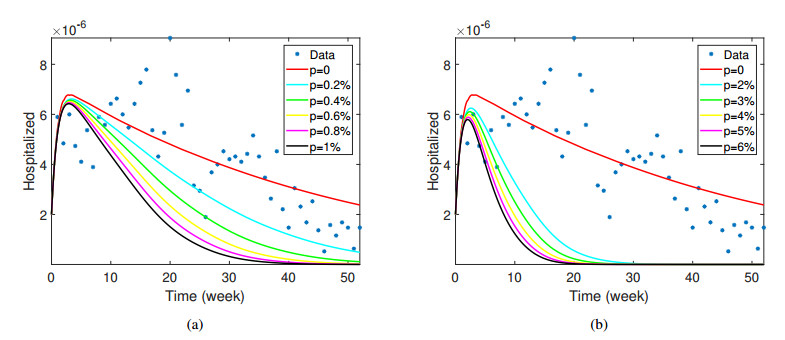
Measles is a contagious disease caused by the measles virus of genus Morbillivirus, which has been spreading in many affected regions. This infection is characterized by the appearance of rashes all over the body and potentially cause serious complications, especially among infants and children. Before measles immunization was promoted, it is one of the endemic diseases that caused the most fatalities each year in the world. This paper aims to analyze and to investigate measles transmission in Jakarta via an SIHR epidemic model involving vaccination from January to December 2017. Jakarta Health Office collected the observed data of measles incidence. We then derived the basic reproduction number as a threshold of disease transmission and obtained the local as well as global stability of the equilibria under certain conditions. The unobserved parameters and initial conditions were estimated by minimizing errors between data and numerical results. Furthermore, a stochastic model was developed to capture the data and to accommodate the randomness of the transmission. Sensitivity analysis was also performed to analyze and to identify the parameters which give significant contributions to the spread of the virus. We then obtained simulations of vaccine level coverage. The data is shown within a 95% confidence interval of the stochastic solutions, and the average of the stochastic solutions is relatively close to the solution of the deterministic model. The most sensitive parameter in the infected compartment is the hospitalized rate, which can be considered to be one of the essential factors to reduce the number of cases for policymakers. We hence proposed a control strategy which is providing treatment accesses easier for infected individuals is better than vaccinating when an outbreak occurs.
Citation: Muhammad Fakhruddin, Dani Suandi, Sumiati, Hilda Fahlena, Nuning Nuraini, Edy Soewono. Investigation of a measles transmission with vaccination: a case study in Jakarta, Indonesia[J]. Mathematical Biosciences and Engineering, 2020, 17(4): 2998-3018. doi: 10.3934/mbe.2020170
Measles is a contagious disease caused by the measles virus of genus Morbillivirus, which has been spreading in many affected regions. This infection is characterized by the appearance of rashes all over the body and potentially cause serious complications, especially among infants and children. Before measles immunization was promoted, it is one of the endemic diseases that caused the most fatalities each year in the world. This paper aims to analyze and to investigate measles transmission in Jakarta via an SIHR epidemic model involving vaccination from January to December 2017. Jakarta Health Office collected the observed data of measles incidence. We then derived the basic reproduction number as a threshold of disease transmission and obtained the local as well as global stability of the equilibria under certain conditions. The unobserved parameters and initial conditions were estimated by minimizing errors between data and numerical results. Furthermore, a stochastic model was developed to capture the data and to accommodate the randomness of the transmission. Sensitivity analysis was also performed to analyze and to identify the parameters which give significant contributions to the spread of the virus. We then obtained simulations of vaccine level coverage. The data is shown within a 95% confidence interval of the stochastic solutions, and the average of the stochastic solutions is relatively close to the solution of the deterministic model. The most sensitive parameter in the infected compartment is the hospitalized rate, which can be considered to be one of the essential factors to reduce the number of cases for policymakers. We hence proposed a control strategy which is providing treatment accesses easier for infected individuals is better than vaccinating when an outbreak occurs.

| [1] | D. N. Durrheim, P. M. Strebel, Measles vaccine still saves children's lives, Lancet, 385 (2015), 327. |
| [2] |
M. M. Van Den Ent, D. W. Brown, E. J. Hoekstra, A. Christie, S. L. Cochi, Measles mortality reduction contributes substantially to reduction of all cause mortality among children less than five years of age, 1990-2008, J. Infect. Dis., 204 (2011), S18-S23. doi: 10.1093/infdis/jir081

|
| [3] | World Health Organization, Global measles and rubella strategic plan: 2012, 2012. |
| [4] |
W. Lixia, Z. Guang, L. A. Lee, Y. Zhiwei, Y. Jingjin, Z. Jun, et al., Progress in accelerated measles control in the people's republic of china, 1991-2000, J. Infect. Dis. 187 (2003), S252-S257. doi: 10.1086/368045
|
| [5] |
R.-Q. Zhang, H.-B. Li, F.-Y. Li, L.-X. Han, Y.-M. Xiong, Epidemiological characteristics of measles from 2000 to 2014: Results of a measles catch-up vaccination campaign in xianyang, china, J. Infect. Public Health, 10 (2017), 624-629. doi: 10.1016/j.jiph.2017.02.005
|
| [6] |
W. J. Moss, D. E. Griffin, Global measles elimination, Nat. Rev. Microbiol., 4 (2006), 900. doi: 10.1038/nrmicro1550
|
| [7] |
R. M. Anderson, R. M. May, Immunisation and herd immunity, Lancet, 335 (1990), 641-645. doi: 10.1016/0140-6736(90)90420-A
|
| [8] |
F. Magurano, M. Baggieri, F. Mazzilli, P. Bucci, A. Marchi, L. Nicoletti, et al., Measles in italy: Viral strains and crossing borders, Int. J. Infect. Dis., 79 (2019), 199-201. doi: 10.1016/j.ijid.2018.11.005
|
| [9] | R. de Vries, W. Duprex, R. de Swart, Morbillivirus infections: an introduction, 2015. |
| [10] | World Health Organization, Measles factsheet, 2017. Available from: http://www.who.int/mediacentre/factsheets/fs286/en/. |
| [11] | World Health Organization, Measles. vaccine-preventable diseases, 2018. Available from: https://www.who.int/immunization/monitoring_surveillance/burden/vpd/WHO_SurveillanceVaccinePreventable_11_Measles_R1.pdf?ua=1. |
| [12] | N. Deivanayagam, N. Mala, S. Shaffi Ahamed, V. Jagadish Shankar, Measles associated diarrhea and pneumonia in south india, Indian Pediatr., 31 (1994), 35-35. |
| [13] |
P. A. Gastanaduy, E. Banerjee, C. DeBolt, P. Bravo-Alcántara, S. A. Samad, D. Pastor, et al., Public health responses during measles outbreaks in elimination settings: Strategies and challenges, Hum. Vaccin. Immunother., 14 (2018), 2222-2238. doi: 10.1080/21645515.2018.1474310
|
| [14] | R. M. Casey, Global routine vaccination coverage, 2015, MMWR. Morbidity and mortality weekly report 65. |
| [15] | World Health Organization, Global vaccine action plan. geneva, switzerland, 2012. Available from: http://apps.who.int/iris/bitstream/10665/78141/1/. |
| [16] | K.K.R. Indonesia, Status campak dan rubella saat ini di indoneia, 2018. Available from: http://www.searo.who.int/indonesia/topics/immunization/mr_measles_status.pdf |
| [17] | D.K.P.D. Jakarta, Profil kesehatan provinsi dki jakarta tahun 2016 2016. Available from: https://www.depkes.go.id/resources/download/profil/PROFIL_KES_PROVINSI_2016/11_DKI_Jakarta_2016.pdf |
| [18] |
D. Ntirampeba, I. Neema, L. Kazembe, Modelling spatial patterns of misaligned disease data: An application on measles incidence in namibia, Clin. Epidemiol. Global Health, 5 (2017), 190-195. doi: 10.1016/j.cegh.2017.01.002
|
| [19] |
Z. Bai, D. Liu, Modeling seasonal measles transmission in china, Commun. Nonlinear Sci. Numer. Simul., 25 (2015), 19-26. doi: 10.1016/j.cnsns.2014.09.030
|
| [20] |
M. Farman, M. U. Saleem, A. Ahmad, M. Ahmad, Analysis and numerical solution of seir epidemic model of measles with non-integer time fractional derivatives by using laplace adomian decomposition method, Ain Shams Eng. J., 9 (2018), 3391-3397. doi: 10.1016/j.asej.2017.11.010
|
| [21] | A. Momoh, M. Ibrahim, I. Uwanta, S. Manga, Mathematical model for control of measles epidemiology, Int. J. Pure Appl. Math., 87 (2013), 707-717. |
| [22] |
S. Verguet, M. Johri, S. K. Morris, C. L. Gauvreau, P. Jha, M. Jit, Controlling measles using supplemental immunization activities: a mathematical model to inform optimal policy, Vaccine, 33 (2015), 1291-1296. doi: 10.1016/j.vaccine.2014.11.050
|
| [23] | O. Peter, O. Afolabi, A. Victor, C. Akpan, F. Oguntolu, Mathematical model for the control of measles, J. Appl. Sci. Environ. Manage., 22 (2018), 571-576. |
| [24] | M. of Health Republic of Indonesia, Info datin 2018. Available from: https://www.kemkes.go.id/folder/view/01/structure-publikasi-pusdatin-info-datin.html |
| [25] | D.J.H. Office, Laporan evaluasi pemegang program campak dinas kesehatan provinsi dki jakarta tahun 2019 2019. Available from: https://dinkes.jakarta.go.id/ |
| [26] |
F. Brauer, The kermack-mckendrick epidemic model revisited, Math. Biosci., 198 (2005), 119-131. doi: 10.1016/j.mbs.2005.07.006
|
| [27] | Badan Pusat Statistik, Indikator strategis nasional 2018. Available from: https://www.bps.go.id/QuickMap?id=0000000000 |
| [28] | Ministry of Health, Vaccine effectiveness 2018. Available from: https://www.health.govt.nz/our-work/preventative-health-wellness/immunisation/vaccine-effectiveness |
| [29] | J. P. LaSalle, The stability of dynamical systems, Vol. 25, Siam, 1976. |
| [30] | J. V. Uspensky, G. Pandit, Theory of equations, Tata McGraw-Hill Education, 1948. |
| [31] |
L. Esteva, C. Vargas, Analysis of a dengue disease transmission model, Math. Biosci., 150 (1998), 131-151. doi: 10.1016/S0025-5564(98)10003-2
|
| [32] | L. J. Allen, An introduction to stochastic epidemic models, in: Mathematical epidemiology, Springer, Berlin, Heidelberg, 2008, pp. 81-130. |
| [33] | L. J. Allen, An introduction to stochastic processes with applications to biology, CRC Press, 2010. |
| [34] |
T. G. Kurtz, Strong approximation theorems for density dependent markov chains, Stoch. Process. Their Appl., 6 (1978), 223-240. doi: 10.1016/0304-4149(78)90020-0
|
| [35] | R. Rockenfeller, M. Günther, S. Schmitt, T. Götz, Comparative sensitivity analysis of muscle activation dynamics, Comput. Math. Methods Med., 2015 (2015). |
| [36] | P. Lopalco, R. Martin, Measles still spreads in europe: who is responsible for the failure to vaccinate?, Euro. Surveill., 153 (2010), 19557. |
| [37] | L. Gram, S. Soremekun, A. ten Asbroek, A. Manu, M. O'Leary, Z. Hill, et al., Socio-economic determinants and inequities in coverage and timeliness of early childhood immunisation in rural g hana, Trop. Med. Int. Health, 3 (2014), 802-811. |
| [38] |
D. E. Sugerman, A. E. Barskey, M. G. Delea, I. R. Ortega-Sanchez, D. Bi, K. J. Ralston, et al., Measles outbreak in a highly vaccinated population, san diego, 2008: role of the intentionally undervaccinated, Pediatrics, 125 (2010), 747-755. doi: 10.1542/peds.2009-1653
|
| [39] |
S. S. Hutchins, R. Jiles, R. Bernier, Elimination of measles and of disparities in measles childhood vaccine coverage among racial and ethnic minority populations in the united states, J. Infect. Dis., 189 (2004), S146-S152. doi: 10.1086/379651
|
| [40] | I. P. du Châtelet, D. Antona, F. Freymuth, M. Muscat, F. Halftermeyer-Zhou, C. Maine, et al., Spotlight on measles 2010: Update on the ongoing measles outbreak in france, 2008-2010, Euro. Surveill., 15 (2010), 19656. |
| [41] |
A. S. Bates, F. D. Wolinsky, Personal, financial, and structural barriers to immunization in socioeconomically disadvantaged urban children, Pediatrics, 101 (1998), 591-596. doi: 10.1542/peds.101.4.591
|
| [42] |
L. F. Yeung, P. Lurie, G. Dayan, E. Eduardo, P. H. Britz, S. B. Redd, et al., A limited measles outbreak in a highly vaccinated us boarding school, Pediatrics, 116 (2005), 1287-1291. doi: 10.1542/peds.2004-2718
|
| [43] |
E. Simons, M. Ferrari, J. Fricks, K. Wannemuehler, A. Anand, A. Burton, et al., Assessment of the 2010 global measles mortality reduction goal: results from a model of surveillance data, Lancet, 379 (2012), 2173-2178. doi: 10.1016/S0140-6736(12)60522-4
|
| [44] |
M. Muscat, Who gets measles in europe? J. Infect. Dis., 204 (2011), S353-S365. doi: 10.1093/infdis/jir067
|
| [45] |
P. Pronyk, A. Sugihantono, V. Sitohang, T. Moran, S. Kadandale, S. Muller, et al., Vaccine hesitancy in indonesia, Lancet Planet. Health, 3 (2019), e114-e115. doi: 10.1016/S2542-5196(18)30287-0
|
Figures(7) / Tables(2)

Muhammad Fakhruddin, Dani Suandi, Sumiati, Hilda Fahlena, Nuning Nuraini, Edy Soewono. Investigation of a measles transmission with vaccination: a case study in Jakarta, Indonesia[J]. Mathematical Biosciences and Engineering, 2020, 17(4): 2998-3018. doi: 10.3934/mbe.2020170


 DownLoad: