
Citation: Martin O. Steinhauser. Multiscale modeling, coarse-graining and shock wave computer simulations in materials science[J]. AIMS Materials Science, 2017, 4(6): 1319-1357. doi: 10.3934/matersci.2017.6.1319
[1] | Huafei Di, Yadong Shang, Jiali Yu . Existence and uniform decay estimates for the fourth order wave equation with nonlinear boundary damping and interior source. Electronic Research Archive, 2020, 28(1): 221-261. doi: 10.3934/era.2020015 |
[2] | Yi Cheng, Ying Chu . A class of fourth-order hyperbolic equations with strongly damped and nonlinear logarithmic terms. Electronic Research Archive, 2021, 29(6): 3867-3887. doi: 10.3934/era.2021066 |
[3] | Ibtissam Issa, Zayd Hajjej . Stabilization for a degenerate wave equation with drift and potential term with boundary fractional derivative control. Electronic Research Archive, 2024, 32(8): 4926-4953. doi: 10.3934/era.2024227 |
[4] | Xu Liu, Jun Zhou . Initial-boundary value problem for a fourth-order plate equation with Hardy-Hénon potential and polynomial nonlinearity. Electronic Research Archive, 2020, 28(2): 599-625. doi: 10.3934/era.2020032 |
[5] | Shuting Chang, Yaojun Ye . Upper and lower bounds for the blow-up time of a fourth-order parabolic equation with exponential nonlinearity. Electronic Research Archive, 2024, 32(11): 6225-6234. doi: 10.3934/era.2024289 |
[6] | Gongwei Liu . The existence, general decay and blow-up for a plate equation with nonlinear damping and a logarithmic source term. Electronic Research Archive, 2020, 28(1): 263-289. doi: 10.3934/era.2020016 |
[7] | Xiaoqiang Dai, Chao Yang, Shaobin Huang, Tao Yu, Yuanran Zhu . Finite time blow-up for a wave equation with dynamic boundary condition at critical and high energy levels in control systems. Electronic Research Archive, 2020, 28(1): 91-102. doi: 10.3934/era.2020006 |
[8] | Yang Liu, Wenke Li . A family of potential wells for a wave equation. Electronic Research Archive, 2020, 28(2): 807-820. doi: 10.3934/era.2020041 |
[9] | Hami Gündoğdu . RETRACTED ARTICLE: Impact of damping coefficients on nonlinear wave dynamics in shallow water with dual damping mechanisms. Electronic Research Archive, 2025, 33(4): 2567-2576. doi: 10.3934/era.2025114 |
[10] | Liangliang Li . Chaotic oscillations of 1D wave equation with or without energy-injections. Electronic Research Archive, 2022, 30(7): 2600-2617. doi: 10.3934/era.2022133 |
It has been almost two years since the outbreak of COVID-19. A large number of international research results have given us a certain understanding of the virus. This is a severe respiratory illness caused by the coronavirus [1,2]. The International Committee on Taxonomy of viruses named the virus SARS-CoV-2 is mainly transmitted through respiratory tract. The clinical symptoms of infected people are mostly fever, dry cough and fatigue, and some patients are asymptomatic infected people. When the disease is serious, it will also cause organ failure and even death [3,4].
Currently, the COVID-19 pandemic is still ongoing. According to the latest outbreak of the World Health Organization, as of October 2021, there were more than 70 million newly confirmed cases in Europe [5]. The United Kingdom is one of the worst-affected countries in Europe, with more than 8 million cumulative cases, of which more than 7 million were diagnosed in England alone [6], accounting for 85% of the total cumulative cases reported in the United Kingdom.
Since more than 80% of confirmed cases in Britain are concentrated in England, we intend to do some theoretical research based on the data of England for the reference of government decision-making. Figure 1 shows the daily new cases data of COVID-19 epidemic in England during 2020 [6]. In early March, due to the obvious increase of new cases, the British government began to implement the first large-scale social blockade at the end of March and gradually unsealed at the beginning of June. This phase corresponds to the phase in which the first small peak appears in Figure 1. In the three months after the first unsealing, the epidemic situation in the region had been relatively gentle. However, since September, the number of new cases per day had increased significantly. By the end of October, the number of new cases per day had reached about 20000.At this time, the British government once again announced that it would implement the second large-scale social blockade on November 5, which lasted until December 2nd. Soon after the second unsealing, the third wave of more large-scale epidemic began, and there were reports that a mutant virus with stronger transmission ability was detected, and the epidemic reached a stage that was difficult to control. On December 20th, Britain ushered in the third social blockade, which lasted until February 2021.
H. Ward et al. based on antibody levels in 365,000 people, showed that at the start of the second wave of infections in England, only 4.4% of adults had IgG antibodies detected using text for lateral flow immunoassay (LFIA) [7]. A study on the antibody positive rate of asymptomatic and symptomatic infected people in Wanzhou District of Chongqing by Quanxin Long et al showed that after 8 weeks of infection, the antibody concentration of more than 90% of the participants decreased by more than 70% [8]. A study on the neutralizing antibody level of SARS-CoV-2 patients within three months after infection found that after analyzing the serum samples of 65 SARS-CoV-2 infected patients, 95% of the cases had seroconversion [9]. Some researchers found that the antibody titers of the two virus strains decreased significantly, and the delta variant virus strain decreased more significantly than the wild strain [10,11,12]. The infectious disease dynamics model is a key tool for studying the spread of infectious diseases. It is generally divided into four compartments, susceptible (S), exposed (E), infected (I) and recovered (R) compartments. It can clearly describe the dynamic relationship between various warehouses in the process of virus transmission, and give relatively accurate predictions on the development trend of infectious diseases. P. Wintachai [13] et al. predicted the change trend of COVID-19 cases over time by establishing SEIR infectious disease dynamics model considering different vaccination rates. A. Fuady [14] et al. established an infectious disease dynamics model considering different vaccination times to explore the inhibitory effect of changes in vaccination time on the spread of covid-19 epidemics. M. Angeli et. al. [15] et al introduced SAIVR mathematical model to forecast the covid-19 epidemic evolution during the vaccination campaign by employing a semi-supervised machine learning process. S. Zhai [16] et al. studied an SEIR-type epidemic model with time delay and vaccination control, the vaccination strategy was expressed as a state delayed feedback which was related to the current and previous state of the epidemic model and investigated the non-negativity and boundedness of the model. J. Medina [17] et al. modeled a trustable and reliable management system based on block chain for vaccine distribution by extending the SEIR model, which included prevention measures such as mask-wearing, social distancing, vaccination rate, and vaccination efficiency. A. Karabay [18] et al. presented a particle-based SEIR epidemic simulator as a tool to assess the impact of different vaccination strategies on viral propagation and to model sterilizing and effective immunization outcomes and the simulator included modules to support contact tracing of the interactions amongst individuals and epidemiological testing of the general population. J. Wieland [19] et al. developed a model for the simulation of the SARS Cov-2 spread in Germany in the context of a complementary course at the Leuphana University. It tried to simulate different scenarios of the number of cases with the help of ODE. Chen [20] et al. used compartmental models to model and analyze the COVID-19 dynamics of different considered populations as susceptible, exposed, infected and rcovered compartments (SEIR). They derived control-oriented compartmental models of the pandemic, together with constructive control laws based on the Lyapunov theory. Antibody levels decrease over time after a person recovers from COVID-19, there will be a chance of re-infection with the virus. In the first model, we explore the impact of declining antibody levels on the spread of the COVID-19 epidemic in the UK, taking into account that a certain proportion of recoveries would become susceptible again. In the optimized model, we add the vaccinated compartment and study the impact of the vaccine's effect on the outbreak.
This study selects the daily new data of the COVID-19 epidemic in England from September 1 to October 31, 2020 as the data for model fitting, that is, the data in the middle and early stages of the second wave of the epidemic in England. Based on these possible factors: 1) The first wave of the epidemic has ended, and the level of antibodies in the infected people began to decline; 2) The British government did not have any intervention policy during this period; 3) There was no vaccination during this period; Therefore we used data for this time period when considering the impact of declining antibody levels on the spread of COVID-19 in this model.
Because the spread of COVID-19 has a long incubation period and the incubation period is contagious, in our model, we consider the incubation period and adopt the SEIR model. We divide the total population N into four categories: susceptible (S), exposed (E), infected (I), and recovered (R). β is the rate of disease transmission, σ is the conversion rate from exposed people to infected people, γ is the disease recovery rate, μ is the mortality due to disease, and P is the conversion rate from recovered group to susceptible group. The SEIR infectious disease dynamics model considering the decline of antibody level is shown in Figure 2.
According to the above COVID-19 spread diagram, we establish the infectious disease dynamics model as follows:
{dS/dt=−βS(E+I)+PR,dE/dt=βS(E+I)−σE,dI/dt=σE−(μ+γ)I,dR/dt=γI−PR. | (2.1) |
We obtain, when I=0, the disease-free equilibrium point of model (2.1) is E01=(S0,0,0,0).When I≠0, the endemic equilibrium point of model (2.1) is
E1∗=(S0R0,γ+μσI∗,I∗,γPI∗),I∗≠0. |
The basic reproduction number refers to the average number of secondary cases after an infected individual enters the susceptible population [21], the next generation matrix is the most commonly used method to calculate the basic reproduction number.
In order to calculate the basic reproduction number of model (2.1), we take
F=(βS(E+I)0),V=(σE−σE+(γ+μ)I). |
The Jacobian matrices of F and V are
F=(βSβS00),V=(σ0−σγ+μ). |
At disease-free equilibrium, we obtain
FV−1|E01=(βS0σ+βS0γ+μβS0γ+μ00). |
The basic reproduction number R0 is the spectral radius of FV−1|E01, so the expression is
R0=βS0(σ+γ+μ)σ(γ+μ). |
Theorem 1. When R0<0, model (2.1) is stable at the disease-free equilibrium point, otherwise unstable.
Proof. The Jacobian matrix of model (2.1) at E01 is
J|E01=(0−βS0−βS000βS0−σβS000σ−(γ+μ)000γ−P). |
The matrix eigenvalue satisfies the following formula:
|λE−J|E01|=|λβS0βS000λ−βS0+σ−βS000−σλ+γ+μ000−γλ+P|=λ(λ+P)[λ2+(σ+γ+μ−βS0)λ+σ(γ+μ)−βS0(σ+γ+μ)]. |
Obviously λ1=0,λ2=−P<0, the other two eigenvalues λ3,λ4 satisfy the equation
P(λ)=λ2+a1λ+a2=0, |
where
a1=σ+γ+μ−βS0,a2=σ(γ+μ)−βS0(σ+γ+μ). |
Easy to know
βS0σ+γ+μ=R0σ(γ+μ)(σ+γ+μ)2<1, |
therefore,
a1=σ+γ+μ−βS0>0,a2=σ(γ+μ)−βS0(σ+γ+μ)=σ(γ+μ)(1−R0). |
So, when R0<1, we obrain a1>0 and a2>0. According to Hurwitz discriminant method, the characteristic roots λ3,λ4 of P(λ) have negative real parts.
To sum up, among the eigenvalues of the Jacobian matrix of model (2.1), the real part of four eigenvalues is negative and one is zero. So, when R0<1, model (2.1) is stable at the disease-free equilibrium point, otherwise unstable.
Antibody levels decline over time, and herd immunity approaches that rely on natural immunity become unfeasible. Therefore, on the basis of the above model (2.1), we add the vaccination compartment (people who were successfully vaccinated) to establish the SEIRV model. In this model, we consider daily vaccination of susceptible populations at a fixed vaccination rate and explore the impact of varying injection and failure rates on the outbreak in England. The propagation mechanism of the model is shown in the Figure 3. Here α refers to the daily proportion of vaccination, ω is the vaccine failure rate and refers to the reciprocal of the duration of vaccine effectiveness. The other parameters are the same of model (2.1).
According to the above COVID-19 diagram, the infectious disease dynamics model we established is
{dS/dt=−αS−(1−α)βS(E+I)+PR+ωV,dE/dt=(1−α)βS(E+I)−σE,dI/dt=σE−(γ+μ)I,dR/dt=γI−PR,dV/dt=αS−ωV. | (3.1) |
Let
{−αS−(1−α)βS(E+I)+PR+ωV=0,(1−α)βS(E+I)−σE=0,σE−(γ+μ)I=0,γI−PR=0,αS−ωV=0. |
When I=0, there are
S=S0,E=0,R=0,V=αS0ω. |
The disease-free equilibrium point of model (3.1) is
E02=(S0,0,0,0,αS0ω). |
When I≠0, we obtain
S∗=S0R0,E∗=γ+μσI∗,R∗=γPI∗,V∗=αS0ωRC. |
Therefore, the endemic equilibrium point of model (3.1) is
E2∗=(S0RC,γ+μσI∗,I∗,γPI∗,αS0ωRC),I∗≠0. |
The number of controlled reproduction refers to the number of people who can be infected by an infected person during the infection period under certain prevention and control measures [22]. It is also calculated by the method of next generation matrix.
In order to calculate the control reproduction number of model (3.1), we take
F=((1−α)βS(E+I)0),V=(σE−σE+(γ+μ)I). |
The Jacobian matrices of F and V are
F=((1−α)βS(1−α)βS00),V=(σ0−σγ+μ). |
At disease-free equilibrium, there is
FV−1|E02=((1−α)βS0σ+(1−α)βS0γ+μ(1−α)βS0γ+μ00). |
The control reproduction number is the spectral radius of FV−1|E02, and the expression is
RC=(1−α)βS0(σ+γ+μ)σ(γ+μ). |
Theorem 2. When RC<1, the model (3.1) is locally asymptotically stable at the disease-free equilibrium point, otherwise it is unstable.
Proof. The Jacobian matrix of model (3.1) at E02 is
J|E02=(−α−(1−α)βS0−(1−α)βS0Pω0(1−α)βS0−σ(1−α)βS0000σ−(γ+μ)0000γ−P0α000−ω). |
The matrix eigenvalue satisfies the following formula:
|λE−J|E02|=|λ+α(1−α)βS0(1−α)βS0−P−ω0λ−(1−α)βS0+σ−(1−α)βS0000−σλ+γ+μ0000−γλ+P0−α000λ+ω|=(λ+P)[λ2+(α+ω)λ+2αω]{λ2+[σ+γ+μ−(1−α)βS0]λ+σ(γ+μ)−(1−α)βS0(σ+γ+μ)}. |
Obviously λ1=−P<0, the other eigenvalues λ2,λ3 satisfy the equation
P1(λ)=λ2+A1λ+A2, |
where
A1=ω+α,A2=2ωα. |
We obtain
Δ1=1>0,Δ2=|A110A2|=|ω+α102ωα|>0, |
which means λ2 and λ3 have negative real parts. The last two eigenvalues λ4,λ5 satisfy the equation
P2(λ)=λ2+B1λ+B2, |
where
B1=σ+γ+μ−(1−α)βS0,B2=σ(γ+μ)−(1−α)βS0(σ+γ+μ). |
So, when RC<1, we obrain B1>0 and B2>0. According to Hurwitz discriminant method, the characteristic roots λ4 and λ5 have negative real parts.
To sum up, all eigenvalues of the Jacobian matrix of model (3.1) have negative real parts, so model (3.1) is locally asymptotically stable at the disease-free equilibrium point, otherwise it is unstable.
According to model (2.1), the number of new cases per day in England from September 1 to October 31 is fitted by the nonlinear least squares method, and the fitting result is shown in Figure 4. Within the allowable range of error, we set the initial value of the susceptible as S0=55699400, the initial value of exposed people as E0=6500, the initial value of infected people as I0=1041, meaning the number of new cases in England on September 1, and the initial value of recovered people as 200. The conversion rate from exposed people to infected people is σ=1/12(day−1) [23], the recovery rate of disease is γ=1/14(day−1) [24] and the mortality rate is μ=0.003 [25], which are selected according to the actual transmission of infectious diseases. And we obtain the transmission rate is β=1.1295×10⁻⁹ and the conversion rate from the recovered group to susceptible group is P=1.8888×10⁻⁶ by fitting.
The fitting results of the improved SEIR model are in good agreement with the England data, and can better reflect the growth trend of the COVID-19 epidemic in England.
In the SEIRV model (3.1), α refers to the daily vaccination rate, which is further explained here. The overall immunization rates corresponding to different daily vaccination rates (60 days after vaccination) is shown in Figure 5. The total population of England is about 50 million, α=0.005 means that 250,000 people are vaccinated on the first day. After 60 days of continuous vaccination, the overall immunization rate is 25.9%.
In SEIRV model, the meaning of vaccine failure rate ω refers to the reciprocal of the duration of vaccine effectiveness, that is, each corresponds to a duration of vaccine effectiveness. The data details are shown in Table 1.
Vaccine failure rates | Vaccine effective time period (days) |
0 | FOREVER |
0.001 | 1000 |
0.002 | 500 |
0.003 | 333 |
0.004 | 250 |
0.005 | 200 |
0.006 | 167 |
0.007 | 143 |
0.008 | 125 |
0.009 | 111 |
0.01 | 100 |
0.02 | 50 |
0.03 | 33 |
0.04 | 25 |
0.05 | 20 |
In order to evaluate the role of vaccines in epidemic control, we investigate the impact of different vaccination rates and failure rates on the spread of COVID-19 epidemic in England. We change the vaccine failure rate when the fixed vaccination rate is 0.005, and simulate the impact of different failure rates on the spread of COVID-19 epidemic in England. The results are shown in Figures 6–8. In Figure 6, the failure rates are taken from 0 to 0.01 in steps of 0.001; in Figure 7, the failure rate is taken from 0.01 to 0.05 in steps of 0.01; in Figure 8, the failure rate is taken from 0.01 to 0.02 in steps of 0.001. As can be seen from Figures 6–8, with the decrease of vaccine failure rate, the peak of epidemic situation will gradually decrease. When the failure rate is less than 0.01, the peak time will advance with the decrease of failure rate; when the failure rate is greater than 0.01, the peak time will be delayed with the decrease of failure rate. If only Figures 6 and 7 are used to illustrate that 0.01 is the boundary value of peak time trend change, it may be coincidental because the failure rate less than 0.01 is taken as the step of 0.001, and the failure rate greater than 0.01 is taken as the step of 0.01. Therefore, we further take the failure rate from 0.01 to 0.02 in steps of 0.001 for simulation, as shown in Figure 8. It can be seen from Figure 8 that the time of peak value is delayed with the decrease of failure efficiency. In general, when the step of failure rate change is 0.001, the simulation shows that when the fixed vaccination rate is 0.005, the peak of epidemic situation will decrease with the decrease of failure efficiency. When the failure rate is less than 0.01, the peak time will advance with the decrease of failure efficiency; when the failure rate is greater than 0.01, the peak time will be delayed with the decrease of failure efficiency. When the vaccination rate is 0.005, the line chart of the epidemic peak under different vaccine failure rates is shown in Figure 9. When the value of failure rate is large (greater than 0.02), the peak will increase significantly. When the failure rate is 0.001 the peak value is 81.4% lower than the peak value when the failure rate is 0.01, and when the failure rate is 0.01 the peak value is 89.5% lower than the peak value when the failure rate is 0.02. Therefore, the lower the vaccine failure rate, the lower the peak of the epidemic. The peak values under different failure rates are shown in Table 2.
Vaccine failure rates | Vaccine effective time period (days) | Peak value | Peak time (days) |
0 | FOREVER | 17126 | 101 |
0.001 | 1000 | 17934 | 106 |
0.002 | 500 | 18887 | 113 |
0.003 | 333 | 20032 | 121 |
0.004 | 250 | 21443 | 130 |
0.005 | 200 | 23244 | 143 |
0.006 | 167 | 25658 | 160 |
0.007 | 143 | 29159 | 187 |
0.008 | 125 | 35046 | 239 |
0.009 | 111 | 49967 | 435 |
0.01 | 100 | 96669 | 634 |
0.02 | 50 | 924,980 | 445 |
0.03 | 33 | 1,481,000 | 383 |
0.04 | 25 | 1,823,700 | 355 |
0.05 | 20 | 2,050,800 | 339 |
When the vaccination rate is 0.005, the line chart of the peak time of epidemic situation under different vaccine failure rates is shown in Figure 10. It can be seen when the failure rate is less than 0.01, the peak time will advance with the decrease of failure rate; when the failure rate is greater than 0.01, the peak time will be delayed with the decrease of failure rate. When the failure rate is 0.01, the peak time is 528 days later than that when the failure rate is 0.001 and 295 days later than that when the failure rate is 0.05. The peak time under different failure rates is shown in Table 2.
We also discuss the number of new cases per day at 30, 40, 50, 60 and 70 days in England with different failure rates when the vaccination rate is 0.005. The results are shown in Figure 11. It can be seen from the figure that at the same time, the smaller the failure rate, the fewer the number of cases. On the 60th day of vaccination, the vaccine with failure rate of 0.002 is 5.8% lower than the vaccine with failure rate of 0.01; on the 70th day of vaccination, the vaccine with failure rate of 0.002 is 9.1% lower than the vaccine with failure rate of 0.01. Therefore, with the extension of time, the vaccine with low failure rate is more effective in reducing the number of cases than the vaccine with high failure rate. The number of cases is shown in Table 3.
30 days | 40 days | 50 days | 60 days | 70 days | |
ω=0.002 | 8337 | 10214 | 12079 | 13862 | 15476 |
ω=0.006 | 8366 | 10305 | 12298 | 14307 | 16276 |
ω=0.010 | 8393 | 10390 | 12502 | 14720 | 17020 |
When the vaccination rate is 0.01, we discuss the impact of different vaccine failure rates on the spread of the epidemic in England, the results are shown in Figures 12–15. The simulation results show that the smaller the failure rate is, the lower the peak of epidemic situation is, and 0.019 is the boundary value of failure rate. When the failure rate is less than 0.019, the peak time will advance with the decrease of failure rate; when the failure rate is greater than 0.019, the peak time will be delayed with the decrease of failure rate. Some data are shown in Table 4.
failure rates | 0 | 0.005 | 0.01 | 0.015 | 0.019 | 0.02 | 0.021 |
Peak value | 8856 | 9452 | 10354 | 12125 | 38455 | 66507 | 101150 |
Peak time (days) | 54 | 62 | 75 | 110 | 979 | 956 | 892 |
When the vaccine failure rate is 0.005, the impact of different vaccination rates on the spread of the epidemic in England is shown in Figure 16. The vaccination rates change from 0.005 to 0.025 in steps of 0.005. According to the simulation, the peak of epidemic situation decreases with the increase of vaccination rate, and the peak time advances with the increase of vaccination rate. When the vaccination rate is 0.025, the peak value decrease by 74.8% and the peak time is 114 days earlier than that when the vaccination rate is 0.005. The result is given in Table 5.
Vaccination rate | 0.005 | 0.01 | 0.015 | 0.02 | 0.025 |
Peak value | 23244 | 9452 | 7269 | 6370 | 5857 |
Peak time (days) | 143 | 62 | 42 | 34 | 29 |
In order to comprehensively evaluate the effects of vaccination rate and failure rate on the peak infection cases and peak time, we add heat-maps for peak infection cases and peak times, the results are shown in Figures 17 and 18. The vaccination rates change from 0.002 to 0.005 in steps of 0.001 and the vaccine failure rates change from 0.001 to 0.01 in steps of 0.001.
The first part of this study is to develop an improved SEIR model of COVID-19 transmission in England taking into account the decline in antibody levels in recovers. In the second part, a SEIRV vaccination model is established on the basis of the decline in antibody levels, taking into account that susceptible populations are vaccinated at a fixed vaccination rate every day. We calculate the basic reproduction number of model (2.1) and the control reproduction number of model (3.1), calculate the disease-free equilibrium point and endemic equilibrium point of the two models, and analyze the stability of the model.
In the numerical simulation part, we further explain the vaccination rate and failure rate: α=0.005 means that 250,000 people are vaccinated every day on the basis of 50 million people in England, on the basis of this vaccination rate, the overall immunization rate is 25.9% after 60 days of continuous vaccination. In addition, the meaning of vaccine failure rate ω refers to the reciprocal of the duration of vaccine effectiveness, that is, each corresponds to a duration of vaccine effectiveness.
In model (3.1), we investigate the impact of different failure rates on the spread of the epidemic in England when the vaccination rates are 0.005 and 0.01. The results shows that when the fixed vaccination rate is 0.005, when the failure rate is 0.001, the peak value is 81.4% lower than that when the failure rate is 0.01, and when the failure rate is 0.01the peak value is 89.5% lower than that when the failure rate is 0.02. In addition, when the failure rate is 0.01, the peak time is 528 days later than when the failure rate is 0.001 and 295 days later than when the failure rate is 0.05. Therefore, the peak of epidemic situation will decrease with the decrease of failure efficiency. The peak time of the epidemic has two situations. When the failure rate is less than 0.01, the peak time will advance with the decrease of failure efficiency; when the failure rate is greater than 0.01, the peak time will be delayed with the decrease of failure efficiency. On the 60th day of vaccination, the vaccine with failure rate of 0.002 is 5.8% lower than the vaccine with failure rate of 0.01, on the 70th day of vaccination, the vaccine with failure rate of 0.002 is 9.1% lower than the vaccine with failure rate of 0.01. Therefore, with the extension of time, the vaccine with low failure rate is more effective in reducing the number of cases than the vaccine with high failure rate. When the fixed vaccination rate is 0.01, the peak of epidemic situation will decrease with the decrease of failure efficiency. When the failure rate is less than 0.019, the peak time will advance with the decrease of failure efficiency; when the failure rate is greater than 0.019, the peak time will be delayed with the decrease of failure efficiency. We also investigate the impact of different vaccination rates on the spread of the epidemic in England when the fixed vaccine failure rate is 0.005. The peak of epidemic situation decreases with the increase of vaccination rate, and the peak time is advanced with the increase of vaccination rate. When the vaccination rate is 0.025, the peak value decreases by 74.8% and the peak time is 114 days earlier than that when the vaccination rate was 0.005.
The rationality of the fitting value of P=1.8888×10⁻⁶. This fitting value refers to the level of antibody decline in the actual recovered patients, including not only the number of hospitalizations officially counted, but also the number of uncounted patients with moderate and mild symptoms, and the number of confirmed asymptomatic infections. This value is somewhat underestimated. If only the number of recovered patients in hospital is counted according to official data from the UK government, this fitted value may have practical significance. Antibody levels take longer to drop due to higher antibody levels in severely recovered patients [26].
In model (3.1), the meaning of the vaccine failure rate refers to the inverse of the effective duration of the vaccine, that is, the failure rate corresponds to the effective duration of an effective vaccine. The data details are shown in Table 1. Similarly, the vaccination rate corresponds to a time period in which vaccinations are completed, for example α=0.005 indicating that it takes 200 days to complete all vaccinations.
In the numerical simulation part, the peak always decreases as the vaccine failure rate decreases. Peak arrival times may be related to boundary values. When the failure rate is less than the boundary value, the peak time will advance as the failure rate decreases; when the failure rate is greater than the boundary value, the peak time will be delayed as the failure rate decreases. In this study, when the vaccination rate was 0.005, the boundary value for the failure rate was 0.01; when the vaccination rate was assumed to be 0.01, the boundary value for the failure rate was 0.019. The boundary values in this paper are based on the failure rate with a step size of 0.001, when we take a smaller step size for simulation, we may get more accurate failure rate boundary values.
Israel has one of the highest vaccination rates in the world [27]. On December 20, 2020, the country took the lead in launching the world's first universal vaccination program for COVID-19. According to the official website of the Israeli Ministry of Health [28], as of March 2, 2020, the proportion of Israel receiving one dose of the vaccine was 51.67%, and the proportion of receiving two doses of the new crown vaccine was 37.53%. By early August 2021, about 62% of Israel's 9.3 million population had received at least one dose of the vaccine, and about 58% had completed two doses. Israel, despite reaching such a high vaccination rate, saw a new peak of cases in early September 2021. According to the World Health Organization, on September 1, 2021, Israel recorded more than 10,000 new cases per day. By the end of August 2021, the vaccination rate in Singapore had reached 80%, and since September 2021, the number of new cases in Singapore has increased significantly, and by the end of October, there were more than 5,000 new cases in a single day.
This article explores the impact of different vaccine failure rates on the spread of the COVID-19 outbreak in the UK, given a certain vaccination rates. Although many countries have achieved high vaccination rates, and even theoretically achieved rates of herd immunity, from the data alone, vaccination does not seem to have a significant inhibitory effect on the epidemic in these countries. The reason may be that the mutated virus is difficult to deal with, or the vaccine is not as effective as expected. In the next article, we will use data from severe cases to assess vaccine efficacy and protection. Vaccination rates can be increased through government policies, but if the protection rate of the vaccine itself is not high, increasing the vaccination rate will not help to fundamentally control the epidemic.
This study was funded by Natural Science Foundation of China (NSFC 11901027, 11871093), the China Postdoctoral Science Foundation(2021M703426), Postgraduate Teaching Research and Quality Improvement Project of BUCEA (J2021010), BUCEA Post Graduate Innovation Project (2021098, 2021099). We thank all the individuals who generously shared their time and materials for this study.
The authors declare there is no conflict of interest.
[1] | Phillips RR (2001) Crystals, defects and microstructures: Modeling across scales, Cambridge: Cambridge University Press. |
[2] | Yip S (2005) Handbook of materials modeling, Berlin: Springer. |
[3] | Steinhauser MO (2017) Computational Multiscale Modeling of Fluids and Solids-Theory and Applications, 2nd Edition, Berlin: Springer. |
[4] |
McNeil PL, Terasaki M (2001) Coping with the inevitable: how cells repair a torn surface membrane. Nat Cell Biol 3: E124–E129. doi: 10.1038/35074652
![]() |
[5] | Schmidt M, Kahlert U, Wessolleck J, et al. (2014) Characterization of a setup to test the impact of high-amplitude pressure waves on living cells. Sci Rep 4: 3849. |
[6] |
Gambihler S, Delius M, Ellwart JW (1992) Transient increase in membrane permeability of L1210 cells upon exposure to lithotripter shock waves in vitro. Naturwissenschaften 79: 328–329. doi: 10.1007/BF01138714
![]() |
[7] | Gambihler S, Delius M, Ellwart JW (1994) Permeabilization of the plasma membrane of L1210 mouse leukemia cells using lithotripter shock waves. J Membrane Biol 141: 267–275. |
[8] | Kodama T, Doukas AG, Hamblin MR (2002) Shock wave-mediated molecular delivery into cells. BBA-Mol Cell Res 1542: 186–194. |
[9] |
Bao G, Suresh S (2003) Cell and molecular mechanics of biological materials. Nat Mater 2: 715–725. doi: 10.1038/nmat1001
![]() |
[10] |
Tieleman DP, Leontiadou H, Mark AE, et al. (2003) Simulation of Pore Formation in Lipid Bilayers by Mechanical Stress and Electric Fields. J Am Chem Soc 125: 6382–6383. doi: 10.1021/ja029504i
![]() |
[11] |
Sundaram J, Mellein BR, Mitragotri S (2003) An Experimental and Theoretical Analysis of Ultrasound-Induced Permeabilization of Cell Membranes. Biophys J 84: 3087–3101. doi: 10.1016/S0006-3495(03)70034-4
![]() |
[12] |
Doukas AG, Kollias N (2004) Transdermal drug delivery with a pressure wave. Adv Drug Deliver Rev 56: 559–579. doi: 10.1016/j.addr.2003.10.031
![]() |
[13] |
Coussios CC, Roy RA (2008) Applications of Acoustics and Cavitation to Noninvasive Therapy and Drug Delivery. Annu Rev Fluid Mech 40: 395–420. doi: 10.1146/annurev.fluid.40.111406.102116
![]() |
[14] |
Prausnitz MR, Langer R (2008) Transdermal drug delivery. Nat Biotechnol 26: 1261–1268. doi: 10.1038/nbt.1504
![]() |
[15] |
Ashley CE, Carnes EC, Phillips GK, et al. (2011) The targeted delivery of multicomponent cargos to cancer cells by nanoporous particle-supported lipid bilayers. Nat Mater 10: 389–397. doi: 10.1038/nmat2992
![]() |
[16] |
Koshiyama K, Wada S (2011) Molecular dynamics simulations of pore formation dynamics during the rupture process of a phospholipid bilayer caused by high-speed equibiaxial stretching. J Biomech 44: 2053–2058. doi: 10.1016/j.jbiomech.2011.05.014
![]() |
[17] |
Steinhauser MO (2016) On the Destruction of Cancer Cells Using Laser-Induced Shock-Waves: A Review on Experiments and Multiscale Computer Simulations. Radiol Open J 1: 60–75. doi: 10.17140/ROJ-1-110
![]() |
[18] | Krehl POK (2009) History of Shock Waves, Explosions and Impact: A Chronological and Biographical Reference, Berlin: Springer. |
[19] |
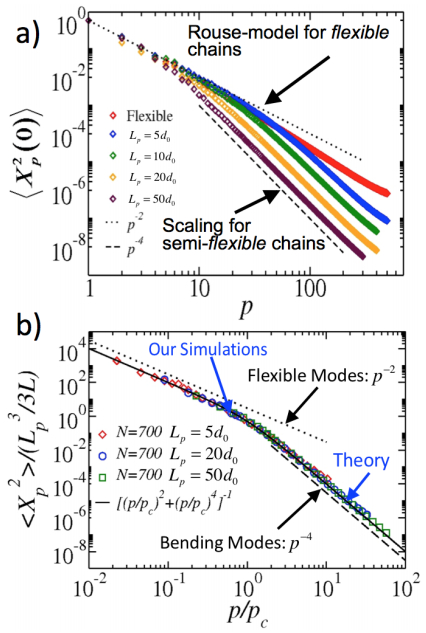
Steinhauser MO, Schneider J, Blumen A (2009) Simulating dynamic crossover behavior of semiflexible linear polymers in solution and in the melt. J Chem Phys 130: 164902. doi: 10.1063/1.3111038
![]() |
[20] |
Rodriguez V, Saurel R, Jourdan G, et al. (2013) Solid-particle jet formation under shock-wave acceleration. Phys Rev E 88: 063011. doi: 10.1103/PhysRevE.88.063011
![]() |
[21] |
Zheng J, Chen QF, Gu YJ, et al. (2012) Hugoniot measurements of double-shocked precompressed dense xenon plasmas. Phys Rev E 86: 066406. doi: 10.1103/PhysRevE.86.066406
![]() |
[22] |
Falk K, Regan SP, Vorberger J, et al. (2013) Comparison between x-ray scattering and velocityinterferometry measurements from shocked liquid deuterium. Phys Rev E 87: 043112. doi: 10.1103/PhysRevE.87.043112
![]() |
[23] |
Brujan EA, Matsumoto Y (2014) Shock wave emission from a hemispherical cloud of bubbles in non-Newtonian fluids. J Non-Newton Fluid 204: 32–37. doi: 10.1016/j.jnnfm.2013.12.003
![]() |
[24] |
Iakovlev S, Iakovlev S, Buchner C, et al. (2014) Resonance-like phenomena in a submerged cylindrical shell subjected to two consecutive shock waves: The effect of the inner fluid. J Fluid Struct 50: 153–170. doi: 10.1016/j.jfluidstructs.2014.05.013
![]() |
[25] |
Bringa EM, Caro A,Wang YM, et al. (2005) Ultrahigh strength in nanocrystalline materials under shock loading. Science 309: 1838–1841. doi: 10.1126/science.1116723
![]() |
[26] |
Kadau K, Germann TC, Lomdahl PS, et al. (2007) Shock waves in polycrystalline iron. Phys Rev Lett 98: 135701. doi: 10.1103/PhysRevLett.98.135701
![]() |
[27] |
Knudson MD, Desjarlais MP, Dolan DH (2008) Shock-Wave Exploration of the High-Pressure Phases of Carbon. Science 322: 1822–1825. doi: 10.1126/science.1165278
![]() |
[28] |
Gurnett DA, Kurth WS (2005) Electron plasma oscillations upstream of the solar wind termination shock. Science 309: 2025–2027. doi: 10.1126/science.1117425
![]() |
[29] |
Gurnett DA, Kurth WS (2008) Intense plasma waves at and near the solar wind termination shock. Nature 454: 78–80. doi: 10.1038/nature07023
![]() |
[30] |
Dutton Z, Budde M, Slowe C, et al. (2001) Observation of quantum shock waves created with ultra-compressed slow light pulses in a Bose-Einstein condensate. Science 293: 663–668. doi: 10.1126/science.1062527
![]() |
[31] |
Damski B (2006) Shock waves in a one-dimensional Bose gas: From a Bose-Einstein condensate to a Tonks gas. Phys Rev A 73: 043601. doi: 10.1103/PhysRevA.73.043601
![]() |
[32] |
Chang JJ, Engels P, Hoefer MA (2008) Formation of dispersive shock waves by merging and splitting Bose-Einstein condensates. Phys Rev Lett 101: 170404. doi: 10.1103/PhysRevLett.101.170404
![]() |
[33] | Millot M, Dubrovinskaia N, Černok A, et al. (2015) Planetary science. Shock compression of stishovite and melting of silica at planetary interior conditions. Science 347: 418–420. |
[34] |
Bridge HS, Lazarus AJ, Snyder CW, et al. (1967) Mariner V: Plasma and Magnetic Fields Observed near Venus. Science 158: 1669–1673. doi: 10.1126/science.158.3809.1669
![]() |
[35] |
McKee CF, Draine BT (1991) Interstellar shock waves. Science 252: 397–403. doi: 10.1126/science.252.5004.397
![]() |
[36] | McClure S, Dorfmüller C (2002) Extracorporeal shock wave therapy: Theory and equipment. Clin Tech Equine Pract 2: 348–357. |
[37] |
Lingeman JE, McAteer JA, Gnessin E, et al. (2009) Shock wave lithotripsy: advances in technology and technique. Nat Rev Urol 6: 660–670. doi: 10.1038/nrurol.2009.216
![]() |
[38] | Cherenkov PA (1934) Visible emission of clean liquids by action of gamma radiation. Dokl Akad Nauk SSSR 2: 451–454. |
[39] |
Mach E, Salcher P (1887) Photographische Fixirung der durch Projectile in der Luft eingeleiteten Vorgänge. Ann Phys 268: 277–291. doi: 10.1002/andp.18872681008
![]() |
[40] |
Kühn M, Steinhauser MO (2008) Modeling and simulation of microstructures using power diagrams: Proof of the concept. Appl Phys Lett 93: 034102. doi: 10.1063/1.2959733
![]() |
[41] |
Walsh JM, Rice MH (1957) Dynamic compression of liquids from measurements on strong shock waves. J Chem Phys 26: 815–823. doi: 10.1063/1.1743414
![]() |
[42] | Asay JR, Chhabildas LC (2003) Paradigms and Challenges in Shock Wave Research, High-Pressure Shock Compression of Solids VI, New York: Springer-Verlag New York, 57–119. |
[43] |
Steinhauser MO, Grass K, Strassburger E, et al. (2009) Impact failure of granular materials-Nonequilibrium multiscale simulations and high-speed experiments. Int J Plasticity 25: 161–182. doi: 10.1016/j.ijplas.2007.11.002
![]() |
[44] |
Watson E, Steinhauser MO (2017) Discrete Particle Method for Simulating Hypervelocity Impact Phenomena. Materials 10: 379. doi: 10.3390/ma10040379
![]() |
[45] |
Holian BL, Lomdahl PS (1998) Plasticity induced by shock waves in nonequilibrium moleculardynamics simulations. Science 280: 2085–2088. doi: 10.1126/science.280.5372.2085
![]() |
[46] |
Kadau K, Germann TC, Lomdahl PS, et al. (2002) Microscopic view of structural phase transitions induced by shock waves. Science 296: 1681–1684. doi: 10.1126/science.1070375
![]() |
[47] |
Chen M, McCauley JW, Hemker KJ (2003) Shock-Induced Localized Amorphization in Boron Carbide. Science 299: 1563–1566. doi: 10.1126/science.1080819
![]() |
[48] | Holian BL (2004) Molecular dynamics comes of age for shockwave research. Shock Waves 13: 489–495. |
[49] |
Germann TC, Kadau K (2008) Trillion-atom molecular dynamics becomes a reality. Int J Mod Phys C 19: 1315–1319. doi: 10.1142/S0129183108012911
![]() |
[50] | Ciccotti G, Frenkel G, McDonald IR (1987) Simulation of Liquids and Solids, Amsterdam: North-Holland. |
[51] | Allen MP, Tildesley DJ (1987) Computer Simulation of Liquids, Oxford, UK: Clarendon Press. |
[52] |
Liu WK, Hao S, Belytschko T, et al. (1999) Multiple scale meshfree methods for damage fracture and localization. Comp Mater Sci 16: 197–205. doi: 10.1016/S0927-0256(99)00062-2
![]() |
[53] |
Gates TS, Odegard GM, Frankland SJV, et al. (2005) Computational materials: Multi-scale modeling and simulation of nanostructured materials. Compos Sci Technol 65: 2416–2434. doi: 10.1016/j.compscitech.2005.06.009
![]() |
[54] | Steinhauser MO (2013) Computer Simulation in Physics and Engineering, 1st Edition, Berlin: deGruyter. |
[55] |
Finnis MW, Sinclair JE (1984) A simple empirical N-body potential for transition metals. Philos Mag A 50: 45–55. doi: 10.1080/01418618408244210
![]() |
[56] |
Kohn W (1996) Density functional and density matrix method scaling linearly with the number of atoms. Phys Rev Lett 76: 3168–3171. doi: 10.1103/PhysRevLett.76.3168
![]() |
[57] |
Car R, Parrinello M (1985) Unified approach for molecular dynamics and density-functional theory. Phys Rev Lett 55: 2471–2474. doi: 10.1103/PhysRevLett.55.2471
![]() |
[58] |
Elstner M, Porezag D, Jungnickel G, et al. (1998) Self-consistent-charge density-functional tightbinding method for simulations of complex materials properties. Phys Rev B 58: 7260–7268. doi: 10.1103/PhysRevB.58.7260
![]() |
[59] |
Sutton AP, Finnis MW, Pettifor DG, et al. (1988) The tight-binding bond model. J Phys C-Solid State Phys 21: 35–66. doi: 10.1088/0022-3719/21/1/007
![]() |
[60] | Szabo A, Ostlund NS (1996) Modern quantum chemistry: introduction to advanced electronic structure theory, (Dover Books on Chemistry), New York: Dover Publications. |
[61] |
Kadau K, Germann TC, Lomdahl PS (2006) Molecular dynamics comes of age: 320 billion atom simulation on BlueGene/L. Int J Mod Phys C 17: 1755–1761. doi: 10.1142/S0129183106010182
![]() |
[62] |
Fineberg J (2003) Materials science: close-up on cracks. Nature 426: 131–132. doi: 10.1038/426131a
![]() |
[63] |
Buehler M, Hartmaier A, Gao H, et al. (2004) Atomic plasticity: description and analysis of a onebillion atom simulation of ductile materials failure. Comput Method Appl M 193: 5257–5282. doi: 10.1016/j.cma.2003.12.066
![]() |
[64] |
Abraham FF, Gao HJ (2000) How fast can cracks propagate? Phys Rev Lett 84: 3113–3116. doi: 10.1103/PhysRevLett.84.3113
![]() |
[65] |
Bulatov V, Abraham FF, Kubin L, et al. (1998) Connecting atomistic and mesoscale simulations of crystal plasticity. Nature 391: 669–672. doi: 10.1038/35577
![]() |
[66] |
Gross SP, Fineberg J, Marder M, et al. (1993) Acoustic emissions from rapidly moving cracks. Phys Rev Lett 71: 3162–3165. doi: 10.1103/PhysRevLett.71.3162
![]() |
[67] | Courant R (1943) Variational Methods for the Solution of Problems of Equilibrium and Vibrations. B Am Math Soc 49: 1–23. |
[68] |
Lucy LB (1977) A numerical approach to the testing of the fission hypothesis. Astron J 82: 1013–1024. doi: 10.1086/112164
![]() |
[69] |
Cabibbo N, Iwasaki Y, Schilling K (1999) High performance computing in lattice QCD. Parallel Comput 25: 1197–1198. doi: 10.1016/S0167-8191(99)00045-9
![]() |
[70] |
Evertz HG (2003) The loop algorithm. Adv Phys 52: 1–66. doi: 10.1080/0001873021000049195
![]() |
[71] | Holm EA, Battaile CC (2001) The computer simulation of microstructural evolution. JOM 53: 20–23. |
[72] |
Nielsen SO, Lopez CF, Srinivas G, et al. (2004) Coarse grain models and the computer simulation of soft materials. J Phys-Condens Mat 16: 481–512. doi: 10.1088/0953-8984/16/15/R03
![]() |
[73] |
Praprotnik M, Site LD, Kremer K (2008) Multiscale simulation of soft matter: From scale bridging to adaptive resolution. Annu Rev Phys Chem 59: 545–571. doi: 10.1146/annurev.physchem.59.032607.093707
![]() |
[74] | Karimi-Varzaneh HA, Müller-Plathe F (2011) Coarse-Grained Modeling for Macromolecular Chemistry, In: Kirchner B, Vrabec J, Topics in Current Chemistry, Berlin, Heidelberg: Springer, 326–321. |
[75] | Müller-Plathe F (2002) Coarse-graining in polymer simulation: from the atomistic to the mesoscopic scale and back. Chem Phys Chem 3: 755–769. |
[76] |
Abraham FF, Broughton JQ, Broughton JQ, et al. (1998) Spanning the length scales in dynamic simulation. Comp Phys 12: 538–546. doi: 10.1063/1.168756
![]() |
[77] |
Abraham FF, Brodbeck D, Rafey R, et al. (1994) Instability dynamics of fracture: A computer simulation investigation. Phys Rev Lett 73: 272–275. doi: 10.1103/PhysRevLett.73.272
![]() |
[78] |
Abraham FF, Brodbeck D, Rudge WE, et al. (1998) Ab initio dynamics of rapid fracture. Model Simul Mater Sc 6: 639–670. doi: 10.1088/0965-0393/6/5/010
![]() |
[79] | Warshel A, LevittM(1976) Theoretical studies of enzymic reactions: Dielectric, electrostatic and steric stabilization of the carbonium ion in the reaction of lysozyme. J Mol Biol 103: 227–249. |
[80] | Winkler RG, Steinhauser MO, Reineker P (2002) Complex formation in systems of oppositely charged polyelectrolytes: a molecular dynamics simulation study. Phys Rev E 66: 021802. |
[81] |
Dünweg B, Reith D, Steinhauser M, et al. (2002) Corrections to scaling in the hydrodynamic properties of dilute polymer solutions. J Chem Phys 117: 914–924. doi: 10.1063/1.1483296
![]() |
[82] |
Stevens MJ (2004) Coarse-grained simulations of lipid bilayers. J Chem Phys 121: 11942–11948. doi: 10.1063/1.1814058
![]() |
[83] | Steinhauser MO (2005) A molecular dynamics study on universal properties of polymer chains in different solvent qualities. Part I. A review of linear chain properties. J Chem Phys 122: 094901. |
[84] |
Steinhauser MO, Hiermaier S (2009) A Review of Computational Methods in Materials Science: Examples from Shock-Wave and Polymer Physics. Int J Mol Sci 10: 5135–5216. doi: 10.3390/ijms10125135
![]() |
[85] |
Goetz R, Gompper G, Lipowsky R (1999) Mobility and elasticity of self-assembled membranes. Phys Rev Lett 82: 221–224. doi: 10.1103/PhysRevLett.82.221
![]() |
[86] |
Lipowsky R (2004) Biomimetic membrane modelling: pictures from the twilight zone. Nat Mater 3: 589–591. doi: 10.1038/nmat1208
![]() |
[87] |
Lyubartsev AP (2005) Multiscale modeling of lipids and lipid bilayers. Eur Biophys J 35: 53–61. doi: 10.1007/s00249-005-0005-y
![]() |
[88] |
Orsi M, Michel J, Essex JW (2010) Coarse-grain modelling of DMPC and DOPC lipid bilayers. J Phys-Condens Mat 22: 155106. doi: 10.1088/0953-8984/22/15/155106
![]() |
[89] | Steinhauser MO (2012) Introduction to Molecular Dynamics Simulations: Applications in Hard and Soft Condensed Matter Physics, InTech. |
[90] | Alberts B, Bray D, Johnson A, et al. (2000) Molecular Biology of the Cell, 4 Edition, New York: Garland Science, Taylor and Francis Group. |
[91] |
Steinhauser MO, Steinhauser MO, Schmidt M (2014) Destruction of cancer cells by laserinduced shock waves: recent developments in experimental treatments and multiscale computer simulations. Soft Matter 10: 4778–4788. doi: 10.1039/C4SM00407H
![]() |
[92] | Tozzini V (2004) Coarse-grained models for proteins. Curr Opin Struc Biol 15: 144–150. |
[93] |
Ayton GS, Noid WG, Voth GA (2007) Multiscale modeling of biomolecular systems: in serial and in parallel. Curr Opin Struc Biol 17: 192–198. doi: 10.1016/j.sbi.2007.03.004
![]() |
[94] |
Forrest LR, Sansom MS (2000) Membrane simulations: bigger and better? Curr Opin Struc Biol 10: 174–181. doi: 10.1016/S0959-440X(00)00066-X
![]() |
[95] |
Woods CJ, Mulholland AJ (2008) Multiscale modelling of biological systems. RSC Special Periodicals Report: Chemical Modelling, Applications and Theory 5: 13–50. doi: 10.1039/b608778g
![]() |
[96] | Steinhauser MO (editor) (2016) Special Issue of the Journal Materials: Computational Multiscale Modeling and Simulation in Materials Science. Available from: http://www.mdpi.com/journal/materials/special issues/modeling and simulation. |
[97] |
Brendel W (1986) Shock Waves: A New Physical Principle in Medicine. Eur Surg Res 18: 177–180. doi: 10.1159/000128523
![]() |
[98] | Wang CJ (2003) An overview of shock wave therapy in musculoskeletal disorders. Chang Gung Med J 26: 220–232. |
[99] |
Wang ZJZ, DesernoM (2010) A systematically coarse-grained solvent-free model for quantitative phospholipid bilayer simulations. J Phys Chem B 114: 11207–11220. doi: 10.1021/jp102543j
![]() |
[100] |
Wang ZB, Wu J, Fang LQ, et al. (2011) Preliminary ex vivo feasibility study on targeted cell surgery by high intensity focused ultrasound (HIFU). Ultrasonics 51: 369–375. doi: 10.1016/j.ultras.2010.11.002
![]() |
[101] |
Wang S, Frenkel V, Zderic V (2011) Optimization of pulsed focused ultrasound exposures for hyperthermia applications. J Acoust Soc Am 130: 599–609. doi: 10.1121/1.3598464
![]() |
[102] |
Paul W, Smith GD, Yoon DY (1997) Static and dynamic properties of an-C100H202 melt from molecular dynamics simulations. Macromolecules 30: 7772–7780. doi: 10.1021/ma971184d
![]() |
[103] |
Kreer T, Baschnagel J, Mueller M, et al. (2001) Monte Carlo Simulation of long chain polymer melts: Crossover from Rouse to reptation dynamics. Macromolecules 34: 1105–1117. doi: 10.1021/ma001500f
![]() |
[104] |
Krushev S, Paul W, Smith GD (2002) The role of internal rotational barriers in polymer melt chain dynamics. Macromolecules 35: 4198–4203. doi: 10.1021/ma0115794
![]() |
[105] |
Bulacu M, van der Giessen E (2005) Effect of bending and torsion rigidity on self-diffusion in polymer melts: A molecular-dynamics study. J Chem Phys 123: 114901. doi: 10.1063/1.2035086
![]() |
[106] | Kratky O, Porod G (1949) Röntgenuntersuchung gelöster Fadenmoleküle. Recl Trva Chim Pays-Bas 68: 1106–1122. |
[107] | Doi M, Edwards SF (1986) The Theory of Polymer Dynamics, Oxford: Clarendon Press. |
[108] |
Harris RA, Hearst JE (1966) On Polymer Dynamics. J Chem Phys 44: 2595–2602. doi: 10.1063/1.1727098
![]() |
[109] | Hearst JE, Harris RA (1967) On Polymer Dynamics. III. Elastic Light Scattering. J Chem Phys 46: 398–398. |
[110] |
Harnau L, Winkler RG, Reineker P (1997) Influence of stiffness on the dynamics of macromolecules in a melt. J Chem Phys 106: 2469–2476. doi: 10.1063/1.473154
![]() |
[111] |
Harnau L, WInkler RG, Reineker P (1999) On the dynamics of polymer melts: Contribution of Rouse and bending modes. EPL 45: 488–494. doi: 10.1209/epl/i1999-00193-6
![]() |
[112] |
Steinhauser MO (2008) Static and dynamic scaling of semiflexible polymer chains-a molecular dynamics simulation study of single chains and melts. Mech Time-Depend Mat 12: 291–312. doi: 10.1007/s11043-008-9062-9
![]() |
[113] |
Guenza M (2003) Cooperative dynamics in semiflexibile unentangled polymer fluids. J Chem Phys 119: 7568–7578. doi: 10.1063/1.1606674
![]() |
[114] | Piran T (2004) Statistical Mechanics of Membranes and Interfaces, 2 edition, World Scientific Publishing Co., Inc. |
[115] |
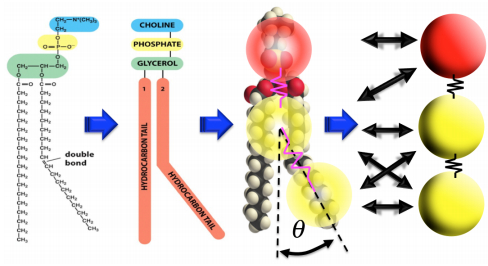
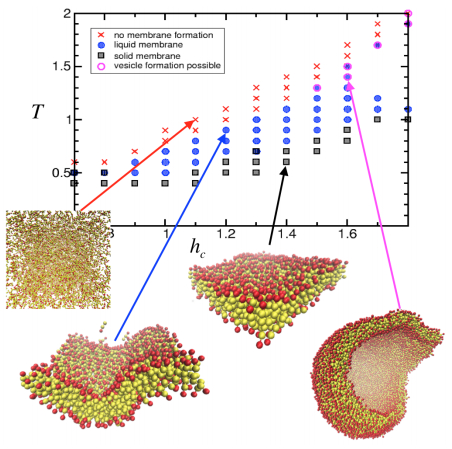
Schindler T, Kröner D, Steinhauser MO (2016) On the dynamics of molecular self-assembly and the structural analysis of bilayer membranes using coarse-grained molecular dynamics simulations. BBA-Biomembranes 1858: 1955–1963. doi: 10.1016/j.bbamem.2016.05.014
![]() |
[116] |
Brannigan G, Lin LCL, Brown FLH (2006) Implicit solvent simulation models for biomembranes. Eur Biophys J 35: 104–124. doi: 10.1007/s00249-005-0013-y
![]() |
[117] |
Chang R, Ayton GS, Voth GA (2005) Multiscale coupling of mesoscopic- and atomistic-level lipid bilayer simulations. J Chem Phys 122: 244716. doi: 10.1063/1.1931651
![]() |
[118] |
Huang MJ, Kapral R, Mikhailov AS, et al. (2012) Coarse-grain model for lipid bilayer selfassembly and dynamics: Multiparticle collision description of the solvent. J Chem Phys 137: 055101. doi: 10.1063/1.4736414
![]() |
[119] |
Pandit SA, Scott HL (2009) Multiscale simulations of heterogeneous model membranes. BBA-Biomembranes 1788: 136–148. doi: 10.1016/j.bbamem.2008.09.004
![]() |
[120] |
Farago O (2003) "Water-free" computer model for fluid bilayer membranes. J Chem Phys 119: 596–605. doi: 10.1063/1.1578612
![]() |
[121] |
Brannigan G, Philips PF, Brown FLH (2005) Flexible lipid bilayers in implicit solvent. Phys Rev E 72: 011915. doi: 10.1103/PhysRevE.72.011915
![]() |
[122] |
Yuan H, Huang C, Li J, et al. (2010) One-particle-thick, solvent-free, coarse-grained model for biological and biomimetic fluid membranes. Phys Rev E 82: 011905. doi: 10.1103/PhysRevE.82.011905
![]() |
[123] |
Noguchi H (2011) Solvent-free coarse-grained lipid model for large-scale simulations. J Chem Phys 134: 055101. doi: 10.1063/1.3541246
![]() |
[124] |
Weiner SJ, Kollman PA, Case DA, et al. (1984) A new force field for molecular mechanical simulation of nucleic acids and proteins. J Am Chem Soc 106: 765–784. doi: 10.1021/ja00315a051
![]() |
[125] |
Paul W, Yoon DY, Smith GD, et al. (1995) An Optimized United Atom Model for Simulations of Polymethylene Melts. J Chem Phys 103: 1702–1709. doi: 10.1063/1.469740
![]() |
[126] |
Siu SWI, Vácha R, Jungwirth P, et al. (2008) Biomolecular simulations of membranes: physical properties from different force fields. J Phys Chem 128: 125103. doi: 10.1063/1.2897760
![]() |
[127] |
Drouffe JM, Maggs AC, Leibler S, et al. (1991) Computer simulations of self-assembled membranes. Science 254: 1353–1356. doi: 10.1126/science.1962193
![]() |
[128] |
Goetz R, Lipowsky R (1998) Computer simulations of bilayer membranes: Self-assembly and interfacial tension. J Chem Phys 108: 7397–7409. doi: 10.1063/1.476160
![]() |
[129] |
Noguchi H, Takasu M (2001) Self-assembly of amphiphiles into vesicles: A Brownian dynamics simulation. Phys Rev E 64: 041913. doi: 10.1103/PhysRevE.64.041913
![]() |
[130] |
Bourov GK, Bhattacharya A (2005) Brownian dynamics simulation study of self-assembly of amphiphiles with large hydrophilic heads. J Chem Phys 122: 44702. doi: 10.1063/1.1834495
![]() |
[131] |
Steinhauser MO, Grass K, Thoma K, et al. (2006) Impact dynamics and failure of brittle solid states by means of nonequilibrium molecular dynamics simulations. EPL 73: 62–68. doi: 10.1209/epl/i2005-10353-2
![]() |
[132] |
Yang S, Qu J (2014) Coarse-grained molecular dynamics simulations of the tensile behavior of a thermosetting polymer. Phys Rev E 90: 012601. doi: 10.1103/PhysRevE.90.012601
![]() |
[133] | Eslami H, Müller-Plathe F (2013) How thick is the interphase in an ultrathin polymer film? Coarse-grained molecular dynamics simulations of polyamide-6,6 on graphene. J Phys Chem 117: 5249–5257. |
[134] |
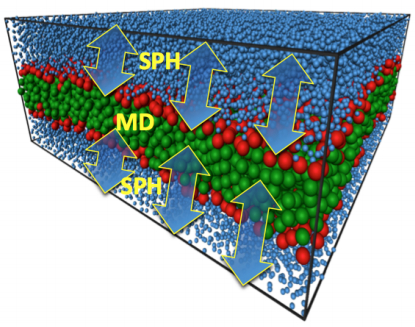
Ganzenm¨uller GC, Hiermaier S, Steinhauser MO (2011) Shock-wave induced damage in lipid bilayers: a dissipative particle dynamics simulation study. Soft Matter 7: 4307–4317. doi: 10.1039/c0sm01296c
![]() |
[135] |
Huang WX, Chang CB, Sung HJ (2012) Three-dimensional simulation of elastic capsules in shear flow by the penalty immersed boundary method. J Comput Phys 231: 3340–3364. doi: 10.1016/j.jcp.2012.01.006
![]() |
[136] | Pazzona FG, Demontis P (2012) A grand-canonical Monte Carlo study of the adsorption properties of argon confined in ZIF-8: local thermodynamic modeling. J Phys Chem 117: 349–357. |
[137] |
Pogodin S, Baulin VA (2010) Coarse-grained models of phospholipid membranes within the single chain mean field theory. Soft Matter 6: 2216–2226. doi: 10.1039/b927437e
![]() |
[138] |
Wang Y, Sigurdsson JK, Brandt E, et al. (2013) Dynamic implicit-solvent coarse-grained models of lipid bilayer membranes: fluctuating hydrodynamics thermostat. Phys Rev E 88: 023301. doi: 10.1103/PhysRevE.88.023301
![]() |
[139] |
Koshiyama K, Kodama T, Yano T, et al. (2006) Structural Change in Lipid Bilayers and Water Penetration Induced by Shock Waves: Molecular Dynamics Simulations. Biophys J 91: 2198–2205. doi: 10.1529/biophysj.105.077677
![]() |
[140] |
Koshiyama K, Kodama T, Yano T, et al. (2008) Molecular dynamics simulation of structural changes of lipid bilayers induced by shock waves: Effects of incident angles. BBA-Biomembranes 1778: 1423–1428. doi: 10.1016/j.bbamem.2008.03.010
![]() |
[141] |
Lechuga J, Drikakis D, Pal S (2008) Molecular dynamics study of the interaction of a shock wave with a biological membrane. Int J Numer Mech Fluids 57: 677–692. doi: 10.1002/fld.1588
![]() |
[142] |
Kodama T, Kodama T, Hamblin MR, et al. (2000) Cytoplasmic molecular delivery with shock waves: importance of impulse. Biophys J 79: 1821–1832. doi: 10.1016/S0006-3495(00)76432-0
![]() |
[143] |
Doukas AG, McAuliffe DJ, Lee S, et al. (1995) Physical factors involved in stress-wave-induced cell injury: The effect of stress gradient. Ultrasound Med Biol 21: 961–967. doi: 10.1016/0301-5629(95)00027-O
![]() |
[144] |
Doukas AG, Flotte TJ (1996) Physical characteristics and biological effects of laser-induced stress waves. Ultrasound Med Biol 22: 151–164. doi: 10.1016/0301-5629(95)02026-8
![]() |
[145] |
Lee S, Doukas AG (1999) Laser-generated stress waves and their effects on the cell membrane. IEEE J Sel Top Quant 5: 997–1003. doi: 10.1109/2944.796322
![]() |
[146] |
Español P (1997) Dissipative Particle Dynamics with energy conservation. EPL 40: 631–636. doi: 10.1209/epl/i1997-00515-8
![]() |
[147] |
Steinhauser MO, Schindler T (2017) Particle-based simulations of bilayer membranes: selfassembly, structural analysis, and shock-wave damage. Comp Part Mech 4: 69–86. doi: 10.1007/s40571-016-0126-3
![]() |
[148] | Hansen JP, McDonald IR (2005) Theory of Simple Liquids, Academic Press. |
1. | Zefang Song, Huafei Di, Instability analysis and regularization approximation to the forward/backward problems for fractional damped wave equations with random noise, 2023, 01689274, 10.1016/j.apnum.2022.12.017 | |
2. | Yue Pang, Xingchang Wang, Furong Wu, Global existence and blowup in infinite time for a fourth order wave equation with damping and logarithmic strain terms, 2021, 14, 1937-1632, 4439, 10.3934/dcdss.2021115 | |
3. | Quang-Minh Tran, Hong-Danh Pham, Global existence and blow-up results for a nonlinear model for a dynamic suspension bridge, 2021, 14, 1937-1632, 4521, 10.3934/dcdss.2021135 | |
4. | Huafei Di, Zefang Song, F. Rabiei, Initial and Boundary Value Problems for a Class of Nonlinear Metaparabolic Equations, 2021, 2021, 1687-9139, 1, 10.1155/2021/6668355 | |
5. | Nouri Boumaza, Billel Gheraibia, Global existence, nonexistence, and decay of solutions for a wave equation of p-Laplacian type with weak and p-Laplacian damping, nonlinear boundary delay and source terms, 2022, 129, 18758576, 577, 10.3233/ASY-211742 | |
6. | Chao Yang, Yanbing Yang, Long-time behavior for fourth-order wave equations with strain term and nonlinear weak damping term, 2021, 14, 1937-1632, 4643, 10.3934/dcdss.2021110 | |
7. | Yi Cheng, Ying Chu, A class of fourth-order hyperbolic equations with strongly damped and nonlinear logarithmic terms, 2021, 29, 2688-1594, 3867, 10.3934/era.2021066 | |
8. | Le Thi Mai Thanh, Le Thi Phuong Ngoc, Nguyen Huu Nhan, Nguyen Thanh Long, FINITE-TIME BLOW UP OF SOLUTIONS FOR A FOURTH-ORDER VISCOELASTIC WAVE EQUATION WITH DAMPING TERMS, 2023, 13, 2156-907X, 3558, 10.11948/20230162 | |
9. | Wen-jun Liu, Zhi-yu Tu, Equivalence between the internal observability and exponential decay for the Moore-Gibson-Thompson equation, 2024, 39, 1005-1031, 89, 10.1007/s11766-024-4133-5 |
Vaccine failure rates | Vaccine effective time period (days) |
0 | FOREVER |
0.001 | 1000 |
0.002 | 500 |
0.003 | 333 |
0.004 | 250 |
0.005 | 200 |
0.006 | 167 |
0.007 | 143 |
0.008 | 125 |
0.009 | 111 |
0.01 | 100 |
0.02 | 50 |
0.03 | 33 |
0.04 | 25 |
0.05 | 20 |
Vaccine failure rates | Vaccine effective time period (days) | Peak value | Peak time (days) |
0 | FOREVER | 17126 | 101 |
0.001 | 1000 | 17934 | 106 |
0.002 | 500 | 18887 | 113 |
0.003 | 333 | 20032 | 121 |
0.004 | 250 | 21443 | 130 |
0.005 | 200 | 23244 | 143 |
0.006 | 167 | 25658 | 160 |
0.007 | 143 | 29159 | 187 |
0.008 | 125 | 35046 | 239 |
0.009 | 111 | 49967 | 435 |
0.01 | 100 | 96669 | 634 |
0.02 | 50 | 924,980 | 445 |
0.03 | 33 | 1,481,000 | 383 |
0.04 | 25 | 1,823,700 | 355 |
0.05 | 20 | 2,050,800 | 339 |
30 days | 40 days | 50 days | 60 days | 70 days | |
ω=0.002 | 8337 | 10214 | 12079 | 13862 | 15476 |
ω=0.006 | 8366 | 10305 | 12298 | 14307 | 16276 |
ω=0.010 | 8393 | 10390 | 12502 | 14720 | 17020 |
failure rates | 0 | 0.005 | 0.01 | 0.015 | 0.019 | 0.02 | 0.021 |
Peak value | 8856 | 9452 | 10354 | 12125 | 38455 | 66507 | 101150 |
Peak time (days) | 54 | 62 | 75 | 110 | 979 | 956 | 892 |
Vaccination rate | 0.005 | 0.01 | 0.015 | 0.02 | 0.025 |
Peak value | 23244 | 9452 | 7269 | 6370 | 5857 |
Peak time (days) | 143 | 62 | 42 | 34 | 29 |