
Citation: Chris Knight, Scott McGarry, Jennifer Hayward, Peter Osman, Sam Behrens. A review of ocean energy converters, with an Australian focus[J]. AIMS Energy, 2014, 2(3): 295-320. doi: 10.3934/energy.2014.3.295
[1] | J. Appelbaum . A static multiple detector solar radiation sensor. AIMS Energy, 2020, 8(5): 802-818. doi: 10.3934/energy.2020.5.802 |
[2] | Rami Al-Hajj, Ali Assi . Estimating solar irradiance using genetic programming technique and meteorological records. AIMS Energy, 2017, 5(5): 798-813. doi: 10.3934/energy.2017.5.798 |
[3] | J. Appelbaum . Shading and masking affect the performance of photovoltaic systems—a review. AIMS Energy, 2019, 7(1): 77-87. doi: 10.3934/energy.2019.1.77 |
[4] | Halima Djeldjli, Djelloul Benatiallah, Camel Tanougast, Ali Benatiallah . Solar radiation forecasting based on ANN, SVM and a novel hybrid FFA-ANN model: A case study of six cities south of Algeria. AIMS Energy, 2024, 12(1): 62-83. doi: 10.3934/energy.2024004 |
[5] | Abdulrahman Almutlaq . Indoor experiments of a horizontal multiple effects diffusion solar still: Influence of heat input and the number of stages. AIMS Energy, 2024, 12(2): 532-547. doi: 10.3934/energy.2024025 |
[6] | Mulualem T. Yeshalem, Baseem Khan . Design of an off-grid hybrid PV/wind power system for remote mobile base station: A case study. AIMS Energy, 2017, 5(1): 96-112. doi: 10.3934/energy.2017.1.96 |
[7] | Gemma Graugés Graell, George Xydis . Solar Thermal in the Nordics. A Belated Boom for All or Not?. AIMS Energy, 2022, 10(1): 69-86. doi: 10.3934/energy.2022005 |
[8] | Ming-Tang Tsai, Chih-Jung Huang . Integration of the radial basis functional network and sliding mode control for the sunshine radiation forecast. AIMS Energy, 2024, 12(1): 31-44. doi: 10.3934/energy.2024002 |
[9] | Fadhil Khadoum Alhousni, Firas Basim Ismail, Paul C. Okonkwo, Hassan Mohamed, Bright O. Okonkwo, Omar A. Al-Shahri . A review of PV solar energy system operations and applications in Dhofar Oman. AIMS Energy, 2022, 10(4): 858-884. doi: 10.3934/energy.2022039 |
[10] | Humaid Abdullah ALHinai, Azrul Mohd Ariffin, Miszaina Osman . Revolutionizing Oman's energy network with an optimal mixture renewable energy source. AIMS Energy, 2023, 11(4): 628-662. doi: 10.3934/energy.2023032 |
Abbreviations: G: Global radiation (W/m2); I: Direct radiation (W/m2); D: Diffuse radiation (W/m2); In: Direct normal radiation (W/m2); h: Solar elevation (degrees); I0: Solar constant (W/m2); θz: Zenith angle (degrees); ${\tau _{aa}}$: Transmittance of direct radiation; ma: Air mass (dimensionless); U1: Pressure-corrected (cm); $\tau_{\mathrm{r}}, \tau_{\mathrm{o}}, \tau_{\mathrm{g}}, \tau_{\mathrm{W}}, \tau_{\mathrm{a}}$: Transmittances related to Rayleigh, ozone, gas, water, and aerosols scattering (dimensionless)
In recent years, there has been an increasing interest in the demand for energy produced by oil, gas, and uranium. This growing would occur relatively quickly in order to use for heating, cooling and electricity generation. There is evidence that numerous natural sources have been destroyed during the past decades, especially oil and gas based fuels sources, due to the rapid development of industry applications [1]. In the global economy, a growing community of researcher focusing on the area of renewable energy including solar, wind and geothermal with the aim of providing energy in the future. Therefore, researchers have focused on various forms of renewable energy that can satisfy the world demand without adversely affecting the environment. Solar energy is widely available almost everywhere, it is safe, environmental friendly, and unlimited in many areas of the world as well as has an economic feasibility to supply the energy needs of the world [2]. In solar energy systems, solar radiation data are extremely vital and being used in design, evaluation, and optimisation of the performance of various solar energy technologies and field applications [3].There are several analyses reviewed by the PV system using the solar radiation estimations in India, Iran and Egypt [4,5,6] and in other countries in the world.
Furthermore, the solar radiation components on horizontal and inclined surfaces are considered an integral part of studies of solar system's performance [7]. However, the radiation measurements stations do not always provide enough geographical sites. Generally, in many parts of the world, the meteorological facilities for solar radiation assessment are either absent or scarce [8]. Consequently, they need to be estimated using solar radiation modelling, which requires the knowledge of the clear-sky atmospheric transmittance.
Many aspects of modelling approaches for estimation of clear-sky solar radiation were studied in the last few years. To date, several studies have investigated and developed different approaches for this purpose based on different sources of data [9,10,11,12,13,14,15,16,17,18,19]. The solar radiation depended on various meteorological and geographic variables such as air temperature, atmospheric pressure, humidity, and solar zenith [20,21,22,23,24]. Previous studies focused on the sunshine duration to estimate the solar radiation [25], and use the satellite data [26,27]. In addition, these studies models are formulated in similar forms and related to the sites when they can be validated with the actual measured values of the sites during different seasons [3]. The first main group is physical model, which focused on the use of radiative transfer equations [28,29,30]. These types of equations are based on complex solves solutions and therefore required very specific mathematical tool which simultaneously solve a large dataset. The second group is the parametrical model [31,32,33,34], which has the same physical principles as the previous group with a set of simplified parameters. The parametric model improved the transmittance expression for the different attenuation processes in the atmosphere, which can be further used to estimate the direct component of incoming solar radiation. The diffuse radiation was calculated based on some approximations to reduce the complexity of the scattering process. Hence, global radiation was produced by combining the direct and diffuse horizontal radiations [35]. The previous models were evaluated only in few cities in the world, it is necessary to estimate daily data on global solar radiation for other cities such as the southern of Algeria.
The purpose of this study is to determine the accuracy of the estimation of three models developed for the prediction of global solar radiation over a horizontal surface at three cities in the Algerian big Sahara; three of the most accurate models were investigated for clear skies solar radiation modelling. First, the model of Bird & Hulstrom [29] is considered as a reference for designers of solar systems. This model takes into account the data’s weather, including air temperature, humidity, and atmospheric pressure. In addition, the Second model of Ashrae [31] is a simpler model used in different types of solar energy applications and requires solar zenith angle and some empirical formulas. Finally, the third model of Atwater & Ball [33] is dependent on numerous atmospheric parameters and coefficients. These models were evaluated for estimation of instantaneous clear-sky solar radiation on a horizontal surface in the Algerian south climate through comparing measured data with estimated values. The verification and validation of the whole models were carried out after the continuously collection of radiometric and meteorological data from three locations; El-goléa, Adrar and Tamanrasset which were situated in the central of Sahara region. The climate of the studied areas is continental desert with hot desert climate, long summers and short warm winters; the climate was characterized by a high variation of temperatures exceeding 45° between June and August and 18° between November and January. These regions also have tremendous solar energy potential as depicted in Figure 1, with high global solar radiation intensity, and sunshine duration ranged between 9 to 11 hours per day [36,37].
The experimental data were collected from three different stations situated in the southern region of Algeria in solar active region where the latitude ranged from 22° to 31°N, and longitude ranged from 1°W to 6°E [3]. Thus, ample sunlight is available which accounts for more than 3000 hours of sunshine per year with over 5.5 kWh/m2/day of solar radiation intensity (Figure 1).
According to first station, the measurements of diffuse and global radiation was carried out in the Renewable Energies Research Unit situated in Saharan Medium (RERUSM) in the state of Adrar which consisted of SOLYS 2 system Kipp & Zonen CMP21 Pyranometer (Figure 2). The second station of El- goléa was equipped with Kipp & Zonen CMP 6 Pyranometer. For the third station measurements was performed in the National Meteorological Office (NMO) in the state of Tamanrasset using Eppley PSP pyranometer. The characteristics of equipment used are included in Table 2. In the present study simple quality control procedures were adopted and conducted in order to improve the obtained results (data initially lacking or removed via quality checks) [38,39]. The physical limit of test processes were applied to the global solar irradiance using the horizontal surface values of extraterrestrial irradiance. According to the outcomes of quality controls, the missing measurements represent around 11%, 3% and 6% of the whole database for the first, the second, and the third stations, respectively.
Station | Sites | Longitude | Latitude | Altitude (m) |
Station 1 | Tamanrasset | 5°52’E | 22°78’N | 1320 |
Station 2 | Adrar | 0°28’W | 27°88’N | 269 |
Station 3 | El Goléa | 2°87’E | 30°58’N | 380 |
Sensor | Kipp & Zonen CMP21 | Kipp & Zonen CMP 6 | Eppley PSP |
Maximum operational irradiance | 4000 W/m2 | 2000 W/m2 | 4000 W/m2 |
Spectral range | 270 to 3000 nm | 285 to 2800 nm | 305-2800 nm |
Sensitivity | 7 to 14 μV/W/m2 | 5-20 μV/W/m2 | 7 mV/kW/m2 |
Directional response | < 10 W/m2 | < 20 Wm-2 | < ±10 W/m2 |
Non-stability (Change/year) | < 0.5% | 0.5% | < ±0, 2% |
Temperature response | < 1% (-20° to +50°) | 4% (0° to +100°) | < ±1% |
Response time | < 5 s | 18 s | ~8 sec |
Non-linearity | < 0.2 % | 0.5% | < ±0, 2% |
Operating and storage temperature range | -40° to +80° | -40° to +80° | -40° to +80° |
The data collection of this research performed in one year started from January to December 2016 with a datasets composed of 5 min as an averaged value for Adrar station, 1 min for Tamanrasset station, and 10 min for El-goléa station, there are about 12, 612 selected measurements in total.
The global radiation received by the sun is the sum of direct, diffuse radiation and reflected components. The reflected component has the null value in horizontal surface. Figure 3 depicts the constituents of the incoming solar radiation [40]. The global irradiance G (W/m2) on a horizontal surface can be given by [43]:
${\rm{G}} = {\rm{I}} + {\rm{D}}$ | (1) |
The following subsection describes the investigated models as well as the techniques used to calculate fundamental equations and various parameters in horizontal surfaces.
Following the first model of Bird & Hulstrom, the direct normal irradiance in the direction of rays In (W/m2) depends on absorption, transmittance, and atmospheric components which can be estimated using the following equation [41,42,43]:
$ {{\rm{I}}_{\rm{n}}} = 0.9751{{\rm{I}}_0}{{\rm{\tau }}_{\rm{r}}}{{\rm{\tau }}_{\rm{g}}}{{\rm{\tau }}_0}{{\rm{\tau }}_{\rm{w}}}{{\rm{ \tau }}_{\rm{a}}} $ | (2) |
where the factor of 0.9751 depended on the spectral range of 0.3-3 μm, I0 is the solar constant (W/m2); and h is the solar elevation (degrees). τr, τo, τg, τw, τa (dimensionless) are the transmittances related to Rayleigh, ozone, gas, water, and aerosols scattering.
These components are formulated respectively by:
$ {{\rm{\tau }}_{\rm{r}}} = {\rm{exp}}\left( { - 0.903{\rm{m}}_{\rm{a}}^{0.84}\left( {1 + {{\rm{m}}_{\rm{a}}} - {\rm{m}}_{\rm{a}}^{1.01}} \right)} \right) $ | (3) |
$ {{\rm{\tau }}_{0{\rm{}}}} = 1-(0.1611{{\rm{U}}_{3{\rm{}}}}{\left( {1 + 139.48{{\rm{U}}_3}} \right)^{ - 0.3035}} - 0.002715{{\rm{U}}_{3{\rm{}}}}{\left( {1 + 0.044{{\rm{U}}_{3{\rm{}}}} + 0.0003{\rm{U}}_3^2)} \right)^{ - 1}} $ | (4) |
$ {{\rm{\tau }}_{\rm{g}}} = {\rm{exp}}\left( { - 0.0127{\rm{m}}_{\rm{a}}^{0.26}} \right) $ | (5) |
$ {{\rm{\tau }}_{\rm{w}}} = 1 - 2.4959{{\rm{U}}_1}{\left( {{{\left( {1 + 79.034{{\rm{U}}_1}} \right)}^{0.6828}} + 6.385{{\rm{U}}_1}} \right)^{ - 1{\rm{}}}} $ | (6) |
$ {{\rm{\tau }}_{\rm{a}}}{\rm{ = exp( - K}}_{\rm{a}}^{{\rm{0}}{\rm{.873}}}{\rm{(1 + }}{{\rm{K}}_{\rm{a}}}{\rm{ - K}}_{\rm{a}}^{{\rm{0}}{\rm{.7808}}}{\rm{)m}}_{\rm{a}}^{{\rm{0}}{\rm{.9108}}}{\rm{)}} $ | (7) |
where ma (dimensionless) is the air mass at actual pressure, U1 (cm) is the pressure-corrected relative optical-path length of precipitable water, Ka represent the aerosol optical thickness, and U3 (cm) is the ozone's relative optical path length. They are given by [43].
$ {{\rm{m}}_{\rm{a}}} = \frac{1}{{\sin \left( {\rm{h}} \right) + 9.4\times {{10}^{ - 4}}{\rm{}}{{\left( {\sin \left( {\rm{h}} \right) + 0.0678} \right)}^{ - 1253}}}} $ | (8) |
$ {{\rm{m}}_{\rm{r}}} = {{\rm{m}}_{\rm{a}}}{\left( {\frac{{\rm{P}}}{{1013.25}}} \right)^{ - 1}} $ | (9) |
$ {{\rm{U}}_1} = \frac{{0.493}}{{\rm{T}}}{\rm{HR}}\;\;{\rm{exp}}\left( {26.23 - \frac{{5416}}{{\rm{T}}}} \right) $ | (10) |
T, ambient temperature (K) and HR, relative humidity (%).
$ {{\rm{K}}_{\rm{a}}} = 0.2758{\rm{}}{{\rm{K}}_{{\rm{a \mathsf{ λ} / \mathsf{ λ} }} = 0.38{\rm{\mu }}{\rm{m}}}} + 0.35{{\rm{K}}_{{\rm{a \mathsf{ λ} / \mathsf{ λ} }} = 0.5{\rm{\mu }}{\rm{m}}}} $ | (11) |
$ {{\rm{K}}_{\rm{a}}}({\rm{ \mathsf{ λ} }}) = {\rm{ \mathsf{ β} }}{{\rm{ \mathsf{ λ} }}^{{\rm{ - \mathsf{ α} }}}} $ | (12) |
λ (μm) is the wavelength, and β, α (dimensionless) are the Angstrom turbidity coefficients [44,45], and these are as follows in Table 3:
$ {{\rm{U}}_3} = {\rm{L}}{{\rm{m}}_{\rm{r}}} $ | (13) |
$ {\rm{L}} = \frac{1}{{9.4{\rm{}} + {\rm{}}0.9{\rm{}}{{\rm{m}}_{\rm{a}}}}} $ | (14) |
Zone climatic | β | α |
Rural site | 0.05 | 0.11 |
Urban site | 0.10 | 0.22 |
Industrial site | 0.30 | 0.66 |
where, p (mbar) is the local air-pressure, z(m) is the altitude of studied position, L (cm) is the vertical ozone-layer thickness, mr (dimensionless) is the air mass at standard pressure (1013.25 mbar) [46,47].
$ {\rm{p}} = 1013{\rm{}}{\left( {1 - 2.257 \times {{10}^{ - 5}}{\rm{Z}}} \right)^{5.26}} $ | (15) |
$ {\rm{T}} = 288 - 6.5 \times {10^{ - 3}}{\rm{Z}} $ | (16) |
The beam irradiance I is illustrated by the following formula:
$ {\rm{I}} = {{\rm{I}}_{\rm{n}}}{\rm{co}}{{\rm{s}}_{\rm{z}}} $ | (17) |
where θz (degrees) is the zenith angle.
In this model, the diffuse radiation D (W/m2) in horizontal plane represents the sum of three diffuse components: the Rayleigh scattering component Dr; the aerosol component Da; and the component that can be used for multiple reflections of irradiance between the ground and sky Dm. All these components are given in the following expressions.
$ {\rm{D}} = {{\rm{D}}_{\rm{r}}} + {{\rm{D}}_{\rm{a}}} + {{\rm{D}}_{\rm{m}}} $ | (18) |
$ {{\rm{D}}_{\rm{r}}} = \frac{{0.79{\rm{}}{{\rm{I}}_{{\rm{sc}}}}{\rm{}}\sin \left( {\rm{h}} \right){\rm{\tau }}{{\rm{}}_0}{\rm{\tau }}{{\rm{}}_{\rm{g}}}{\rm{\tau }}{{\rm{}}_{\rm{w}}}{\rm{\tau }}{{\rm{}}_{{\rm{aa}}}}{\rm{}}0.5\left( {1 - {\rm{\tau }}{{\rm{}}_{\rm{r}}}} \right)}}{{1 - {{\rm{m}}_{\rm{a}}} + {\rm{m}}_{\rm{a}}^{1.02}}} $ | (19) |
where Isc is the correction of the solar constant, τaa is the transmittance of direct radiation due to aerosols absorption is given by the following expression:
$ {{\rm{\tau }}_{{\rm{aa}}}} = 1 - \left( {1 - {{\rm{ \mathsf{ ω} }}_0}} \right)\left( {1 - {{\rm{m}}_{\rm{a}}} + {\rm{m}}_{\rm{a}}^{1.06}} \right)\left( {1 - {{\rm{\tau }}_{\rm{a}}}} \right) $ | (20) |
$ {{\rm{D}}_{\rm{a}}} = \frac{{0.79{\rm{}}{{\rm{I}}_{{\rm{sc}}}}{\rm{sin}}\left( {\rm{h}} \right){\rm{}}{{\rm{\tau }}_0}{{\rm{\tau }}_{\rm{g}}}{{\rm{\tau }}_{\rm{w}}}{{\rm{\tau }}_{{\rm{aa}}}}{\rm{}}{{\rm{F}}_{\rm{c}}}{\rm{}}0.5\left( {1 - {{\rm{\tau }}_{{\rm{as}}}}} \right)}}{{1 - {{\rm{m}}_{\rm{a}}} + {\rm{m}}_{\rm{a}}^{1.02}}} $ | (21) |
where Fc is the coefficient of dispersion of the atmosphere. Fc = 0.84 is the value recommended by this model [48].
As explained in the following the Τas is the transmittance due to aerosol scattering.
$ {\tau _{as}} = \frac{{{\tau _a}}}{{{\tau _{aa}}}} $ | (22) |
The multiple-reflection occurring between the ground and sky is accounted as follows:
$ {{\rm{D}}_{\rm{m}}} = \frac{{\left( {{{\rm{I}}_{\rm{n}}}\sin \left( {\rm{h}} \right) + {{\rm{D}}_{\rm{r}}} + {{\rm{D}}_{\rm{a}}}} \right){{\rm{ \mathsf{ ρ} }}_{\rm{g}}}{\rm{}}{{\rm{ \mathsf{ ρ} }}_{\rm{a}}}}}{{1 - {{\rm{ \mathsf{ ρ} }}_{\rm{g}}}{\rm{}}{{\rm{ \mathsf{ ρ} }}_{\rm{a}}}}} $ | (23) |
$ {{\rm{ \mathsf{ ρ} }}_{\rm{a}}} = 0.0685 + \left( {1 - {{\rm{F}}_{\rm{c}}}} \right)\left( {1 - {{\rm{\tau }}_{{\rm{as}}}}} \right) $ | (24) |
With ρg is the ground albedo and ρa is the clear sky albedo, h (degrees) is the solar elevation; and ω0 = 0.9 is the aerosol single of scattering albedo [49].
Ashrae is an empirical model (model 2) used in many solar applications, depending on the solar zenith angle θz as well some empirical values A, B and C (see Table 4).The following equations explained the global solar irradiance G and the direct solar irradiance In as well as the diffuse solar irradiance D in horizontal plane [31], respectively.
$ {\rm{G}} = {\rm{}}{{\rm{I}}_{\rm{n}}}\cos {{\rm{ \mathsf{ θ} }}_{\rm{z}}} + {\rm{D}} $ | (25) |
$ {{\rm{I}}_{\rm{n}}} = {\rm{Aexp}}\left( { - {\rm{B}}/\cos \left( {{{\rm{ \mathsf{ θ} }}_{\rm{z}}}} \right)} \right) $ | (26) |
$ {\rm{D}} = {\rm{C}}{{\rm{I}}_{\rm{n}}} $ | (27) |
Month | A | B | C |
Jan | 1230 | 0.142 | 0.058 |
Feb | 1215 | 0.144 | 0.060 |
Mar | 1186 | 0.156 | 0.071 |
Apr | 1136 | 0.180 | 0.097 |
May | 1104 | 0.196 | 0.121 |
Jun | 1088 | 0.205 | 0.134 |
Jul | 1085 | 0.207 | 0.136 |
Aug | 1107 | 0.201 | 0.122 |
Sep | 1152 | 0.177 | 0.092 |
Oct | 1193 | 0.160 | 0.073 |
Nov | 1221 | 0.149 | 0.063 |
Dec | 1234 | 0.142 | 0.057 |
The model of Atwater & Ball (Model 3(demonstrated the relationship between precipitable water, pressure, air mass, together with broad band aerosol optical depth in order to calculate the aerosols and water vapor transmittances. The global solar radiation in horizontal surface and clear sky is explained by the following [33]:
$ {\rm{G}} = {{\rm{I}}_0}\cos \left( {{{\rm{ \mathsf{ θ} }}_{\rm{z}}}} \right)\left( {\left( {{{\rm{\tau }}_{{\rm{md}}}} - {{\rm{a}}_{\rm{w}}}} \right){{\rm{\tau }}_{\rm{a}}}/(1 - 0.0685{\rm{ \mathsf{ ρ} }})} \right) $ | (28) |
where
$ {{\rm{\tau }}_{{\rm{md}}}} = 1.041 - 0.16{\left( {{{\rm{m}}_{\rm{a}}}\left( {949\times {{10}^{ - 6}}{\rm{p}} + 0.051} \right)} \right)^{0.5}} $ | (29) |
$ {{\rm{a}}_{\rm{w}}} = 0.077{\left( {{{\rm{u}}_1}{{\rm{m}}_{\rm{a}}}} \right)^{0.3}} $ | (30) |
${{\rm{\tau }}_{{\rm{md}}}}$ is the direct transmission coefficient while ${{\rm{a}}_{\rm{w}}}$ is the absorption of solar radiation.
The prediction performance of the considered models was assessed using parameters commonly used in statistical scores [44], such as Mean Bias Error (MBE), Root Mean Square Error (RMSE), Coefficient of correlation)R(, and Relative Mean Absolute Percentage Error (MAPE).
These are specified by the following Eqs (31-36).
$ {\rm{MBE}} = \frac{1}{{\rm{K}}}{\rm{}} \sum \left( {{\rm{G}}_{\rm{c}}^{\rm{i}} - {\rm{G}}_{\rm{m}}^{\rm{i}}} \right) $ | (31) |
$ {\rm{RMSE}} = {\left( {\frac{1}{{\rm{K}}}{\rm{}} \sum \nolimits {{\left( {{\rm{G}}_{\rm{c}}^{\rm{i}} - {\rm{G}}_{\rm{m}}^{\rm{i}}} \right)}^2}} \right)^{\frac{1}{2}}} $ | (32) |
$ {\rm{MAPE}} = \frac{{100}}{{\rm{K}}}{\rm{}} \sum \left| {\frac{{\left( {{\rm{G}}_{\rm{c}}^{\rm{i}} - {\rm{G}}_{\rm{m}}^{\rm{i}}} \right)}}{{{\rm{G}}_{\rm{m}}^{\rm{i}}}}} \right| $ | (33) |
Relative Mean Absolute Percentage Error (MAPE) was considered to be acceptable by then less 10%.
$ {\rm{R}} = \frac{{ \sum \left( {{\rm{G}}_{\rm{c}}^{\rm{i}} - \overline {{\rm{G}}_{\rm{c}}^{\rm{i}}} } \right)\left( {{\rm{G}}_{\rm{m}}^{\rm{i}} - \overline {{\rm{G}}_{\rm{m}}^{\rm{i}}} } \right)}}{{\sqrt { \sum \nolimits^ {{\left( {{\rm{G}}_{\rm{c}}^{\rm{i}} - \overline {{\rm{G}}_{\rm{c}}^{\rm{i}}} } \right)}^2} \sum \nolimits^ {{\left( {{\rm{G}}_{\rm{m}}^{\rm{i}} - \overline {{\rm{G}}_{\rm{m}}^{\rm{i}}} } \right)}^2}} {\rm{}}}} $ | (34) |
The relative MBE (rMBE) and relative RMSE (rRMSE) are calculated by the following:
$ {\rm{rMBE}} = 100{\rm{}}\left( {\frac{1}{{\rm{K}}} \sum \left( {\frac{{{\rm{G}}_{\rm{c}}^{\rm{i}} - {\rm{G}}_{\rm{m}}^{\rm{i}}}}{{{\rm{G}}_{\rm{m}}^{\rm{i}}}}} \right)} \right) $ | (35) |
$ {\rm{rRMSE}} = 100{\left( {\frac{1}{{\rm{K}}}\sum {{{\left( {\frac{{{\rm{G}}_{\rm{c}}^{\rm{i}} - {\rm{G}}_{\rm{m}}^{\rm{i}}}}{{{\rm{G}}_{\rm{m}}^{\rm{i}}}}} \right)}^2}} } \right)^{\frac{1}{2}}} $ | (36) |
where Gci: is the ith predicted value; Gmi: is the ith measured value; K: is the total number of evaluated data points.
The main goal of the current study was to assess the solar radiation models and the comparison between measured and simulated values. Therefore, a proper computer programs using MATLAB® software were developed for clear skies solar radiation estimation in the three locations; Tamanrasset, Adrar and El-goléa. The measurements data was collected in horizontal plane.
The Figures 4-7 showed clearly the comparison between the predicted and the experimental value of global solar radiation flux during the year of 2016.
The data in the following figure exhibited the measured values of global solar radiation in horizontal surface based on three models for the three locations named; Tamanrasset)station 1(, Adrar (station 2(, and El-goléa)station 3(with the comparison of the global solar radiation fluxes predicted by the studied models, Bird & Hulstrom (Model 1), Ashrae (Model 2), and Atwater & Ball (Model 3).
The Figures 4-7 illustrated the comparison of results between the predicted and measured values recorded in three different stations in the Algerian southern.
The solar radiation varied over the day, peaking at around solar noon, and has lower values in the case of sunrise and sunset due to the decreased values of solar elevation. Hence, the maximum global solar fluxes reached its maximum value in the middle of 1000 watts per square meter on the duration sun's height, with an increase in the warm months and a reduction in the cold months.
The most obvious finding to emerge from this study is that the statistical results were presented to validate the estimate models with comparison between the predicted and measured values of global solar radiation. Thus, the statistical scores of global solar radiation were calculated at all three stations located in the south of Algeria. The obtained results are depicted in Tables 5 and 6, and Figures 8 and 9.
Day | Model | Station 1 (Tamanreset) | Station 2 (Adrar) | Station 3 (El -goléa) | ||||||
MBE (Wh/m2) | RMSE (Wh/m2) | R | MBE (Wh/m2) | RMSE (Wh/m2) | R | MBE (Wh/m2) | RMSE (Wh/m2) | R | ||
January 15 | Model 1 | 39.73 | 51.07 | 0.9958 | 54.86 | 55.53 | 0.9996 | -19.55 | 28.56 | 0.9966 |
Model 2 | 57.96 | 63.90 | 0.9959 | 23.84 | 24.22 | 0.9996 | -43.28 | 52.72 | 0.9968 | |
Model 3 | 43.72 | 51.88 | 0.9957 | 40.18 | 40.34 | 0.9995 | -25.89 | 39.81 | 0.9961 | |
February 24 | Model 1 | 78.11 | 90.66 | 0.9988 | 80.95 | 82.47 | 0.9996 | -30.83 | 41.47 | 0.9971 |
Model 2 | 86.85 | 93.68 | 0.9989 | 30.84 | 32.11 | 0.9996 | -65.79 | 75.77 | 0.9968 | |
Model 3 | 69.64 | 79.61 | 0.9985 | 49.90 | 50.26 | 0.9996 | -47.45 | 61.66 | 0.9972 | |
March 22 | Model 1 | 63.72 | 81.30 | 0.9994 | 65.89 | 68.96 | 0.9995 | 8.17 | 15.13 | 0.9988 |
Model 2 | 67.33 | 76.89 | 0.9996 | 4.26 | 11.90 | 0.9995 | -0.47 | 11.47 | 0.9987 | |
Model 3 | 31.66 | 47.72 | 0.9990 | 30.33 | 31.50 | 0.9995 | 6.79 | 14.39 | 0.9977 | |
April 25 | Model 1 | 0.45 | 47.14 | 0.9971 | 61.61 | 64.23 | 0.9997 | 35.81 | 40.51 | 0.9976 |
Model 2 | 3.33 | 34.99 | 0.9976 | -15.09 | 16.40 | 0.9996 | -35.34 | 39.27 | 0.9972 | |
Model 3 | -43.36 | 54.50 | 0.9965 | 25.33 | 25.98 | 0.9997 | 1.44 | 16.02 | 0.9976 | |
May 12 | Model 1 | -2.79 | 46.63 | 0.9977 | 31.77 | 38.18 | 0.9997 | 27.72 | 28.00 | 0.9999 |
Model 2 | -0.23 | 33.70 | 0.9982 | -51.69 | 52.15 | 0.9996 | -58.70 | 62.50 | 0.9999 | |
Model 3 | -51.17 | 59.66 | 0.9971 | -4.35 | 7.77 | 0.9997 | -8.22 | 19.73 | 0.9999 | |
June 03 | Model 1 | 31.96 | 53.53 | 0.9992 | 48.57 | 50.76 | 0.9999 | -54.49 | 58.70 | 0.9987 |
Model 2 | 33.87 | 45.06 | 0.9995 | -41.51 | 42.34 | 0.9998 | -147.99 | 148.69 | 0.9984 | |
Model 3 | -18.97 | 30.65 | 0.9988 | 12.63 | 13.71 | 0.9999 | -91.59 | 92.42 | 0.9987 | |
July 29 | Model 1 | 55.64 | 70.84 | 0.9990 | -2.01 | 23.91 | 0.9995 | 18.11 | 19.45 | 0.9998 |
Model 2 | 57.37 | 65.31 | 0.9992 | -95.11 | 95.52 | 0.9994 | -76.17 | 78.41 | 0.9999 | |
Model 3 | 5.98 | 25.93 | 0.9986 | -39.24 | 40.32 | 0.9996 | -18.68 | 22.87 | 0.9998 | |
August 23 | Model 1 | 55.64 | 70.84 | 0.9990 | 61.34 | 63.99 | 0.9999 | 3.32 | 10.21 | 0.9992 |
Model 2 | 57.37 | 65.31 | 0.9992 | -27.36 | 27.53 | 0.9999 | -88.54 | 91.20 | 0.9990 | |
Model 3 | 5.98 | 25.93 | 0.9986 | 21.88 | 22.22 | 0.9999 | -33.84 | 37.82 | 0.9992 | |
September 13 | Model 1 | 27.40 | 48.27 | 0.9985 | 50.61 | 54.58 | 0.9993 | 9.60 | 23.83 | 0.9986 |
Model 2 | 25.58 | 38.02 | 0.9987 | -32.61 | 33.90 | 0.9992 | -71.28 | 72.22 | 0.9985 | |
Model 3 | -11.18 | 29.02 | 0.9982 | 8.70 | 12.47 | 0.9993 | -30.49 | 32.61 | 0.9986 | |
October 17 | Model 1 | 20.90 | 40.20 | 0.9986 | 59.00 | 60.61 | 0.9996 | 22.54 | 34.53 | 0.9932 |
Model 2 | 18.56 | 29.54 | 0.9988 | -10.79 | 12.09 | 0.9996 | -45.16 | 50.20 | 0.9927 | |
Model 3 | -10.55 | 25.86 | 0.9984 | 17.83 | 18.36 | 0.9996 | -14.95 | 25.73 | 0.9933 | |
November 13 | Model 1 | 40.12 | 50.04 | 0.9987 | 50.81 | 51.58 | 0.9999 | -20.47 | 35.79 | 0.9899 |
Model 2 | 42.43 | 46.79 | 0.9988 | -0.87 | 2.50 | 0.9999 | -76.67 | 80.84 | 0.9895 | |
Model 3 | 20.20 | 29.06 | 0.9985 | 21.06 | 21.13 | 0.9999 | -51.21 | 57.01 | 0.9900 | |
December 16 | Model 1 | 18.26 | 31.05 | 0.9981 | 44.53 | 44.73 | 0.9994 | -20.29 | 28.11 | 0.9954 |
Model 2 | 34.79 | 39.33 | 0.9984 | 13.20 | 14.18 | 0.9995 | -46.85 | 54.68 | 0.9956 | |
Model 3 | 19.20 | 27.90 | 0.9978 | 31.07 | 32.00 | 0.9993 | -28.61 | 40.21 | 0.9949 |
Station | Model | MAPE (%) | MBE (Wh/m2/day) | rMBE (%) | RMSE (Wh/m2/day) | rRMSE (%) | R |
Station1 (Tamanrasset) | 1 | 6.87 | 30.43 | 4.64 | 55.98 | 8.54 | 0.9953 |
2 | 6.65 | 37.32 | 5.69 | 53.16 | 8.11 | 0.9955 | |
3 | 4.99 | 2.44 | 0.37 | 42.55 | 6.49 | 0.9960 | |
Station 2 (Adrar) | 1 | 7.07 | 50.07 | 6.74 | 56.43 | 7.59 | 0.9935 |
2 | 4.00 | -18.23 | -2.45 | 39.16 | 5.27 | 0.9875 | |
3 | 3.62 | 18.78 | 2.53 | 30.47 | 4.10 | 0.9933 | |
Station 3 (El-goléa) | 1 | 4.12 | -2.87 | -0.48 | 30.59 | 5.07 | 0.9966 |
2 | 10.92 | -65.41 | -10.84 | 74.84 | 12.40 | 0.9938 | |
3 | 5.63 | -29.89 | -4.95 | 42.89 | 7.11 | 0.9941 |
The Figures (8-11) and the Tables (5, 6) illustrated the Mean Absolute Percentage Error, Mean Bias Error, Root Mean Square Error, and the scatter plots.
Moreover, the figure 8 showed the scatter plots of daily global solar radiation values in 2016 was considered as the best model in each station. It can be seen that the data are distributed as a collection of points closer to the perfect fit linear line (red), indicating the relation between measured and predicted values (W/m2) over the study period at each station. Interestingly, the best model to use for estimation gives the best approximation with the measured data.
As shown in Figures 9-11, the instantaneous global solar radiation predicted by models was presented in good agreement with those computed by all stations.The MAPE recorded at the stations 1 and 2 were less than 10% for all months except for February and July as depicted in Figure 9A, B. However, the MAPE measured at station 3 are less than 20% for all months as shown in Figure 9C. Although the MAPE recorded at stations 1 and 2 are less than 10% and 7%, respectively. The lowest value of MAPE coefficients registered at station 3 is related to the model 1 (MAPE < 8%).
Based on the statistical results (rMBE, rRMSE, R), it can be seen that the rMBE results did not exceed 10 and 7% in absolute value for the stations 1 and 2, respectively. The rMBE value of model 1 ranging from -7 to +8% at station 3, and -20 to +13(%) for three models at all station (Figure 10). Therefore, rRMSE did not exceed the percentages of 14, 12 and 20%, for the stations 1, 2 and 3, respectively (Figure 11).
In this investigation, a good correlation between the predicted and the computed values at each station was appeared; the values of correlation coefficient R are higher than 0.98 as shown in Table 5. The research has also shown that the analysis results of MBE and RMSE have also a good approximation between predicted solar radiation values and those computed by models.
The results of statistical of MAPE, MBE, rMBE, RMSE, rRMSE and R for all stations from 1 January to 31 December are reported in Table 6. In general, all models used in this study performed well in estimating global solar radiation. The lowest values of the statistical scores coefficients were in Atwater & Ball model at stations 1 and 2 (MAPE = 4.99 and 3.62, R = 0.9960 and 0.9935, respectively), that indicated that this model is more suitable for the stations 1 and 2 located in Tamanrasset and Adrar, respectively. The statistical indicators values for Bird & Hulstorm model at station 3 have an excellent performance by lower values (MAPE = 4.12, R = 0.9966). It can be concluded that the best prediction model of global solar radiation at station 3 located in El-goléa is the model of Bird & Hulstorm. There is a good correlation between the measured values of solar radiation and those predicted in the selected stations. The result of this investigation shows that the simulation presents a good agreement with the measured values while the best models gives best results of solar radiation. The errors between the measured and the estimated values are negligible in some cases. Hence, the best studied models have an excellent performance which can be estimate by the global solar irradiance in southern of Algerian.
The current study investigated the preliminary assessment of solar energy potential in arid climatic region in the southern region of Algeria. The estimation of the global solar radiation on a horizontal plane under clear sky condition using three empirical models of Bird & Hulstrom, Ashrae and Atwater & Ball were performed. The models were defined with input parameters including the atmospheric-pressure, aerosols scattering coefficient, the average temperature, and the relative humidity.
The performance of these models was performed in three locations: El-goléa, Adrar and Tamanrasset using various statistical indicators by comparing the computed and measured values.
The most important results can be concluded as follow:
-The Atwater & Ball model was more suitable for the prediction of global solar radiation in Tamanrasset and Adrar cities. However, The Bird & Hulstrom model provides much better prediction for global solar radiation in El-goléa city. The Ashrae model was less accurate than the other models for the whole stations.
-Overall, the relative mean absolute error did not exceed 5% and the coefficient of correlation was greater than 0.99 as well as the relative bias error did not exceed 3%. The relative RMSE was ranged between 4% and 7% for the global irradiation.
-In the clear sky conditions the empirical Atwater & Ball and Bird & Hulstrom models provided the best accuracy for predicting the global solar radiation on a horizontal plane, which are interesting in several solar energy applications (Solar water heating, Solar furnaces and Photovoltaic Cells….etc).
One of the more significant findings to emerge from this study is that this knowledge can help planners and decision makers to make preliminary planning and decide the possible candidate regions for solar power plants, which will be integral for achieving the reduce dependence on fossil fuel-based energy in the future.
The authors are grateful to the Research Unit in Renewable Energies in Saharan Medium (RURESM) and laboratory of Energy Environment and Information System (LEEIS), for supporting this research.
The authors declare there are no conflicts of interest in this paper.
[1] | Osman P, Behrens S, Griffin D, et al. Ocean Renewable Energy: 2015-2050. Commonwealth Scientific and Industrial Research Organisation (CSIRO), 2011. Available from: http://www.csiro.au/Organisation-Structure/Flagships/Energy-Flagship/Ocean-renewable-energy.aspx. |
[2] |
Behrens S, Hayward J, Hemer M, et al. (2012) Assessing the wave energy converter potential for Australian coastal regions. Renew Energ 43: 210-217. doi: 10.1016/j.renene.2011.11.031
![]() |
[3] |
Hemer M, Griffin D (2010) The wave energy resource along Australia's southern margin. J Renew Sust Energ 2: 043108. doi: 10.1063/1.3464753
![]() |
[4] |
Hayward J, Behrens S, McGarry S, et al. (2012) Economic modelling of the potential of wave energy. Renew Energ 48: 238-250. doi: 10.1016/j.renene.2012.05.007
![]() |
[5] | Jones A, Finley W. Recent development in salinity gradient power; 2003 12 April 2004; San Francisco, USA. pp. 3. |
[6] | Polinder H, Scuotto M. Wave Energy Converters and their Impact on power systems; 2005 18 November 2005; Amsterdam, Netherland. pp. 9. |
[7] | Harris R, Johanning L, Wolfram J. Mooring systems for wave energy converters: A review of design issues and choices; 2004; Blyth, UK. |
[8] |
Drew B, Plummer A, Sahinkaya M (2009) A review of wave energy converter technology. Proc IMechE 223: 15. doi: 10.1243/09544097JRRT174
![]() |
[9] | Falcao A (2010) Wave energy utilization: A review of the technologies Renew Sust Energ Rev 14: 19. |
[10] | Muetze A, Vining J. Ocean Wave Energy Conversion - A Survey, 2006 8-12 October 2006; Tempa, USA. pp.1410-1417. |
[11] |
López I, Andreu J, Ceballos S, et al. (2013) Review of wave energy technologies and the necessary power-equipment. Renew Sust Energ Rev 27: 413-434. doi: 10.1016/j.rser.2013.07.009
![]() |
[12] | Czech B, Bauer P (2012) Wave Energy Converter Concepts Design Challenges and Classification. Ieee Ind Electr Mag 6: 4-16. |
[13] |
Pelamis. Pelamis Brochure, 2010. Available from: http://www.pelamiswave.com/pelamis-technology. |
[14] | Soerensen H, Friis-Madsen E, Panhauser W, et al. Development of Wave Dragon from Scale 1:50 to Prototype; 2003; Cork, Ireland. |
[15] | IEA IEA Ocean Energy Systems Links. International Energy Agency (IEA). pp. International overview. |
[16] | Wave Star Energy, The commercial 500 kW Wave Star machine. Wave Star Energy, 2014. Available from: http://www.wavestarenergy.com. |
[17] |
Previsic M, Bedard R, Hagerman G, et al. System Level Design, Performance and Costs for San Francisco California Pelamis Offshore Wave Power Plant. 2004. Available from: http://oceanenergy.epri.com/attachments/wave/reports/006_San_Francisco_Pelamis_Conceptual_Design_12-11-04.pdf. |
[18] | Sea Generation The SeaGen Project. Sea Generation Ltd. |
[19] | Atlantis Resources (2010) Atlantis Resources Corporation AK turbine illustration. |
[20] |
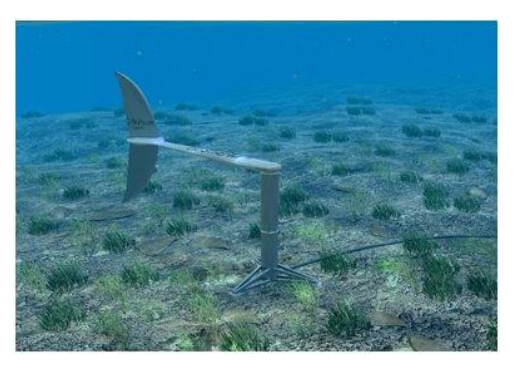
BioPower Systems. Technologies - BioSTREAM, 2010. Available from: http://www.biopowersystems.com/biostream.html. |
[21] |
Newcastle City Council, Newcastle City Council - Water. 2009. Available from: http://www.newcastle.nsw.gov.au/environment/flooding_and_waterways/urban_water_cycle. |
[22] | Fane T (2011). Personal communication: UNESCO Centre for Membrane Science and Technology. |
[23] |
watertechnology.net, Tuas seawater desalination plant -, Singapore. Available from: http://www.water-technology.net/projects/tuas-seawater-desalination/. |
[24] |
watertechnology.net, Perth seawater desalination plant, Australia. Available from: http://www.water-technology.net/projects/perth/. |
[25] |
Tewari P, Hanra M, Ramani M (1987) Relative technoeconomics of multistage flash distillation and reverse osmosis for seawater desalination - a case study. Desalination 64: 203-210. doi: 10.1016/0011-9164(87)90096-8
![]() |
[26] | Narmine H, El-Fiqi A (2003). Mechanical vapour compression desalination systems - a case study Desalination Malta 143-150. |
[27] | Tsai CF, Tzong TJ, Wu FHY (1993) Wave powered desalination apparatus with turbine-driven pressurization. Google Patents. |
[28] |
watertechnology.net, Hadera desalination plant, Israel. Available from: http://www.water-technology.net/projects/hadera-desalination/. |
[29] | watertechnology.net, Tampa Bay seawater desalinatin plant, United States of America. Available from: http://www.water-technology.net/projects/tampa/. |
[30] | Folley M, Whittaker T (2009) The cost of water from an autonomous wave-powered desalination plant. Renew Energ 34: 6. |
[31] | Sharmila N, Jalihal P, Swamy A, et al. (2004) Wave powered desalination system. Energ 29: 3. |
[32] | Hicks D, Pleass C, Mitcheson G. DELBUOY: wave-powered seawater desalination system; 1988 31 Octpber-2 November 1988; Baltimore, USA. pp. 1049-1054. |
[33] | O'Grady J, McInnes K (2010) Extreme wind waves and their relationship to storm surges in northeastern Bass Strait. Aust Meteorol Oceanogr J 60: 265-275. |
[34] |
Uppsala University Wave Power Project - Lysekil. Uppsala University. Available from: http://www.el.angstrom.uu.se/forskningsprojekt/WavePower/Lysekilsprojektet_E.html. |
[35] |
Clean Development Mechanism, Project 0349: Sihwa Tidal Power Plant. UNFCCC, 2004. Available from: http://cdm.unfccc.int/Projects/DB/DNV-CUK1143710269.08. |
[36] | Langhamer O, Haikonen K, Sundberg J (2010) Wave power - sustainable energy or environmentally costly? A review with special emphasis on linear wave energy converters. Renew Sust Energ Rev 14: 1329-1335. |
[37] |
Boehlert G, Gill A (2010) Environmental and ecological effects of ocean renewable energy development: a current synthesis. Oceanography 23: 68-81. doi: 10.5670/oceanog.2010.46
![]() |
[38] | Thorpe T, Picken M (1993) Wave energy devices and the marine environment. Sci Meas Tech 140: 63-70. |
[39] |
Hammons T (1993) Tidal power. P IEEE 81: 419-433. doi: 10.1109/5.241486
![]() |
[40] |
Pelc R, Fujita R (2002) Renewable energy from the ocean. Marine Policy 26: 471-479. doi: 10.1016/S0308-597X(02)00045-3
![]() |
[41] |
Dadswell M, Rulifson R (1994) Macrotidal estuaries: a region of collision between migratory marine animals and tidal power development. Biol J Linn Soc 51: 93-113. doi: 10.1111/j.1095-8312.1994.tb00947.x
![]() |
[42] | Soerensen H, Naef S (2008) Report and technical specificatin of reference technologies (wave and tidal power plant). NEEDS Project Rep. |
[43] |
Hammar L, Andersson S, Eggertsen L, et al. (2013) Hydrokinetic Turbine Effects on Fish Swimming Behaviour. PLoS ONE 8: e84141. doi: 10.1371/journal.pone.0084141
![]() |
[44] | Jacobson P, Amaral S, Castro-Santas T, et al. (2012) Environmental effects of hydrokinetic turbines on fish: desktop and laboratory flume studies. Electric Power Research Institute. |
[45] | Vega L (1995) The 210 kW open cycle OTEC experimental apparatus: status report; 1995 9-12 October 1995; San Diego, USA. pp. 1110-1115. |
[46] | Wilde P (2010) Environmental Monitoring and Assessment Program at Potential OTEC Sites. 6th Annual Ocean Thermal Energy Conversion Conference. Lawrence Berkley National Laboratory. |
[47] | Myers E, Hoss D, Matsumoto W, et al. (1986) The potential impact of ocean thermal energy conversion (OTEC) on fisheries. NOAA Technical Report NMFS 40 1986. |
[48] |
Vega L, OTEC overview. OTEC News, 2011. Available from: http://www.otecnews.org/portal/otec-articles/ocean-thermal-energy-conversion-otec-by-l-a-vega-ph-d/. |
[49] |
Australian Fisheries Management Authority, 2014. Available from: http://www.afma.gov.au/managing-our-fisheries/environment-and-sustainability/marine-protected-areas/. |
[50] |
(IUCN) IUfCoN, Sustainable Fisheries Management, 2014. Available from: http://www.iucn.org/about/union/secretariat/offices/rowa/iucnwame_ourwork/iucnwame_marineprogramme/iucn_m_drosos/. |
[51] | Dähne M, Gilles A, Lucke K, et al. (2013) Effects of pile-driving on harbour porpoises (Phocoena phocoena) at the first offshore wind farm in Germany. Environ Res Lett 8: 1-16. |
[52] | Robinson S, Theobald P, Lepper P. Underwater noise generated from marine piling; 2014; Edinburgh, Scotland. pp. 070080. |
[53] |
Haikonen K, Sundberg J, Leijon M (2013) Characteristics of the operational noise from full scale wave energy converters in the Lyskil Project: estimation of potential environmental impacts. Energies 6: 2562-2582. doi: 10.3390/en6052562
![]() |
[54] | Copping A, Battey H, Brown-Saracino J, et al. (2014) An international assessment of the environmental effects of marine energy development. Ocean Coast Manage: 1-11. |
[55] |
Bolin K, Almgren M, Ohlsson E, et al. (2014) Long term estimations of low frequency noise levels over water from an off-shore wind farm. J Acoust Soc Am 135: 1106-1114. doi: 10.1121/1.4863302
![]() |
[56] | Hampton T, Hofford A (2011) West Coast Wave Energy Planning and Assessment Framework: Assessment of Information and Approaches for Ocean Renewable Energy Siting and Planning. Oregon Wave Energy Trust: Pacific Energy Ventures. |
[57] | oregon.gov, Oregon Territorial Sea Plan (Part 5). Use of the Territorial Sea for the Development of Renewable Energy Faciliteis or Other Related Structures, Equipment or Facilites. 2014. Available at: http://wwworegongov/LCD/OCMP/Pages/Ocean_TSP.aspx. |
[58] | Gonzalez-Santamaria R, Zou Q, Pan S (2013) Impacts of a wave farm on waves, currents and coastal morphology in South West England. Estuaries Coasts 1: 1-14. |
[59] | Veigas M, Ramos V, Iglesias G (2014) A wave arm for an island: detailed effects on the nearshore wave climate. Energy In press. |
[60] | Bento A, Rusu E, Martinho P, et al. (2014) Assessment of the changes induced by a wave energy farm in the nearshore wave conditions. Comput Geosci In press. |
[61] | Copping A, Hanna L, Van Cleve B, et al. (2014) Environmental risk evaluation system - an approach to ranking risk of oean energy development on coastal and estuarine environments. Estuaries Coasts: 1-16. |
1. | D. Benatiallah, K Bouchouicha, A Benatiallah, A. Harouz, B. Nasri, 2021, Chapter 54, 978-3-030-63845-0, 573, 10.1007/978-3-030-63846-7_54 | |
2. | Babahadj Abdeljabar, Lakhdar Rahmani, Bellaoui Mebrouk, Bouchouicha Kada, 2020, Estimating daily diffuse solar radiation using neuro-fuzzy, fuzzy C-means and subtractive clustering, 9781450376556, 1, 10.1145/3447568.3448516 | |
3. | Djelloul BENATIALLAH, Kada BOUCHOUICHA, Ali BENATIALLAH, Abdelkader HARROUZ, Bahous Nasri, Forecasting of Solar Radiation using an Empirical Model, 2019, 01, 2710849X, 212, 10.46657/ajresd.2019.1.2.11 | |
4. | D. Benatiallah, K. Bouchouicha, A. Benatiallah, A. Harouz, B. Nasri, 2022, Chapter 16, 978-3-030-92037-1, 167, 10.1007/978-3-030-92038-8_16 | |
5. | Djelloul Benatiallah, Kada Bouchouicha, 2021, Comparative study of models solar radiation in Sub-Saharan environment, 978-1-6654-0833-2, 1, 10.1109/SIENR50924.2021.9631924 | |
6. | M.Y. Boudjella, A.H. Belbachir, A.S.A. Dib, M. Meftah, A Geant4 Monte Carlo toolkit-based radiative transfer model for studying the impact of aerosols, 2024, 02731177, 10.1016/j.asr.2024.07.057 | |
7. | A. Khechekhouche, N. Smakdji, M. El Haj Assad, A. E. Kabeel, Mohamed Abdelgaied, M. Ghodbane, A. Allal, Ravishankar Sathyamurthy, Impact of Solar Energy and Energy Storage on a Still’s Nocturnal Output, 2023, 51, 0090-3973, 10.1520/JTE20220701 | |
8. | Y. Halimi, S. Halimi, Z. Bouzid, N. Ghellai, Spatially-optimized photovoltaic site selection in Algeria: Assessing solar potential using high-resolution data, GIS, and multicriteria analysis, 2025, 323, 01968904, 119176, 10.1016/j.enconman.2024.119176 |
Station | Sites | Longitude | Latitude | Altitude (m) |
Station 1 | Tamanrasset | 5°52’E | 22°78’N | 1320 |
Station 2 | Adrar | 0°28’W | 27°88’N | 269 |
Station 3 | El Goléa | 2°87’E | 30°58’N | 380 |
Sensor | Kipp & Zonen CMP21 | Kipp & Zonen CMP 6 | Eppley PSP |
Maximum operational irradiance | 4000 W/m2 | 2000 W/m2 | 4000 W/m2 |
Spectral range | 270 to 3000 nm | 285 to 2800 nm | 305-2800 nm |
Sensitivity | 7 to 14 μV/W/m2 | 5-20 μV/W/m2 | 7 mV/kW/m2 |
Directional response | < 10 W/m2 | < 20 Wm-2 | < ±10 W/m2 |
Non-stability (Change/year) | < 0.5% | 0.5% | < ±0, 2% |
Temperature response | < 1% (-20° to +50°) | 4% (0° to +100°) | < ±1% |
Response time | < 5 s | 18 s | ~8 sec |
Non-linearity | < 0.2 % | 0.5% | < ±0, 2% |
Operating and storage temperature range | -40° to +80° | -40° to +80° | -40° to +80° |
Zone climatic | β | α |
Rural site | 0.05 | 0.11 |
Urban site | 0.10 | 0.22 |
Industrial site | 0.30 | 0.66 |
Month | A | B | C |
Jan | 1230 | 0.142 | 0.058 |
Feb | 1215 | 0.144 | 0.060 |
Mar | 1186 | 0.156 | 0.071 |
Apr | 1136 | 0.180 | 0.097 |
May | 1104 | 0.196 | 0.121 |
Jun | 1088 | 0.205 | 0.134 |
Jul | 1085 | 0.207 | 0.136 |
Aug | 1107 | 0.201 | 0.122 |
Sep | 1152 | 0.177 | 0.092 |
Oct | 1193 | 0.160 | 0.073 |
Nov | 1221 | 0.149 | 0.063 |
Dec | 1234 | 0.142 | 0.057 |
Day | Model | Station 1 (Tamanreset) | Station 2 (Adrar) | Station 3 (El -goléa) | ||||||
MBE (Wh/m2) | RMSE (Wh/m2) | R | MBE (Wh/m2) | RMSE (Wh/m2) | R | MBE (Wh/m2) | RMSE (Wh/m2) | R | ||
January 15 | Model 1 | 39.73 | 51.07 | 0.9958 | 54.86 | 55.53 | 0.9996 | -19.55 | 28.56 | 0.9966 |
Model 2 | 57.96 | 63.90 | 0.9959 | 23.84 | 24.22 | 0.9996 | -43.28 | 52.72 | 0.9968 | |
Model 3 | 43.72 | 51.88 | 0.9957 | 40.18 | 40.34 | 0.9995 | -25.89 | 39.81 | 0.9961 | |
February 24 | Model 1 | 78.11 | 90.66 | 0.9988 | 80.95 | 82.47 | 0.9996 | -30.83 | 41.47 | 0.9971 |
Model 2 | 86.85 | 93.68 | 0.9989 | 30.84 | 32.11 | 0.9996 | -65.79 | 75.77 | 0.9968 | |
Model 3 | 69.64 | 79.61 | 0.9985 | 49.90 | 50.26 | 0.9996 | -47.45 | 61.66 | 0.9972 | |
March 22 | Model 1 | 63.72 | 81.30 | 0.9994 | 65.89 | 68.96 | 0.9995 | 8.17 | 15.13 | 0.9988 |
Model 2 | 67.33 | 76.89 | 0.9996 | 4.26 | 11.90 | 0.9995 | -0.47 | 11.47 | 0.9987 | |
Model 3 | 31.66 | 47.72 | 0.9990 | 30.33 | 31.50 | 0.9995 | 6.79 | 14.39 | 0.9977 | |
April 25 | Model 1 | 0.45 | 47.14 | 0.9971 | 61.61 | 64.23 | 0.9997 | 35.81 | 40.51 | 0.9976 |
Model 2 | 3.33 | 34.99 | 0.9976 | -15.09 | 16.40 | 0.9996 | -35.34 | 39.27 | 0.9972 | |
Model 3 | -43.36 | 54.50 | 0.9965 | 25.33 | 25.98 | 0.9997 | 1.44 | 16.02 | 0.9976 | |
May 12 | Model 1 | -2.79 | 46.63 | 0.9977 | 31.77 | 38.18 | 0.9997 | 27.72 | 28.00 | 0.9999 |
Model 2 | -0.23 | 33.70 | 0.9982 | -51.69 | 52.15 | 0.9996 | -58.70 | 62.50 | 0.9999 | |
Model 3 | -51.17 | 59.66 | 0.9971 | -4.35 | 7.77 | 0.9997 | -8.22 | 19.73 | 0.9999 | |
June 03 | Model 1 | 31.96 | 53.53 | 0.9992 | 48.57 | 50.76 | 0.9999 | -54.49 | 58.70 | 0.9987 |
Model 2 | 33.87 | 45.06 | 0.9995 | -41.51 | 42.34 | 0.9998 | -147.99 | 148.69 | 0.9984 | |
Model 3 | -18.97 | 30.65 | 0.9988 | 12.63 | 13.71 | 0.9999 | -91.59 | 92.42 | 0.9987 | |
July 29 | Model 1 | 55.64 | 70.84 | 0.9990 | -2.01 | 23.91 | 0.9995 | 18.11 | 19.45 | 0.9998 |
Model 2 | 57.37 | 65.31 | 0.9992 | -95.11 | 95.52 | 0.9994 | -76.17 | 78.41 | 0.9999 | |
Model 3 | 5.98 | 25.93 | 0.9986 | -39.24 | 40.32 | 0.9996 | -18.68 | 22.87 | 0.9998 | |
August 23 | Model 1 | 55.64 | 70.84 | 0.9990 | 61.34 | 63.99 | 0.9999 | 3.32 | 10.21 | 0.9992 |
Model 2 | 57.37 | 65.31 | 0.9992 | -27.36 | 27.53 | 0.9999 | -88.54 | 91.20 | 0.9990 | |
Model 3 | 5.98 | 25.93 | 0.9986 | 21.88 | 22.22 | 0.9999 | -33.84 | 37.82 | 0.9992 | |
September 13 | Model 1 | 27.40 | 48.27 | 0.9985 | 50.61 | 54.58 | 0.9993 | 9.60 | 23.83 | 0.9986 |
Model 2 | 25.58 | 38.02 | 0.9987 | -32.61 | 33.90 | 0.9992 | -71.28 | 72.22 | 0.9985 | |
Model 3 | -11.18 | 29.02 | 0.9982 | 8.70 | 12.47 | 0.9993 | -30.49 | 32.61 | 0.9986 | |
October 17 | Model 1 | 20.90 | 40.20 | 0.9986 | 59.00 | 60.61 | 0.9996 | 22.54 | 34.53 | 0.9932 |
Model 2 | 18.56 | 29.54 | 0.9988 | -10.79 | 12.09 | 0.9996 | -45.16 | 50.20 | 0.9927 | |
Model 3 | -10.55 | 25.86 | 0.9984 | 17.83 | 18.36 | 0.9996 | -14.95 | 25.73 | 0.9933 | |
November 13 | Model 1 | 40.12 | 50.04 | 0.9987 | 50.81 | 51.58 | 0.9999 | -20.47 | 35.79 | 0.9899 |
Model 2 | 42.43 | 46.79 | 0.9988 | -0.87 | 2.50 | 0.9999 | -76.67 | 80.84 | 0.9895 | |
Model 3 | 20.20 | 29.06 | 0.9985 | 21.06 | 21.13 | 0.9999 | -51.21 | 57.01 | 0.9900 | |
December 16 | Model 1 | 18.26 | 31.05 | 0.9981 | 44.53 | 44.73 | 0.9994 | -20.29 | 28.11 | 0.9954 |
Model 2 | 34.79 | 39.33 | 0.9984 | 13.20 | 14.18 | 0.9995 | -46.85 | 54.68 | 0.9956 | |
Model 3 | 19.20 | 27.90 | 0.9978 | 31.07 | 32.00 | 0.9993 | -28.61 | 40.21 | 0.9949 |
Station | Model | MAPE (%) | MBE (Wh/m2/day) | rMBE (%) | RMSE (Wh/m2/day) | rRMSE (%) | R |
Station1 (Tamanrasset) | 1 | 6.87 | 30.43 | 4.64 | 55.98 | 8.54 | 0.9953 |
2 | 6.65 | 37.32 | 5.69 | 53.16 | 8.11 | 0.9955 | |
3 | 4.99 | 2.44 | 0.37 | 42.55 | 6.49 | 0.9960 | |
Station 2 (Adrar) | 1 | 7.07 | 50.07 | 6.74 | 56.43 | 7.59 | 0.9935 |
2 | 4.00 | -18.23 | -2.45 | 39.16 | 5.27 | 0.9875 | |
3 | 3.62 | 18.78 | 2.53 | 30.47 | 4.10 | 0.9933 | |
Station 3 (El-goléa) | 1 | 4.12 | -2.87 | -0.48 | 30.59 | 5.07 | 0.9966 |
2 | 10.92 | -65.41 | -10.84 | 74.84 | 12.40 | 0.9938 | |
3 | 5.63 | -29.89 | -4.95 | 42.89 | 7.11 | 0.9941 |