Research article Special Issues

Characterization of designed cobaltacarborane porphyrins using conductive probe atomic force microscopy

  • Received: 01 March 2016 Accepted: 16 March 2016 Published: 21 March 2016
  • Porphyrins and metalloporphyrins have unique chemical and electronic properties and thus provide useful model structures for studies of nanoscale electronic properties. The rigid planar structures and -conjugated backbones of porphyrins convey robust electrical characteristics. For our investigations, cobaltacarborane porphyrins were synthesized using a ring-opening zwitterionic reaction to produce isomers with selected arrangements of carborane clusters on each macrocycle. Experiments were designed to investigate how the molecular structure influences the self-organization, surface assembly, and conductive properties of three molecular structures with 2, 4, or 8 cobaltacarborane substituents. Current versus voltage (I-V) spectra for designed cobaltacarborane porphyrins deposited on conductive gold substrates were acquired using conductive probe atomic force microscopy (CP-AFM). Characterizations with CP-AFM provide capabilities for obtaining physical measurements and structural information with unprecedented sensitivity. We found that the morphology of cobaltacarborane porphyrin structures formed on surfaces depends on a complex interplay of factors such as the solvent used for dissolution, the nature of the substrate, and the design of the parent molecule. The conductive properties of cobaltacarborane porphyrins were observed to change according to the arrangement of cobaltacarborane substituents. Specifically, the number and placement of the cobaltacarborane ligands on the porphyrin macrocycle affect the interactions that drive porphyrin self-assembly and crystallization. Interestingly, coulombic staircase I-V profiles were detected for a porphyrin with two cobaltacarborane substituents.

    Citation: Venetia D. Lyles, Wilson K. Serem, Erhong Hao, M. Graça H. Vicente, Jayne C. Garno. Characterization of designed cobaltacarborane porphyrins using conductive probe atomic force microscopy[J]. AIMS Materials Science, 2016, 3(2): 380-389. doi: 10.3934/matersci.2016.2.380

    Related Papers:

    [1] Minseok Kim, Yeongjong Kim, Yeoneung Kim . Physics-informed neural networks for optimal vaccination plan in SIR epidemic models. Mathematical Biosciences and Engineering, 2025, 22(7): 1598-1633. doi: 10.3934/mbe.2025059
    [2] Yoon-gu Hwang, Hee-Dae Kwon, Jeehyun Lee . Feedback control problem of an SIR epidemic model based on the Hamilton-Jacobi-Bellman equation. Mathematical Biosciences and Engineering, 2020, 17(3): 2284-2301. doi: 10.3934/mbe.2020121
    [3] Dan Shi, Shuo Ma, Qimin Zhang . Sliding mode dynamics and optimal control for HIV model. Mathematical Biosciences and Engineering, 2023, 20(4): 7273-7297. doi: 10.3934/mbe.2023315
    [4] Kento Okuwa, Hisashi Inaba, Toshikazu Kuniya . Mathematical analysis for an age-structured SIRS epidemic model. Mathematical Biosciences and Engineering, 2019, 16(5): 6071-6102. doi: 10.3934/mbe.2019304
    [5] Holly Gaff, Elsa Schaefer . Optimal control applied to vaccination and treatment strategies for various epidemiological models. Mathematical Biosciences and Engineering, 2009, 6(3): 469-492. doi: 10.3934/mbe.2009.6.469
    [6] Toshikazu Kuniya, Yoshiaki Muroya, Yoichi Enatsu . Threshold dynamics of an SIR epidemic model with hybrid of multigroup and patch structures. Mathematical Biosciences and Engineering, 2014, 11(6): 1375-1393. doi: 10.3934/mbe.2014.11.1375
    [7] Yoichi Enatsu, Yukihiko Nakata, Yoshiaki Muroya . Global stability for a class of discrete SIR epidemic models. Mathematical Biosciences and Engineering, 2010, 7(2): 347-361. doi: 10.3934/mbe.2010.7.347
    [8] Abdennasser Chekroun, Mohammed Nor Frioui, Toshikazu Kuniya, Tarik Mohammed Touaoula . Global stability of an age-structured epidemic model with general Lyapunov functional. Mathematical Biosciences and Engineering, 2019, 16(3): 1525-1553. doi: 10.3934/mbe.2019073
    [9] Rinaldo M. Colombo, Mauro Garavello . Optimizing vaccination strategies in an age structured SIR model. Mathematical Biosciences and Engineering, 2020, 17(2): 1074-1089. doi: 10.3934/mbe.2020057
    [10] Mostafa Adimy, Abdennasser Chekroun, Claudia Pio Ferreira . Global dynamics of a differential-difference system: a case of Kermack-McKendrick SIR model with age-structured protection phase. Mathematical Biosciences and Engineering, 2020, 17(2): 1329-1354. doi: 10.3934/mbe.2020067
  • Porphyrins and metalloporphyrins have unique chemical and electronic properties and thus provide useful model structures for studies of nanoscale electronic properties. The rigid planar structures and -conjugated backbones of porphyrins convey robust electrical characteristics. For our investigations, cobaltacarborane porphyrins were synthesized using a ring-opening zwitterionic reaction to produce isomers with selected arrangements of carborane clusters on each macrocycle. Experiments were designed to investigate how the molecular structure influences the self-organization, surface assembly, and conductive properties of three molecular structures with 2, 4, or 8 cobaltacarborane substituents. Current versus voltage (I-V) spectra for designed cobaltacarborane porphyrins deposited on conductive gold substrates were acquired using conductive probe atomic force microscopy (CP-AFM). Characterizations with CP-AFM provide capabilities for obtaining physical measurements and structural information with unprecedented sensitivity. We found that the morphology of cobaltacarborane porphyrin structures formed on surfaces depends on a complex interplay of factors such as the solvent used for dissolution, the nature of the substrate, and the design of the parent molecule. The conductive properties of cobaltacarborane porphyrins were observed to change according to the arrangement of cobaltacarborane substituents. Specifically, the number and placement of the cobaltacarborane ligands on the porphyrin macrocycle affect the interactions that drive porphyrin self-assembly and crystallization. Interestingly, coulombic staircase I-V profiles were detected for a porphyrin with two cobaltacarborane substituents.


    The susceptible-infective-removed-susceptible (SIRS) model is one of the most popular epidemic models, in which total host population is divide into three classes called $ susceptible\; (S) $, $ infective\; (I) $ and $ removed\; (R) $. Since the Kermack and McKendrick pioneering work [1], a large number of studies have been carried out on the model of continuous infectious diseases attempting to gain a better understanding of diseases transmission, especially for the control policies and dynamics [2,3,4,5]. Recent years, many researchers have studied the epidemic with SIRS models such as COVID-19(2019), hand-foot-and-mouth diseases(HFMD) and other infectious diseases recently. Although scholars have flocked to study many properties of the SIRS models, there are still many aspects that deserve further study, such as the threshold dynamics of SIRS model with vaccination and optimal control using dynamic programming method.

    In studying the dynamics of the disease, one of the most important concepts is the basic reproduction number $ R_0 $. It is epidemiologically defined as the expected number of secondary cases produced by a typical infectious individual during its entire infectious period in a completely susceptible host population. To investigate the global behavior of the prevalence of infectious diseases, the stability analysis of equilibrium for epidemic models have been carried out (see [6,7] and the references therein). For ordinary differential SIRS models, Mena-Lorca and Hethcote considered several kinds of SIRS epidemic models and a threshold parameters were also found in [6] to determine whether the disease dies out or approaches to an endemic equilibrium, we also note that the global stability of SIRS epidemic model have already been investigated and the threshold theorems are well obtained. In the subsequent studies, it was generally believed that the introduction of age-structure into epidemic models is necessary and reasonable. Since the fact that the age structure of a population affects the dynamics of disease transmission was recognized, various age-structured epidemic models have been investigated by many authors. Some theoretics on the transmission dynamics of age-structured epidemic models have been developed in [8,9,10,11]. He et al. [12] studied the optimal birth control of age-dependent competitive species. Yang et al. [13] proposed epidemic model with age-since-infection and diffusion, the next generation operator $ R $ is also given as the basic regeneration numbers. In paper [14], Yang et al. also studied the threshold dynamics by the method of Lyapunov functionals for an age-of-infection epidemiological model with nonlinear incidence rate. Chekroun et al. [15] showed the stability of the equilibrium by using Lyapunov functions. Lan et al. [16] just studied the impact of hospital resources and environmental perturbation to the dynamics of SIRS model. But the effect of vaccination on threshold dynamics was not considered in these articles.

    In fact, we notice that vaccination has a significant impact on the thresholds dynamics of many infectious diseases, such as COVID-19, HPV, etc. Obviously, vaccination of susceptible individuals can greatly reduce the probability that susceptible individuals become infected. Thus, decision makers hope to achieve the optimal proportion of vaccines with the lowest cost. Optimal control is a promising strategy to control disease outbreaks. The main purpose of using the control in some diseases is to search for the most effective one that reduces the infection to a minimum level while minimizing the cost of applying control measures. In papers [7,9,17], the strategies such as health promotion campaigns or lockdown policies can contribute to reducing the disease transmission. In paper [18], Mu and Zhang investigated the near-optimal control of SIRS multi-strain epidemic model with age-structure using Pontryagin maximum principle. Bolzoni et al. [19] investigated optimal control of epidemic size and duration with limited resources. Zhou et al. [20] researched optimal isolation strategies of emerging infectious diseases with limited resources. In papers [21,22,23], some measures correspond to screening and quarantining of infected were implemented to achieve the purpose of controlling the disease.

    However, we note that the most of these articles by using maximum principle to show optimal controls and only present necessary conditions. Defectively, the method of maximum principle only addresses the optimal control problem with initial value case of $ t_0 = 0 $. In fact, vaccination can be administered at any time $ t = t_0 $ in the control of the disease. Surpassingly, the dynamic programming method can give the necessary and sufficient conditions for the existence of optimal control via the HJB equation at any initial times $ t = t_0 $ and initial states. In other words, the dynamic programming method is an extension of the maximum principle, namely, the dynamic programming method is equivalent to maximum principle method when $ t_0 = 0 $.

    Overall, the threshold dynamics results about age-structured SIRS epidemic models with the proportion of the vaccine injections are comparatively scarce, as well as few articles show that dynamic programming approach to solve the optimal control problem. Thus, in this paper, taking into account for the effect of the proportion of the vaccine injections, we incorporate the vaccine injection rate in solving the threshold of age-structured SIRS epidemic models. And vaccination optimal control is also obtained through dynamic programming approach.

    The layout of this paper is as follows: in section 2, an age-structure SIRS epidemic model is reproduced and new age-structure SIRS epidemic model with vaccination is given; in section 3, we give the basic regeneration number and discuss the threshold dynamics; in section 4, we formulate and solve the corresponding optimal control problem. The existence of optimal control is proved by HJB equation and the expression of optimal control is present. in section 5, some numerical simulations are performed to demonstrate the theoretical results. Brief conclusions are given in section 6.

    We reproduce the age-structured SIRS epidemic model based on paper [24] as follows

    $ {dS(a,t)=[S(a,t)a+λ(a)μ(a)S(a,t)β(a)S(a,t)I(a,t)+ρ(a)η(a)I(a,t)]dt,dI(a,t)=[I(a,t)a+β(a)S(a,t)I(a,t)δ(a)I(a,t))]dt,dR(a,t)=[R(a,t)a+(1ρ(a))η(a)I(a,t)(μ(a)+γ(a))R(a,t)]dt,S(a,0)=S0(a),I(a,0)=I0(a),R(a,0)=R0(a),
    $
    (2.1)

    where $ S(a, 0) = S_0(a), I(a, 0) = I_0(a), R(a, 0) = R_0(a) $ are initial conditions, with the following conditions:

    $ {S(0,t)=A0β(a)S(a,t)da,I(0,t)=k1A0β(a)I(a,t)da,R(0,t)=k2A0β(a)R(a,t)da,
    $
    (2.2)

    where $ k_1, \; k_2\in[0, 1] $ present the weight of the infected and recovered, respectively. All the parameters are related to age $ a $, positive and bounded, These parameters and their meaning are listed in the Table 1, where $ \eta (a) = \sigma (a)+\alpha(a) $, and $ \delta(a) = \mu(a)+\phi(a)+ \sigma (a)+\alpha(a) $.

    Table 1.  Parameter values used in numerical simulations.
    Notation Biological meanings
    $ S(a, t) $ Densities of susceptible individuals of age $ a $ at time $ t $
    $ I(a, t) $ Densities of infective individuals of age $ a $ at time $ t $
    $ R(a, t) $ Densities of recovery individuals of age $ a $ at time $ t $
    $ \lambda (a) $ Recruitment rate of age $ a $
    $ \mu (a) $ Mortality rate of age $ a $
    $ \beta (a) $ Transmission coefficient of age $ a $
    $ \gamma (a) $ Immunity loss rate of age $ a $
    $ \delta (a) $ Infected removal rate of age $ a $
    $ \eta (a) $ Infected recovery rate of age $ a $
    $ \rho (a) $ Switch between $ SIS \leftrightarrow SIR(S) $ of age $ a $
    $ \alpha (a) $ Treatment rate of age $ a $
    $ \sigma (a) $ Nature cure rate of age $ a $
    $ \phi (a) $ Infected-induced mortality rate of age $ a $

     | Show Table
    DownLoad: CSV

    As we all know that the age density distribution function of the total population reaches a stable state, i.e

    $ S(a,t)+I(a,t)+R(a,t)=P(a).
    $
    (2.3)

    We focus on threshold dynamics on an age-structured SIRS epidemic model with vaccination. The spread of many epidemics are age-related, such as Human Papilloma Virus (HPV) spread across the population after ten years olds usually. And the World Health Organization believes that the most appropriate age for HPV vaccination was 11-12 years old. Therefore, it makes sense to study the vaccination is only given for a certain age to age-structured SIRS epidemic model.

    The introduced vaccination rate $ u(A_0) $ satisfies $ 0\leq u(A_0)\leq 1 $ and is only given for a certain age and susceptible individuals of age $ A_0 $ is inoculated at some point. The disease does not spread among people younger than age $ A_0 $, that is, there are no patients before the vaccination age $ A_0 $. Therefore, we can get that the system satisfied by the susceptible, infective, and recovering individuals based on model (2.1) as following

    $ {S(a,t)=P(a),I(a,t)=0,R(a,t)=0,0<a<A0,dS=(Sa+λ(a,t)μ(a)Sϱ(a,t)S+ρ(a)η(a)I)dt,A0<a<A,dI=(Ia+ϱ(a,t)Sδ(a)I)dt,A0<a<A,dR=(Ra+(1ρ(a))η(a)Iμ(a)Rdt,A0<a<A,S(A0,t)=(1u(A0))S(A0,t),I(A0,t)=I(A0,t)=0,R(A0,t)=u(A0)S(A0,t),S(a,0)=S0(a),I(a,0)=I0(a),R(a.0)=R0(a),ϱ(a,t)=k(a)AA0I(ˆa,t)dˆa,
    $
    (2.4)

    we call infectivity

    $ ϱ(a,t)=β(a)I(a,t)=k(a)AA0I(ˆa,t)dˆa<,
    $

    where $ S(A_0^-, t) $ and $ I(A_0^-, t) $ are the densities of susceptible and recovering individuals in the left neighborhood of age $ A_0 $, $ k(a) $ is a positive continuous function. The vaccination rate $ u(A_0) $ is a constant and $ k(a) $ is a nonnegative continuous function defined on $ 0\leq a \leq A $, where $ A $ is the maximum age.

    In this paper, unless otherwise specified. The $ \mathbb{H} $ represents the Hilbert space, with inner product

    $ φ1,ϕ1=A0φ1(a)ϕ1(a)da,φ1,ϕ1H,
    $
    (2.5)

    and we consider the state equations on space $ L^1(0, A; \mathbb{H}^3) $, when $ \varphi = (\varphi_1, \varphi_2, \varphi_3) $ and $ \phi = (\phi_1, \phi_2, \phi_3) $, $ \varphi_i, \; \phi_i \in \mathbb{H} $, the definition of inner product on $ L^1(0, A; \mathbb{H}^3) $ as

    $ φ,ϕ=A0(φ1(a)ϕ1(a)+φ2(a)ϕ2(a)+φ3(a)ϕ3(a))da=A0φ(a)ϕ(a)da,φ,ϕH3.
    $
    (2.6)

    The existence of time-independent equilibrium solutions for the model (2.4) is discussed. Obviously, the model (2.4) has disease-free equilibrium

    $ S(a,t)=P(a),I(a,t)=0,R(a,t)=0,0<a<A0,S(a,t)=(1u(A0))P(a),I(a,t)=0,R(a,t)=u(A0)P(a),A0<a<A.
    $
    (3.1)

    In order to obtain the endemic disease equilibrium solution, $ S(a, t) = S(a), \; I(a, t) = I(a) $ and $ R(a, t) = R(a) $ are substituted into the model (2.4) obtained

    $ R(a)=0,0<a<A0,R(a)=u(A0)P(a),A0<a<A.
    $
    (3.2)

    And we know when $ R_0(a) = u(A_0)P(a) $, the $ R(a, t) = u(A_0)P(a) $, and when the population reaches a dynamic equilibrium $ P(a) $, Combining the equations (2.3) and (3.2), and substitute into (2.4) for the equation that satisfies $ I(a, t) $. From (2.3), it shows that

    $ I(a)a+I(a)t=δ(a)I(a)+k(a)(P(a)I(a)R(a))D(t),
    $
    (3.3)

    where $ D (t) = \int _{A_0}^A I(\hat{a}, t)d\hat{a} $. Let $ \zeta (a, D(t)) = \delta(a)+ k(a)D(t) $, in order to solve the (3.3), when $ A_0 < a < A $, the expression of $ I(a, t) $ is

    $ I(a,t)=I0(at)exp(t0ζ(at+θ,D(θ))dθ)+[1u(A0)]t0exp(tτζ(at+θ,D(θ))dθ)×k(at+θ)P(at+θ)D(τ)dτ,a>t+A0,I(a,t)=[1u(A0)]aA0exp(aτζ(θ,D(ta+θ))dθ)×k(τ)P(τ)D(ta+τ)dτ,at+A0.
    $
    (3.4)

    we can substitute (3.4) into the $ D(t) $ yields when $ A_0 < a < A $

    $ D(t)=[1u(A0)]AA0aA0k(τ)P(τ)D(tτ)×exp(a+τaζ(θ,D(taτ+θ))dθ)dadτ+aA0I0(a)exp(t0ζ(a+θ,D(θ))dθ)da.
    $
    (3.5)

    Since

    $ \lim\limits_{t\rightarrow \infty} \int _{A_0}^a I_0(a) exp{(-\int_0^t \zeta (a+\theta , D(\theta))d \theta )}da \leq \int _{A_0}^a I_0(a) exp{(-\int_0^t \mu (a+\theta , N) d\theta )}da = 0, $

    obviously, we have $ D(t) = D_\infty $ if $ I(a, t) = I_{\infty} $ as $ t\rightarrow \infty $ is equilibrium of model, then

    $ D=[1u(A0)]AA0aA0k(τ)P(τ)exp(a+τaζ(θ,D)dθ)Ddadτ+aA0I0(a)exp(t0ζ(a+θ,D)dθ)da,
    $
    (3.6)

    then

    $ D=D[1u(A0)]AA0aA0k(τ)P(τ)exp(a+τaδ(θ)dθ)×exp(Da+τak(θ)dθ)dτda.
    $
    (3.7)

    Then it expresses $ I_{\infty} = 0 $ or

    $ 1=[1u(A0)]AA0aA0k(τ)P(τ)exp(a+τaδ(θ)dθ)×exp(Da+τak(θ)dθ)dτda.
    $
    (3.8)

    It is quite obvious the right-hand side of the equation (3.8) is the minus function about $ D_{\infty} $, thus, we can define

    $ R0=(1u(A0))A0aA0k(τ)p(τ)exp(aτδ(θ)dθ)dτda.
    $
    (3.9)

    When $ R_0 < 1 $, (3.7) has only a unique zero solution and no positive root, when $ R_0 > 1 $, the (3.7) formula has zero root and the only positive root $ I^* > 0 $ satisfies (3.8) formula, thus there are only positive root $ E^* = (S^*, I^*, R^*) $ of (2.4). For ease of analysis, we converse $ i(a, t) = \frac{I(a, t)}{(1-u(A_0))P} $, equation (2.4) about $ I(a, t) $ can be transformed into

    $ {i(a,t)t+i(a,t)a=[1i(a,t)][1u(A0)]k(a)AA0P(ˆa)i(ˆa,t)dˆaδ(a)i(a,t),a>A0,i(A0,t)=0,t0,i(a,0)=i0(a)=I0(a)(1u(A0))P,aA0.
    $
    (3.10)

    From the transformation, we can see that the existence and stability of the positive equilibrium of model (2.4) is equivalent to positive equilibrium of (3.10) model. $ R_0 $ can be used as a threshold for the existence or absence of endemic diseases. It is also a threshold for the disappearance of diseases. Let $ \hbar = 1-\frac{1}{R_0} $ and we call $ \hbar $ vaccination elimination point.

    Similar to the [25] method, the following conclusion can be obtained. Before discussing the global stability of equilibriums, we first propose the lemma 3.1, and the similar proof process have been presented in [26].

    Lemma 3.1. Let $ i_1(a, t) $ and $ i_2(a, t) $ are the solutions of the $(3.10)$ equations, satisfying $ i_1(a, 0) = i_{10}(a) \leq i_2(a, 0) = i_{20}(a) $, where $ i_{10}(a), \; i_{20}(a)\in K $, then there are following properties

    (1) $ i_j(a, t)\in K, \; j = 1, \; 2; $

    (2) $ \; i_1(a, t) \leq i_2(a, t), \; t \geq 0 $;

    (3) When $ 0 < \xi < 1 $, the solution $ i(a, t) $ of $(3.10)$ that the initial value satisfies the $ i(a, 0) = i_{10}(a)\xi $, then it must satisfy the $ i_1(a, t)\xi \leq i(a, t) $,

    where the $ K $ is denoted

    $ K={f(a,t)|f(a,t)C,f(0,t)=0,0f(a,t)1}.
    $

    Theorem 3.2. When $ R_0 < 1 $, the model $(3.10)$ has only a disease-free equilibrium, which is globally asymptotically stable, while when $ R_0 > 1 $, the model $(3.10)$ also has a unique endemic equilibrium $ E^* $, which is globally asymptotically stable and the disease-free equilibrium is unstable.

    Proof. We only consider the asymptotic behavior of solutions where the initial values of the model (3.10) satisfy $ 0\leq i(a, 0) \leq 1 $ in $ (A_0, A) $. The theorem of the global stability is given for solutions.

    It is not difficult to see if the model (3.10) has a positive equilibrium equivalent to the (3.5) has a positive root. Since the right of the (3.5) is reduced about $ D(t) $ and tends to zero when the $ D(t) $ tends to positive infinity. There is no positive real root to the (3.5) when $ R_0 < 1 $, and there is a unique positive real root when $ R_0 > 1 $, i.e. the model (2.4) has only a unique positive equilibrium when $ R_0 > 1 $ and, instead, no positive equilibrium when $ R_0 < 1 $.

    When $ R_0 < 1 $, in order to study the global stability of the disease-free equilibrium, expression of the solution of (3.10) about $ I(a, t) $ is obtained by using the characteristic line method

    $ i(a,t)=i0(at)exp(t0[δ(at+τ)+[1u(A0)]k(at+τ)AA0P(ˆa)i(ˆa,τ)dˆa]dτ)+t0[1u(A0)]k(at+τ)AA0P(ˆa)i(ˆa,τ)dˆa×exp(tτ[δ(at+θ)+[1u(A0)]k(at+θ)AA0P(ˆa)i(ˆa,θ)dˆa]dθ)dτ,at+A0,
    $
    (3.11)
    $ i(a,t)=aA0[1u(A0)]k(τ)AA0P(ˆa)i(ˆa,ta+τ)dˆa×exp(aτ[δ(θ)+[1u(A0)]k(θ)AA0P(ˆa)i(ˆa,ta+θ)]dθ)dτ,a<t+A0.
    $
    (3.12)

    When $ t > A $, we obtain

    $ i(a,t)=aA0[1u(A0)]k(τ)χ(ta+τ)×exp(aτ[δ(θ)+[1u(A0)]k(θ)χ(ta+θ)]dθ)dτ,a<t+A0,
    $
    (3.13)

    where $ \chi(t) = \int_{A_0}^A P(\hat{a}) i(\hat{a}, t)d\hat{a} $, when $ t < A $, the $ \chi(t) $ satisfy is

    $ χ(t)=[1u(A0)]A0P(ˆa)ˆaA0k(τ)χ(tˆa+τ)×exp(ˆaτ[δ(θ)+[1u(A0)]k(θ)χ(tˆa+θ)]dθ)dτdˆa,a<t+A0.
    $
    (3.14)

    For natural numbers $ n > 1 $, let $ \chi_n = \max \limits_{nA\leq t \leq (n+1)A}\chi(t), \; L_n = \max \{\chi_{n-1}, \chi_n \} $. According to the (3.14) when $ R_0 < 1 $, we get

    $ χ(t)[1u(A0)]A0P(ˆa)ˆaA0χ(tˆa+τ)exp(ˆaτδ(θ)dθ)dτdˆaR0maxtAτtχ(τ).
    $
    (3.15)

    So we obtain $ \chi(t) \leq R_0 \max \{ \chi_{n-1}, \; \chi_n \} $ when $ nA \leq t \leq (n+1)A $. Because of $ R_0 < 1 $, we also obtain $ \chi_n < L_n = \chi_{n-1} $, i.e. $ \chi_n < \chi_{n-1} $, $ \chi_n $ is monotonous and reduced and $ \chi_n < \chi_{n-1}R_0 $, from this delivery $ \lim\limits_{n\rightarrow +\infty} \chi_n = 0 $. Considering above conditions and (3.13) can also derive $ \lim\limits_{t\rightarrow +\infty} i(a, t) = 0 $. Finally, it is concluded from (3.13) that the disease-free equilibrium of the model (3.10) is stable $ R_0 < 1 $.

    When $ R_0 > 1 $, substituting $ i(a, t) = i(a) $ into the (3.10), the only endemic equilibrium of (3.10) is given by

    $ i(a)=[1u(A0)]aA0k(a)AA0P(ˆa)i(ˆa)dˆa×exp(aτδ(θ)+[1u(A0)]k(τ)AA0P(ˆa)i(ˆa)dˆadθ)dτ.
    $
    (3.16)

    When $ A_0\leq a < A $, the $ \forall\; i(a, t) $ satisfy $ i(a, 0) > 0 $, and $ \chi(t) > 0 $ can be derived from $ (3.11) $ and $ (3.14) $ when $ 0 \leq t\leq A $, and we also know that $ i(a, A) > 0\; (A_0 < a < A) $ by (3.13). Repeat this process then the $ \chi(t) > 0 $ is obtained when $ 0 \leq t\leq 3A $, let $ \chi^0 = \min\limits_{A \leq t\leq 2A} \chi(t) $, $ \chi^* = \max\limits_{A \leq t\leq 2A}\chi(t) $, the following is got as

    $ i(a,2A)[1u(A0)]aA0χ0k(τ)×exp(aτ(δ(θ)+[1u(A0)]χk(θ))dθ)dτ.
    $
    (3.17)

    Comparing the forms of $ (3.16) $ and $ (3.17) $, we can find a positive number $ 0 < \xi < 1 $ such that $ i(a, 2A) \geq \xi i(a) $, namely, the following formula holds for the solution $ i(a, t) $ of $ (2.4) $

    $ ξi(a)i(a,2A)1.
    $

    The Lemma 3.1 shows that the solutions $ i_{\xi}(a, t) $ and $ i_1(a, t) $ with initial values of $ \xi \cdot i(a, 0) $ and $ 1 $ respectively when $ t = 0 $, must have

    $ iξ(a,t)i(a,t+2A)i1(a,t).
    $

    Based on the fact that $ i(a) $ is the equilibrium of $ (3.10) $, then the $ \xi i(a) \leq i_{\xi}(a, t) $, i.e. $ i_{\xi}(a, t) $ is a monotone increasing function about $ t $. Since $ i_1(a, t) $ is a monotone subtraction function about $ t $, and the corresponding $ \chi_{\xi}(t) $ and $ \chi_1(t) $ are monotone increasing and monotone decreasing, respectively, and there are $ \lim\limits_ {t\rightarrow \infty} \chi_{\xi}(t) = \chi_{\xi}^0 \leq \lim\limits_ {t\rightarrow \infty} \chi_{1}(t) = \chi_{1}^0 $. From (3.14), the equation has only unique normal number solutions when $ R_0 > 1 $, i.e. $ \chi_{\xi}^0 = \chi_{1}^0 = \xi^{*} $, the $ \chi (t) $ corresponding to the $ i(a, t) $ also obtain $ \lim\limits_ {t\rightarrow \infty} \chi (t) = \xi^{*} $. Reuse (3.13) when $ t > A_0 $, can be obtained $ \lim\limits_ {t\rightarrow \infty} i(a, t) = i(a) $, i.e. the local disease equilibrium of (3.10) is globally attractive. The stability of the local disease equilibrium can be obtained by linearization. Therefore, the local disease equilibrium is globally asymptotically stable.

    Remark 3.3. 3.2 shows that the epidemic disease will die out if $ R_0 < 1 $, while the disease will be prevalent if $ R_0 > 1 $. This implies that $ R_0 $ is the threshold of model $(2.4)$.

    In section 3, we consider the effect of a age determined vaccine immunization of the system on threshold dynamics, which is one of the cases in which vaccines are added to all susceptible persons in the system. In this section, we focus on the optimal control of (4.1) on the basis of age-structured SIRS by implementing proportion of vaccination $ u(a, t) $ as control strategy at all ages of system, and vaccination rate $ u(a, t) $ satisfies $ 0 \leq u(a, t) \leq 1 $. We aim to minimize the infected population, while keeping the cost of applying such control strategy at the minimum level.

    Let $ ((a, t_0), x(a, t_0))\in [0, T)\times(\mathbb{H}\times\mathbb{H}\times\mathbb{H}) $, and consider the following control system over on $ (a, t)\in (0, A)\times[t_0, T] $:

    $ {S(a,t)t+S(a,t)a=λ(a)μ(a)S(a,t)β(a)S(a,t)I(a,t)+ρ(a)η(a)I(a,t)+γ(a)R(a,t)u(a,t)S(a,t),I(a,t)t+I(a,t)a=β(a)S(a,t)I(a,t)δ(a)I(a,t)),R(a,t)t+R(a,t)a=(1ρ(a))η(a)I(a,t)(μ(a)+γ(a))R(a,t)+u(a,t)S(a,t),S(a,t0)=St0(a),I(a,t0)=It0(a),R(a,t0)=Rt0(a),
    $
    (4.1)

    where $ S(a, t_0) = S_{t_0}(a), I(a, t_0) = I_{t_0}(a), R(a, t_0) = R_{t_0}(a) $ is varying initial time value and denote the initial state $ x(a, t_0) $ as $ x_{t_0}(a) $. Here the control $ \{u(\cdot, \cdot):(0, A)\times[t_0, T]\rightarrow \mathcal {U}\} $, and $ u(\cdot, \cdot) $ is measurable. We obtain the schematic diagram of model (4.1) with introducing vaccination control (see Figure 1).

    Figure 1.  Schematic diagram of the model (4.1).

    The object is to design the optimal controller $ u^*(a, t), \; (a, t)\in (0, A)\times[t_0, T] $ for the system (4.1) which minimizes the following performance index during the finite time interval $ [t_0, T] $ [27,28,29,30]. Our goal is to minimize the total number of the infected and susceptible individuals by using minimal control efforts. The cost function as follows

    $ J(t0,xt0(a),u(a,t))=Tt0A0(τ1I(a,t)+τ2u(a,t)+12τ3u2(a,t))dadt+A0h(I(a,T))da,
    $
    (4.2)

    where $ I(a, t): (a, t)\in [0, A]\times[t_0, T] $ and we denote $ x = (S, I, R), x_{t_0} \in (\mathbb{H}\times\mathbb{H}\times\mathbb{H}) $, the terminal value is $ V(x, T) = \int_0^Ah(I(a, T))da $. Let $ L(t, x, u): = \tau_1I(a, t)+\tau_2u(a, t)+\frac{1}{2}\tau_3u^2 (a, t) $, where $ \tau_1 $, $ \tau_2 $ and $ \tau_3 $ are the positive weighting factors, representing the cost per unit time of the components $ I(a, t) $, $ u(a, t) $ and $ u^2(a, t) $, respectively. In particular, $ \int_{t_0}^T\int_0^A\tau_1I(a, t)dadt $ is the cost that infected individual creates for the society due to standard medical care, not including the vaccination treatment $ u(a, t) $. $ \int_{t_0}^T \int_0^A(\tau_2u(a, t)+\frac{1}{2}\tau_3u^2 (a, t))dadt $ is the cost of treating infected individuals. $ h:\mathbb{H}\times\mathbb{H}\times\mathbb{H} \rightarrow \mathbb{H} $ are measurable and $ h(I(a, T)) $ denotes the total number disease in population depend on the age at the time $ T $. The value function as

    $ {V(t0,xt0(a))=infu()UJ(t0,xt0(a),u(a,t)),t0[0,T),V(T,xt0(a))=A0h(I(a,T))da.
    $
    (4.3)

    The function $ V(\cdot, \cdot) $ will play an important role in obtaining optimal control, thus, we would like to study $ V(\cdot, \cdot) $ in great detail. Let $ (x^*, u^*) $ is optimal pair, where $ x^* = (S^*, I^*, R^*) $. Noting that the initial time $ (t = 0) $ and the initial state $ (x(a, 0) = x_0) $ are fixed in the model [18]. The $ h(I(a, T)) $ satisfies

    $ A0h(I(a,T))h(˜I(a,T))daCI(a,T)˜I(a,T)C,
    $
    (4.4)

    where $ C $ is a positive constant, $ \|\cdot\| $ represents norm on space $ \mathbb H $ and $ I(a, T) $, $ \tilde{I}(a, T)\in \mathbb H $. The following hypothesis are put forward and need to be satisfied.

    D1 $ (\mathcal{U}, d) $ is a separable metric space and $ T > 0 $.

    D2 The control set $ \mathcal{U} $ is bounded convex

    D3 Different controls correspond to same terminal value.

    Then we study dynamic programming method, to give optimal strategy of model (4.1). The basic idea of this approach applied to optimal controls is to consider a family of optimal control problems with different initial times $ (t = t_0\geq 0) $ and initial states $ (x(a, t_0) = x_{t_0}(a)) $ [see [31,32,33]], to establish relationships among these problems through the HJB equation. Firstly, we present the Bellman's principle of optimality as follows.

    Theorem 4.1. Let (D1)-(D3) hold. Then for any $ (t_0, x_{t_0}(a))\in [0, T)\times \mathbb{H}\times\mathbb{H}\times\mathbb{H} $,

    $ V(t0,xt0(a))=infu()U[t0,T]{ˆt0t0A0L(t,x(t;t0,xt0(a),u(,)),u(a,t))dt+V(ˆt0,x(ˆt0;t0,xt0(a),u(,)))},0t0ˆt0<T.
    $
    (4.5)

    where $ L(t, x(t; t_0, x_{t_0}(a), u(\cdot, \cdot)), u(a, t)) = \tau_1 I_{t_0}(a)+\tau_2u(a, t)+\frac{1}{2}\tau_3u^2 (a, t) $.

    Proof. Let us denote the right-hand side of (4.5) by $ \overline{V}(t_0, x_{t_0}(a)) $. By (4.3), we have

    $ V(t0,xt0(a))J(t0,xt0(a),u(a,t))=ˆt0t0A0(τ1I(a,t)+τ2u(a,t)+12τ3u2(a,t))dadt+J(ˆt0,x(a,ˆt0),u(,)),u(,)U.
    $

    Thus, taking the infimum over $ u(\cdot, \cdot) \in \mathcal {U} $ we get

    $ V(t0,xt0(a))¯V(t0,xt0(a)).
    $
    (4.6)

    Conversely, for any $ \varepsilon > 0 $, there exists a $ u_{\varepsilon}(\cdot, \cdot) \in \mathcal {U} $ such that

    $ V(t0,xt0(a))+εJ(t0,xt0(a),uε(,))ˆt0t0A0(τ1Iε(a,t)+τ2uε(a,t)+12τ3u2ε(a,t))dadt+V(ˆt0,xε(a,ˆt0))¯V(t0,xt0(a)).
    $
    (4.7)

    Combing (4.6) and (4.7), we obtain (4.5).

    The equation (4.5) is dynamic programming equation, which gives a relationship among globally and locally optimal via value function.

    We would like to further study the (4.5), trying to obtain an equation for $ V(t_0, x_{t_0}(a)) $ simpler form. The following results give a partial differential equation that a continuously differentiable value function ought to satisfy. We know the $ V(t_0, x_{t_0}(a)) $ is a continuously differentiable value function via 4.1 and basic theorem of calculus.

    Define the Lyapunov equation (LE)

    $ \langle V_x, (f(a, t, x)+g(a, t, x)u(a, t))\rangle+\int_{0}^{A}(\tau_1I(a, t)+\tau_2u(a, t)+\frac{1}{2}\tau_3u^2 (a, t))da = 0. $

    That is

    $ 0=VS,(Sa+λ(a)μ(a)Sβ(a)SI+ρ(a)η(a)I+γ(a)Ru(a,t)S)+VR,(Ra+(1ρ(a))η(a)I(μ(a)+γ(a))R+u(a,t)S)+VI,(Ia+β(a)SIδ(a)I)+A0(τ1I(a,t)+τ2u(a,t)+12τ3u2(a,t))da=A0VS(Sa+λ(a)μ(a)Sβ(a)SI+ρ(a)η(a)I+γ(a)Ru(a,t)S)da+A0VR(Ra+(1ρ(a))η(a)I(μ(a)+γ(a))R+u(a,t)S)da+A0VI(Ia+β(a)SIδ(a)I)da+A0(τ1I(a,t)+τ2u(a,t)+12τ3u2(a,t))da,
    $
    (4.8)

    where $ V_{x} = (\frac{\partial V}{\partial S}, \; \frac{\partial V}{\partial I}, \; \frac{\partial V}{\partial R})^{\top} $, $ V_{t} = \frac{\partial V}{\partial t} $. The equation LE is the HJB equation when $ u(a, t) $ is optimal control of (4.1).

    $ {0=A0VS(Sa+λ(a)μ(a)Sβ(a)SI+ρ(a)η(a)I+γ(a)Ru(a,t)S)da+A0VR(Ra+(1ρ(a))η(a)I(μ(a)+γ(a))R+u(a,t)S)da+A0VI(Ia+β(a)SIδ(a)I)da+A0(τ1I(a,t)+τ2u(a,t)+12τ3u2(a,t))da,Vt=T=h(x),xH×H×H.
    $
    (4.9)

    In this subpart, we write the HJB equation of model (4.1) as well as its viscosity solution is discussed as following.

    Theorem 4.2. Let (D1)-(D3) and $ V(t, x)\in C^{1}([0, T]\times \mathbb{H}\times\mathbb{H}\times\mathbb{H}) $. Then $ V(t, x) $ is a solution of the following terminal value problem of HJB equation:

    $ {Vt+infuUH(t,x,u,Vx)=0,t[0,T),V|t=T=h(x),(t,x,u)[0,T]×H×H×H×U.
    $
    (4.10)

    which can be written as $(4.9)$.

    Proof. Fix $ (t_0, x_{t_0}(a))\in [0, T)\times \mathbb{H}\times\mathbb{H}\times\mathbb{H} $ and $ u\in \mathcal{U} $. Let $ x(\cdot, \cdot) $ be the state trajectory corresponding to the control $ u(\cdot, \cdot)\in \mathcal{U}^{\omega}[s, T] $ with $ u(a, t)\equiv u $. On the one hand, we can write according to (4.5)

    $ 0{V(ˆt0,x(ˆt0,a))V(t0,xt0(a))}ˆt0t0A0(τ1I(a,t)+τ2u(a,t)+12τ3u2(a,t))dadt.
    $
    (4.11)

    Rearranging the equation (4.11) and dividing the both side of the equation by $ \hat{t}_0-t_0 $ yield

    $ 0{V(ˆt0,x(a,ˆt0))V(t0,xt0(a))}ˆt0t01ˆt0t0ˆt0t0A0(τ1I(a,t)+τ2u(a,t)+12τ3u2(a,t))dadt={V(ˆt0,x(a,ˆt0))V(ˆt0,xt0(a))+V(ˆt0,x(a,ˆt0))V(t0,x(a,ˆt0))}ˆt0t01ˆt0t0ˆt0t0A0(τ1I(a,t)+τ2u(a,t)+12τ3u2(a,t))dadt.
    $
    (4.12)

    By (4.5) with $ \hat{t}_0\downarrow t_0 $, we obtain

    $ 0Vt(t0,xt0(a))Vx(t0,xt0(a)),dxdtA0(τ1I(a,t)+τ2u(a,t)+12τ3u2(a,t))da=A0{VS(t0,xt0(a))(S(a,t)a+λ(a)μ(a)S(a,t)β(a)S(a,t)I(a,t)+ρ(a)η(a)I(a,t)+γ(a)R(a,t)u(a,t)S(a,t))VI(t0,xt0(a))(I(a,t)a+β(a)S(a,t)I(a,t)δ(a)I(a,t))VR(t0,xt0(a))(R(a,t)a+(1ρ(a))η(a)I(a,t)(μ(a)+γ(a))R(a,t)+u(a,t)S(a,t))}daA0(τ1I(a,t)+τ2u(a,t)+12τ3u2(a,t))da.
    $
    (4.13)

    This results in

    $ 0Vt(t,x(a,t))+infuUA0{VS(t,x(a,t))(S(a,t)aμ(a)S(a,t)β(a)S(a,t)I(a,t)+ρ(a)η(a)I(a,t)+λ(a)+γ(a)R(a,t))+VI(t,x(a,t))(I(a,t)a+β(a)S(a,t)I(a,t)δI(a,t))+VR(t,x(a,t))(R(a,t)a+(1ρ(a))η(a)I(a,t)(μ(a)+γ(a))R(a,t))}da+A0(τ1I(a,t)τS(VS(t,x(a,t))VR(t,x(a,t)))+12τ3(S(VS(t,x(a,t))VR(t,x(a,t))))2)da.
    $
    (4.14)

    On the other hand, for any $ \varepsilon > 0 $, $ \forall0\leq t_0\leq \hat{t_0} < T $ with $ \hat{t}_0-t_0 > 0 $ small enough, there exists a $ u(\cdot, \cdot)\equiv u_{\varepsilon, \hat{t}_0}(\cdot, \cdot)\in \mathcal{U} $ such that

    $ V(t0,xt0(a))+ε(ˆt0t0)V(ˆt0,x(ˆt0;t0,xt0(a),u(a,t)))+ˆt0t0A0(τ1I(a,t)+τ2u(a,t)+12τ3u2(a,t))dadt.
    $
    (4.15)

    Thus, it follows that as (noting $ V\in C^1([0, T]\times \mathbb{H}\times\mathbb{H}\times\mathbb{H}) $)

    $ ε{V(ˆt0,x(ˆt0))V(t0,x(t0))}ˆt0t01ˆt0t0ˆt0t0A0(τ1I(a,t)+τ2u(a,t)+12τ3u2(a,t))dadt1ˆt0t0ˆt0t0[Vt(t0,xt0(a))Vx(t0,xt0(a)),dxdtA0(τ1I(a,t)+τ2u(a,t)+12τ3u2(a,t))da]dt1ˆt0t0ˆt0t0[Vt(t0,xt0(a))Vx(t0,xt0(a)),dxdtinfuUA0(τ1I(a,t)+τ2u(a,t)+12τ3u2(a,t))da]dt1ˆt0t0ˆt0t0Vt(t0,xt0(a))+infuUH(t,x(a,t),u(a,t),Vx(t,x(a,t)))dt.
    $
    (4.16)

    Taking limit on (4.16) with respect to $ \hat{t}_0\downarrow t_0 $, we have

    $ 0Vt(t,x(a,t))+infuUA0{VS(t,x(a,t))(S(a,t)aμ(a)S(a,t)β(a)S(a,t)I(a,t)+ρ(a)η(a)I(a,t)+λ(a)+γ(a)R(a,t))+VI(t,x(a,t))(I(a,t)a+β(a)S(a,t)I(a,t)δI(a,t))+VR(t,x(a,t))(R(a,t)a+(1ρ(a))η(a)I(a,t)(μ(a)+γ(a))R(a,t))}da+A0(τ1I(a,t)τS(VS(t,x(a,t))VR(t,x(a,t)))+12τ3(S(VS(t,x(a,t))VR(t,x(a,t))))2)da.
    $
    (4.17)

    Combining (4.14) and (4.17), we obtain our results.

    Definition 4.3. [34] A function $ v \in C([0, T]\times \mathbb{H}\times\mathbb{H}\times\mathbb{H}) $ is called a $ viscosity \; solution $ of $(4.9)$ if

    $ v(T,x(a,T))h(x(a,T)),x(a,T)H×H×H,
    $
    (4.18)

    and for any $ \psi \in C^1([0, T]\times \mathbb{R}) $, whenever $ v-\psi $ attains a local maximum at $ (t, x)\in [0, T)\times \mathbb{H}\times\mathbb{H}\times\mathbb{H} $, we have

    $ ψt(t,x)+supuUH(t,x,u,ψx(t,x))0.
    $
    (4.19)

    The function $ v \in C([0, T]\times \mathbb{H}\times\mathbb{H}\times\mathbb{H}) $ is called a $ viscosity\; solution $ of $(4.9)$ if in $(4.18)-(4.19)$ the inequalities $ \leq $ are changed to $ \geq $ and $ local\; maximum $ is changed to $ local\; minimum $. In the case that $ v $ is both a viscosity subsolution and supersolution of $(4.9)$, it is called a viscosity solution of $(4.9)$.

    Theorem 4.4. Let (D1)-(D3) hold. Then the value function of $ V(t, x) $ satisfies

    $ |V(t0,xt0(a))V(ˆt0,xˆt0(a))|K{|t0ˆt0|},(t0,xt0(a)),(ˆt0,xˆt0(a))[0,T]×H×H×H,
    $
    (4.20)

    for some $ K > 0 $. Moreover, $ V(t, x(a, t)) $ is the only solution of $(4.9)$ in the class $ C([0, T]\times\mathbb{H}\times\mathbb{H}\times\mathbb{H}) $.

    Proof. Through 4.2 and $ t_0\leq \hat{t}_0 $ we obtain

    $ |V(t0,xt0(a))V(ˆt0,xˆt0(a))|infuU{ˆt0t0A0(τ1I(a,t)+τ2u(a,t)+12τ3u2(a,t))dadt}ˆt0t0A0(τ1I(a,t)+τ2u(a,t)+12τ3u2(a,t))dadt|t0ˆt0|maxt0tˆt0A0(τ1I(a,t)+τ2u(a,t)+12τ3u2(a,t))daK|t0ˆt0|.
    $
    (4.21)

    Thus, $ V(t, x(a, t)) $ satisfies (4.21). We can know that $ V(t, x(a, t)) $ is unique viscosity of the HJB equation via the same method as [[34], Theorem 2.5].

    In this subsection, we study the existence of the optimal control pair in finite time for the system (4.1) and construct the Hamiltonian of the optimal control problem.

    Theorem 4.5. There exists an optimal control $ u^* \in \mathcal{U} $ and a corresponding optimal state $ S^*, \; I^*, \; R^* $ such that

    $ V(t0,xt0(a))=infu()UJ(t0,xt0(a),u(a,t)),(t0,xt0(a))[0,T)×H×H×H,
    $

    subject to the control system (4.1).

    Proof. To show the existence of the optimal control for the problem under consideration, we use the result in [35,36]. We notice that the state and control variables are non-negative, and the control set $ \mathcal{U} $, by definition, is closed and bounded. The optimal system is bounded, which ensures the compactness needed for the existence of an optimal control. Further, the integrand $ \int_{t_0}^T \int_0^A(\tau_1I(a, t)+\tau_2u(a, t)+\frac{1}{2}\tau_3u^2(a, t))dadt $ is convex on the control set $ \mathcal{U} $ due to the biquadratic and quadratic nature of control variable $ u(a, t) $, which represents vaccination proportion. In addition, there exists a constant $ \nu > 1 $ and positive numbers $ \kappa_1 $, $ \kappa_2 $ such that

    $ τ1I(a,t)+τ2u(a,t)+12τ3u2(a,t)κ1|u(a,t)|νκ2.
    $

    We complete the existence of the optimal control of state variables.

    Theorem 4.6. Let $ u^*(a, t) $ be optimal control variable, $ S^*(a, t) $, $ I^*(a, t) $ and $ R^*(a, t) $ be corresponding optimal state variable of model $(4.1)$. The corresponding optimal control is given as follows:

    $ u^*(a, t) = \min\{\max[0, -\frac{1}{\tau_3}S(a, t)^*(V_R(x, t)-V_S(x, t))+\tau], 1\} $

    where $ \frac{\tau_2}{\tau_3} = \tau $.

    Proof. We define the Hamiltonian function $ H(t, x, u(a, t), V_x), \; t\in[0, T], \; u(a, t)\in \mathcal{U}_{ad}, \; x, \; V_x(x, t) \in \mathbb{H}\times\mathbb{H}\times\mathbb{H} $ and by constructing the Hamiltonian function and HJB equation to characterize this optimal control $ u(a, t) $ as follows:

    $ H=(Sa+λ(a)μ(a)Sβ(a)SI+ρ(a)η(a)I+γ(a)Ru(a,t)S)VS(x,t)+(Ia+β(a)SIδ(a)I)VI(x,t)τ1Iτ2u(a,t)12τ3u2(a,t)+(Ra+(1ρ(a))η(a)I(μ(a)+γ(a))R+u(a,t)S)VR(x,t).
    $
    (4.22)

    Let $ u^*(a, t) $ be given optimal control and $ S^*(a, t) $, $ I^*(a, t) $ and $ R^*(a, t) $ be corresponding optimal state variable of model (4.1). By the Hamiltonian function (4.22), optimal control $ u(a, t) = u^*(a, t) $ is obtained

    $ u(a,t)=1τ3S(a,t)(VR(x,t)VS(x,t))+τ.
    $
    (4.23)

    From the properties of the control set with the findings, then there is exists optimal control

    $ u(a,t)={0,1τ3S(VRVS)+τ<0,1τ3S(VR(x,t)VS(x,t))+τ,01τ3S(VRVS)+τ<1,1,11τ3S(VRVS)+τ.
    $
    (4.24)

    Remark 4.7. If we could obtain the value function $ V(t, x(a, t)) $ by solving the HJB equation, then we could, at least formally, construct an optimal pair for each of optimal control problem for different initial values. The principle involves the following steps to solve optimal control problem

    $ Step.1. $ Solve the HJB equation $(4.10)$ to find the $ V(T, x(a, t)) $;

    $ Step.2. $ Find $ u^*(a, t) $ through Hamiltonian function $(4.22)$;

    $ Step.3. $ Combine the $ u^*(a, t) $ to solve model $(4.1)$ to get the optimal pair $ (x^*(a, t), u^*(a, t)) $.

    This section aims to illustrate the effectiveness of our theoretical results obtained in previous sections.

    In the numerical simulation, the parameters are given in Table 2. We assume that $ (a, t) \in [0, 80]\times [0,500], \; \Delta t = 0.1, \; \Delta a = 1 $, take $ p_{\infty} = 1.0, \; \varrho = 0.2, \; \delta = 0.1827, \; k = 0.2 $, then $ R_0\approx 2.69 > 1 $. The parameters that we partially need to assume are reasonable according to the study of Yang et al. [14] has shown that the range of the basic reproduction number of the pandemic influenza in $ 1.0-4.0 $. We see from 3.2 the $ E^* $ is globally asymptotically stable. Actually, as showing in the following Figure 2 (a), the density of the infected individual $ I(a, t) $ tends to be a positive constant over time.

    Table 2.  Parameter values used in numerical simulations.
    Parameter Value Source of data
    $ \lambda $ 0.20548 [16], Lan et al.
    $ \beta $ $ 1.6805\times 10^{-4} $ [16], Lan et al.
    $ \mu $ $ 3.4246\times 10^{-5} $ [18], Mu $ \& $ Zhang
    $ \eta $ 0.02 [18], Mu $ \& $ Zhang
    $ \rho $ 0.05 [18], Mu $ \& $ Zhang
    $ \gamma $ 0.027 [16], Lan et al.
    $ \delta $ 0.2227 Assumed
    $ \varrho $ 0.2 Assumed
    $ u $ 0.35 Assumed
    $ A $ 80 years [16], Lan et al.
    $ T $ 500 days Assumed

     | Show Table
    DownLoad: CSV
    Figure 2.  The evolution of $ I(a, t) $ of (2.4) for $ R_{0}\approx 2.69 > 1 $ (a) and $ R_0\approx 0.78 < 1 $ (b).

    Take $ \varrho = 0.1, \; \delta = 0.1827, \; k = 0.1 $, then $ R_0\approx 0.78 < 1 $, thus we can know the $ E^0 $ is globally asymptotically stable, as showing in the following Figure 2 (b), the density of the infected individual $ I(a, t) $ tends to zero over time. These are the same conclusions as 3.2.

    We choose $ \delta = 0.1827 $, $ 0.2027 $ and $ 0.2227 $ to study the effect on the infected population and all the other parameters are fixed as in Table 2. We calculate the corresponding basic reproduction number $ R_0 \approx 0.9427 $, $ 0.8979 $ and $ 0.7802 $ when $ R_0 < 1 $, respectively. In Figure 3 (a), we can see that the extinction time of decreases with the increase of infected removal rate $ \delta $. In order to simulate the cases of $ R_0 > 1 $, we calculate the corresponding basic reproduction number $ R_0 \approx 1.3468 $, $ 2.2441 $ and $ 2.6930 $, respectively. The simulation result is presented in Figure 3 (b). Synthetically, it is obvious to see from Figure 3 that the peak of $ I(a, t) $ decreases significantly as infected removal rate $ \delta $ of age a goes up.

    Figure 3.  (a): the path of $ I(a, t) $ under different $ \delta $ when $ R_0 < 1 $ at age $ a = 30 $; (b): the path of $ I(a, t) $ under different $ \delta $ when $ R_0 > 1 $ at age $ a = 30 $.

    In this section, we show the result of optimal control using a numerical example. The parameters are given in Table 2. $ (a, t) \in [0, 80]\times [0,500], \; \Delta t = 0.1, \; \Delta a = 1 $ by performing some numerical simulations. We take $ \tau_1 = 11.7 $, $ \tau_2 = 3.4 $ and $ \tau_3 = 12 $. The corresponding paths of control and infective populations $ I(a, t) $ are plotted in Figure 4, Figure 5 (a), Figure 6 and Figure 7 (a) show the section view at age $ a = 20 $ and $ a = 30 $ of the image variation tendency of $ I(a, t) $ with and without control and the tendency of corresponding optimal control $ u(a, t) $. We observe that the comprehensive use of control $ u(a, t) $ works better than no control applied during the course of disease. The effect of applying control reduces the number of infective populations $ I(a, t) $ dramatically. In short, control variable $ u(a, t) $ play an important role in the control of the disease. At the same time, we can also observe a reduced epidemic time of population infection.

    Figure 4.  When $ R_0>1 $, (a): the paths of $ I(a, t) $ with and without control $ u(a, t) $ at age $ a = 20 $; (b): The paths of $ I(a, t) $ with and without control $ u(a, t) $ at age $ a = 30 $.
    Figure 5.  (a): when $ R_0>1 $, the paths of control at age $ a = 20 $ and $ a = 30 $; (b): the path of control at $ t = 500 $.
    Figure 6.  When $ R_0<1 $, (a): the paths of $ I(a, t) $ with and without control $ u(a, t) $ at age $ a = 20 $; (b): The paths of $ I(a, t) $ with and without control $ u(a, t) $ at age $ a = 30 $.
    Figure 7.  (a): when $ R_0 < 1 $, the paths of control at age $ a = 20 $ and $ a = 30 $; (b): the paths of control at $ t = 500 $.

    We note that a significant decline in the number of infected persons $ I(a, t) $ during vaccine control of susceptible at age $ a = 20 $ and $ a = 30 $ from these following figures.

    When $ R_0 > 1 $, $ I(a, t) $ trends is regard to the optimal controls, where the upper-level image is the evolution of $ I(a, t) $ without control and the lower-level image is the evolution of $ I(a, t) $ with control on in Figure 4. In Figure 5 (a) shows the optimal control pathes at ages $ a = 20 $ and $ a = 30 $, repectively. Eventually the disease tends to extinction with control. Compared with the path of non-vaccinated $ I(a, t) $, the epidemic time of $ I(a, t) $ with vaccination is significantly shortened, as well as the density of infected population verge to zero eventually.

    When $ R_0 < 1 $, $ I(a, t) $ trends is regard to the optimal controls, where the upper-level image is the evolution of $ I(a, t) $ without control and the lower-level image is the evolution of $ I(a, t) $ with control in Figure 6. In Figure 7 (a) shows the optimal control pathes at ages $ a = 20 $ and $ a = 30 $, repectively. Eventually the disease tends to extinction with control. Compared with Compared with the path of non-vaccinated $ I(a, t) $, the epidemic time of $ I(a, t) $ with vaccination is significantly shortened. Combined with Figure 4 and the corresponding conclusions, it is clear that vaccination have a certain degree of hindrance to the transmission of epidemics. We also observe the Figure 5 (b) and Figure 7 (b) that vaccine control varies for different ages, mainly adolescents and middle age, and this control strategy is consistent with the actual control of many epidemics such as pneumonia, influenza and so on. The pneumococcal vaccine, COVID-19 vaccine and influenza vaccine are not suitable for the elderly. Overall, population age has a significant effect on the implementation of vaccine control strategies for many common diseases.

    In this paper, we recurred an age-structured SIRS epidemic model (2.1) with vaccination control, and obtained the condition for disease extinction and persistence. The research results showed that when $ R_0 < 0 $, the disease extincted; when $ R_0 > 0 $, the disease persisted. The conditions of disease extinction and permanence were given in 3.2. And we verified the resluts by numerical simulation. However, since the bifurcation phenomenon will occur when $ R_0 = 0 $, this part will also be an important point for our further study of the age-structured SIRS epidemic system dynamics. Besides, we also studied the control problem of SIRS epidemic model with age structure. By proving the existence of viscosity solution, we obtain the existence of optimal control. Then, we obtained the implicit expression for optimal control and HJB equation. Finally, by using Milstein method, the optimal proportion of vaccination is obtained. In addition, we plan that in the next step, traveling wave solutions of an age-structured SIRS epidemic model will become one of our main research contents. Wu et al. [37] studied the existence and non-existence of traveling wave solutions for a diffusive age-structured SIR epidemic model. Their work provides some insights on how to deal with the high dimensional age-structured epidemic models.

    The authors thank the editor and referees for their careful reading and valuable comments. The research was supported in part by the Ningxia Natural Science Foundation (No. 2020AAC03067).

    The authors have no conflict of interest.

    [1] Fox MA (1999) Fundamentals in the Design of Molecular Electronic Devices: Long- Range Charge Carrier Transport and Electronic Coupling. Acc Chem Res 32: 201–207. doi: 10.1021/ar9600953
    [2] Liu C-Y, Pan H-L, Fox MA, et al. (1993) High-Density Nanosecond Charge Trapping in Thin-Films of the Photoconductor ZnODEP. Science 261: 897–899. doi: 10.1126/science.261.5123.897
    [3] Adams DM, Kerimo J, Liu C-Y, et al. (2000) Electric field modulated near-field photo-luminescence of organic thin films. J Phys Chem B 104: 6728–6736. doi: 10.1021/jp994457a
    [4] Kimura M, Saito Y, Ohta K, et al. (2002) Self-Organization of Supramolecular Complex Composed of Rigid Dendritic Porphyrin and Fullerene. J Am Chem Soc 124: 5274–5275. doi: 10.1021/ja012614p
    [5] Burrows HD, Gonsalves AMR, Leitao MLP, et al. (1997) Phase transitions and self-assembly in meso-tetrakis(undecyl)porphyrin. Supramolec Sci 4: 241–246. doi: 10.1016/S0968-5677(97)00010-2
    [6] Tsuda A, Osuka A (2001) Fully Conjugated Porphyrin Tapes with Electronic Absorption Bands That Reach into Infrared. Science 293: 79–82. doi: 10.1126/science.1059552
    [7] Reimers JR, Hall LE, Crossley MJ, et al. (1999) Rigid fused Oligoporphyrins as Potential Versatile Molecular Wires. 2. B3LYP and SCF Calculated Geometric and Electronic Properties of 98 Oligoporphyrin and Related Molecules. J Phys Chem A 103: 4385–4397.
    [8] Jiao J, Anariba F, Tiznado H, et al. (2006) Stepwise Formation and Characterization of Covalently Linked Multiporphyrin-Imid Architectures on Si(100). J Am Chem Soc 128: 6965–6974. doi: 10.1021/ja060906q
    [9] Roth KM, Liu Z, Gryko DT, et al. (2003) Charge-Retention Characteristics of Self-Assembled Monolayers of Molecular-Wire-Linked Porphyrins on Gold (Chapter 5). In: Lieberman M, editor. Molecules as Components of Electronic Devices. Washington DC: Oxford University Press.
    [10] Liu C-Y, Pan HL, Fox MA, et al. (1997) Reversible charge trapping/detrapping in a photoconductive insulator of liquid crystal zinc porphyrin. Chem Mater 9: 1422–1429. doi: 10.1021/cm970039b
    [11] Roth KM, Dontha N, Dabke RB, et al. (2000) Molecular approach toward information storage based on the redox properties of porphyrins in self-assembled monolayers. J Vac Sci Technol 18: 2359–2364.
    [12] Malinski T, Taha Z (1992) Nitric-Oxide Release from a Single Cell Measured In Situ by a Porphyrinic-Based Microsensor. Nature 358: 676–678. doi: 10.1038/358676a0
    [13] Filippini D, Alimelli A, Natale CD, et al. (1999) Chemical Sensing with Familiar Devices. Angew Chem Int Ed 45: 3800–3803.
    [14] Maree CHM, Roosendaal SJ, Savenije TJ, et al. (1996) Photovoltaic effects in porphyrin polymer films and heterojunctions. J Appl Phys 80: 3381–3389. doi: 10.1063/1.363203
    [15] Murata K, Ito S, Takahashi K, et al. (1997) Photocurrent from photocorrosion of aluminum electrode in porphyrin/Al Schottky-barrier cells. Appl Phys Lett 71: 674–676. doi: 10.1063/1.119826
    [16] Harima Y, Okazaki H, Kunugi Y, et al. (1996) Formation of Schottky barriers at interfaces between metals and molecular semiconductors of p- and n-type conductances. Appl Phys Lett 69: 1059–1061. doi: 10.1063/1.116930
    [17] Chowdhury A, Chowdhury J, Pal P, et al. (1998) Light-emitting diodes from molecularly thin porphyrin derivative: Effect of molecular packing. Solid State Commun 107: 725–729. doi: 10.1016/S0038-1098(98)00289-0
    [18] Baldo MA, O'Brien DF, You Y, et al. (1998) Highly efficient phosphorescent emission from organic electroluminescent devices. Nature 395: 151–154. doi: 10.1038/25954
    [19] Kwong RC, Sibley S, Dubovoy T, et al. (1999) Efficient, saturated red organic light emitting devices based on phosphorescent platinum(II) porphyrins. Chem Mater 11: 3709–3713. doi: 10.1021/cm9906248
    [20] Sendt K, Johnston LA, Hough WA, et al. (2002) Switchable Electronic Coupling in Model Oligoporphyrin Molecular Wires Examined through the Measurement and Assignment of Electronic Absorption Spectra. J Am Chem Soc 124: 9299–9309. doi: 10.1021/ja020081u
    [21] Reimers JR, Lu TX, Crossley MJ, et al. (1996) Molecular electronic properties of fused rigid porphyrin-oligomer molecular wires. Chem Phys Lett 256: 353–359. doi: 10.1016/0009-2614(96)00435-6
    [22] Robertson N, McGowan CA (2003) A comparison of potential molecular wires as components for molecular electronics. Chem Soc Rev 32: 96–103. doi: 10.1039/b206919a
    [23] 
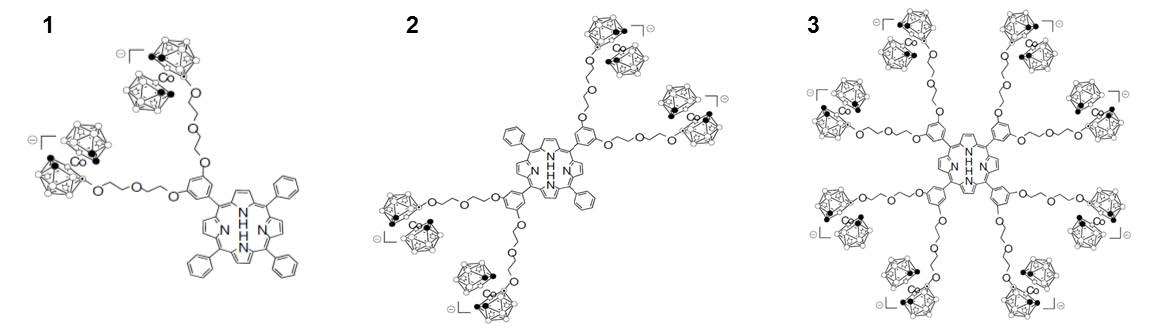
Hao E, Jensen TJ, Courtney BH, et al. (2005) Synthesis and cellular studies of porphyrin−cobaltacarborane conjugates. Bioconjugate Chem 16: 1495–1502. doi: 10.1021/bc0502098
    [24] Hao E, Sibrian-Vazquez M, Serem W, et al. (2007) Synthesis, aggregation and cellular investigations of porphyrin–cobaltacarborane conjugates. Chem A Eur J 13: 9035–9042.
    [25] Hao E, Zhang M, E W, et al. (2008) Synthesis and spectroelectrochemistry of N-cobaltacarborane porphyrin conjugates. Bioconjugate Chem 19: 2171–2181. doi: 10.1021/bc800265w
    [26] Hao E, Vicente MGH (2005) Expeditious synthesis of porphyrin-cobaltacarborane conjugates. Chem Commun 1306–1308.
    [27] Sibrian-Vazquez M, Hao E, Jensen TJ, et al. (2006) Enhanced cellular uptake with a cobaltacarborane−porphyrin−HIV-1 Tat 48−60 conjugate. Bioconjugate Chemistry 17: 928–934. doi: 10.1021/bc060047v
    [28] Friedbacher G, Fuchs H (1999) Classification of scanning probe microscopies - (Technical report). Pure Appl Chem 71: 1337–1357. doi: 10.1351/pac199971071337
    [29] Ogunrinde A, Hipps KW, Scudiero L (2006) A scanning tunneling microscopy study of self-assembled nickel(II) octaethylporphyrin deposited from solutions on HOPG. Langmuir 22: 5697–5701. doi: 10.1021/la060233p
    [30] Palermo V, Palma M, Samori P (2006) Electronic characterization of organic thin films by Kelvin probe force microscopy. Adv Mater 18: 145–164. doi: 10.1002/adma.200501394
    [31] Kronik L, Shapira Y (1999) Surface photovoltage phenomena: theory, experiment, and applications. Surf Sci Rep 37: 1–206. doi: 10.1016/S0167-5729(99)00002-3
    [32] Matey JR, Blanc J (1985) Scanning capacitance microscopy. J Appl Phys 57: 1437–1444. doi: 10.1063/1.334506
    [33] Xu S, Arnsdorf MF (1995) Electrostatic force microscope for probing surface charges in aqueous solutions. Proc Natl Acad Sci 92: 10384–10388.
    [34] Afsharimani N, Nysten B (2013) Scanning probe microscopy study of electronic properties in alkyl-substituted oligothiophene-based field-effect transitors. Vacuum 90: 17–24. doi: 10.1016/j.vacuum.2012.09.014
    [35] Jean MS, Hudlet S, Guthmann C, et al. (1999) Van der Waals and capacitive forces in atomic force microscopies. J Appl Phys 86: 5245–5248. doi: 10.1063/1.371506
    [36] Kodera M, Yoshimizu Y, Uchida K (2012) Potential Characterization of Interconnect Corrosion by Kelvin Probe and Electrostatic Force Microscopies. Japan J Appl Phys 51.
    [37] Necas D, Klapetek P (2012) Gwyddion: an open-source software for SPM data analysis. Cent Eur J Phys 10: 181–188.
    [38] Hao E (2007) Syntheseses and evaluation of porphyrin derivatives for applications in medicine and in material science. Baton Rouge, LA: Dissertation, Louisiana State University.
    [39] Matsumoto K, Ishii M, Segawa K, et al. (1996) Room temperature operation of a single electron transistor made by the scanning tunneling microscope nanooxidation process for the TiOx/Ti system. Appl Phys Lett 68: 34–36. doi: 10.1063/1.116747
    [40] Kim TW, Choo DC, Shim JH, et al. (2001) Nanocrystals acting as Coulomb islands operating at room temperature created using a focused ion-beam process. Appl Phys Lett 79: 120–122. doi: 10.1063/1.1378052
    [41] Wakayama Y, Kubota T, Suzuki H, et al. (2003) Molecular Coulomb islands for single-electron tunneling in SiO2/molecular layer/SiO2 multilayers on Si(100). J Appl Phys 94: 4711–4713. doi: 10.1063/1.1605249
  • Reader Comments
  • © 2016 the Author(s), licensee AIMS Press. This is an open access article distributed under the terms of the Creative Commons Attribution License (http://creativecommons.org/licenses/by/4.0)
通讯作者: 陈斌, bchen63@163.com
  • 1. 

    沈阳化工大学材料科学与工程学院 沈阳 110142

  1. 本站搜索
  2. 百度学术搜索
  3. 万方数据库搜索
  4. CNKI搜索

Metrics

Article views(7024) PDF downloads(1103) Cited by(1)

Figures and Tables

Figures(5)

/

DownLoad:  Full-Size Img  PowerPoint
Return
Return

Catalog