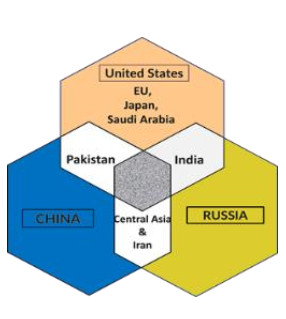
Asia, where future world economic development is predicted and most of the energy resources are buried, has not been able to utilize its energy resources efficiently and remained at the core of political tensions, conflicts, terrorism and wars for decades. Major producers and consumers of fossil energy are located in this continent, and the potential of a vast energy market is inevitable. There are several challenges and opportunities associated with the energy trade in the region. On the one hand, the rivalries and competition over energy resources and territorial ownership and control between the USA, China and Russia have been the sources of most political and security issues in the region. However, on the other hand, the fast economic growth and availability of energy resources open up numerous trade and connectivity opportunities for the region. Afghanistan is a strategic state that serves as a geographic land-based hub for South Asia, Central Asia, China and the Middle East. It is no longer considered a land-locked country, but a strategic and key land link for the whole region. Afghanistan is the most economical and inimitable terrestrial corridor for the regional energy trade and transit upon which all stakeholders agree. Stability in Afghanistan will significantly change the importance of this region and open up doors for the realization of various mega projects, businesses and cultural exchange opportunities. Energy, as a strategic commodity for all of the regional countries, especially India and China as major consumers at present and in the future, will be a mega trade and connectivity opportunity.
Citation: Sabory Najib Rahman, Danish Mir Sayed Shah, Senjyu Tomonobo, Ahmadzai Mirwais. Afghanistan factor in regional energy security and trade: Existing and projected challenges and opportunities[J]. AIMS Energy, 2023, 11(2): 213-238. doi: 10.3934/energy.2023012
Asia, where future world economic development is predicted and most of the energy resources are buried, has not been able to utilize its energy resources efficiently and remained at the core of political tensions, conflicts, terrorism and wars for decades. Major producers and consumers of fossil energy are located in this continent, and the potential of a vast energy market is inevitable. There are several challenges and opportunities associated with the energy trade in the region. On the one hand, the rivalries and competition over energy resources and territorial ownership and control between the USA, China and Russia have been the sources of most political and security issues in the region. However, on the other hand, the fast economic growth and availability of energy resources open up numerous trade and connectivity opportunities for the region. Afghanistan is a strategic state that serves as a geographic land-based hub for South Asia, Central Asia, China and the Middle East. It is no longer considered a land-locked country, but a strategic and key land link for the whole region. Afghanistan is the most economical and inimitable terrestrial corridor for the regional energy trade and transit upon which all stakeholders agree. Stability in Afghanistan will significantly change the importance of this region and open up doors for the realization of various mega projects, businesses and cultural exchange opportunities. Energy, as a strategic commodity for all of the regional countries, especially India and China as major consumers at present and in the future, will be a mega trade and connectivity opportunity.

| [1] | Shaffer B (2010) Energy politics. University of Pennsylvania Press. |
| [2] | BP (2019) Full report—BP statistical review of world energy. Available from: https://tinyurl.com/4cekftuy. |
| [3] | RECCA-b. How can regional economic cooperation be accelerated within the RECCA region? Ministry of Foriegn Affairs of the Islamic Republic of Afghanistan, 2018. |
| [4] | Safi M, Alizada B (2018) Integrating Afghanistan into the Belt and Road Initiative Review, Analysis and Prospects. Kabul, Aug. 2018. Available from: http://library.fes.de/pdf-files/bueros/kabul/15587.pdf. |
| [5] |
Danish MSS, Senjyu T, Zaheb H, et al. (2020) Afghanistan as an emerging regional energy hub. J Sustainable Outreach 1: 10–14. http://doi.org/10.37357/1068/jso.1.1.02 doi: 10.37357/1068/jso.1.1.02

|
| [6] | Oseni MO, Pollitt MG (2014) Institutional arrangements for the promotion of regional integration of electricity markets international experience. Accessed: Jan. 04, 2021. Available from: http://econ.worldbank.org. |
| [7] | UN (2019) World Population Prospects 2019, Volume I: Comprehensive Tables, New York. Accessed: Jan. 12, 2021. Available from: https://tinyurl.com/585w9zms. |
| [8] | EIA-b (2020) U.S. Energy Information Administration (EIA) EIA, May 01, 2020. Available from: https://www.eia.gov/. |
| [9] | WoM (2020) Oil Reserves by Country-Worldometer. WorldoMeter Available from: https://www.worldometers.info/oil/oil-reserves-by-country/#tajikistan. |
| [10] | USGS (2006) Assessment of Undiscovered Petroleum Resources of Northern Afghanistan, 2006. Denver. Accessed: Jan. 12, 2021. Available from: https://pubs.usgs.gov/of/2006/1253/pdf_documents/FS-3031.pdf. |
| [11] | EIA-1 (2019) International energy outlook 2019 with projections to 2050. Washington DC 20585, Sep. 2019. Accessed: Jan. 12, 2021. Available from: www.eia.gov/ieo. |
| [12] | Enerdata (2021) World energy & climate statistics—Yearbook 2022. Enerdata, 2021. Available from: https://yearbook.enerdata.net/. |
| [13] | IRENA (2014) Renewable energy prospects: China: REmap 2030 analysis. Abu Dhabi. Available from: www.irena.org/remap. |
| [14] | ERI (2015) China 2050 high renewable energy penetration scenario and roadmap study: Executive summary. Accessed: Jan. 12, 2021. Available from: https://tinyurl.com/2m5r78yh. |
| [15] | IRENA (2017) REmap: Renewable Energy Prospects for India. Abu Dhabi. Available from: www.irena.org/remap. |
| [16] | IEA (2019) World energy balance. Available from: www.iea.org/t&c/. |
| [17] | GIZ (2017) Enabling PV Afghanistan. Available from: https://www.solarwirtschaft.de/fileadmin/user_upload/report_enabling_pv_afg.pdf. |
| [18] | ICE—Interministerial Commision on Energy (2014) Quarterly energy sector status summary report ICE. Kabul, Ministry of Economy of the Islamic Republic of Afghanistan. |
| [19] | SAARC (2017) South Asian association for regional cooperation. Islamabad, Dec. 2017. Accessed: Jan. 03, 2021. Available from: www.saarcenergy.org. |
| [20] | Malhotra R (2013) Fossil Energy: Selected Entries from the Encyclopediam of sustainability science and technology. New York: Springer New York, 2013. |
| [21] | Alister D (2020) South Korea urged to exit coal by 2029 to stick to Paris climate agreement. Climate Home News, Feb. 20, 2020. Available from: https://tinyurl.com/yc844f6n. |
| [22] |
Ruiz Estrada MA, Park D, Tahir M, et al. (2020) Simulations of US-Iran war and its impact on global oil price behavior. Borsa Istanbul Rev 20: 1–12. https://doi.org/10.1016/j.bir.2019.11.002. doi: 10.1016/j.bir.2019.11.002
|
| [23] | Climate analytics (2019) Global and regional coal phase-out requirements of the Paris Agreement: Insights from the IPCC Special Report on 1.5 ℃. Sep. 2019. Accessed: Jan. 12, 2021. Available from: https://tinyurl.com/pak5tr55. |
| [24] | Desjardins J ((2020) Infographic: The World's Projected Energy Mix, 2018–2040. Visual Capitalist, Feb. 03, 2020. Available from: https://www.visualcapitalist.com/the-worlds-projected-energy-mix-2018-2040/. |
| [25] | CFR (2020) Timeline: U.S. Relations With China 1949–2020. Timeline. Available from: https://www.cfr.org/timeline/us-china-relations. |
| [26] | Cyrus N (2020) U.S.-Russia Relations at a Crossroads. Moscow, Aug. 2020. Available from: https://www.csis.org/analysis/us-russia-relations-crossroads. |
| [27] | Saltzman IZ (2012) Russian Grand Strategy and the United States in the 21st Century. Orbis 56: 547–564. http://dx.doi.org/10.1016/j.orbis.2012.08.003 |
| [28] | Chauhan P (2019) Cooperation Against Competition: India and China in the Energy Sector—South Asian Voices. South Asian Voices, Jul. 16. Available from: https://southasianvoices.org/cooperation-against-competition-india-china-energy-sector/. |
| [29] | RECCA (2015) Toward regional economic growth and stability: The silk road through Afghanistan. Available from: https://www.tokyo.mfa.af/publications/towards-regional-economic-growth-and-stability.html. |
| [30] | RECCA (2016) From negotiation to investment, construction, & trade : A new decade of progress. Ministry of Foriegn Affairs of the Islamic Republic of Afghanistan. |
| [31] | Alhasan H (2020) The China-India Contest in the Middle East—The Diplomat. Available from: https://thediplomat.com/2020/07/the-china-india-contest-in-the-middle-east/. |
| [32] | Azam SM (2019) The jeremiad of oil and gas reserves in the Caspian Sea. Geopolit Energy 41: 0273–1371. Available from: www.ceri.ca. |
| [33] | Stone R (2020) What do US-Iran talks mean for Afghanistan? The Diplomat. Available from: https://thediplomat.com/2020/07/what-do-us-iran-talks-mean-for-afghanistan/. |
| [34] | Boute MA (2015) Towards secure and sustainable energy supply in central Asia: Electricity market reform and investment protection. SSRN. http://dx.doi.org/10.2139/ssrn.2505031 |
| [35] | Munadi SM (2018) The OBOR Project. Economic Initiatives around Afghanistan. Cooperation or Competitions between Stakeholders. UNAM, Accessed: Jan. 12, 2021. Available from: www.juridicas.unam.mxhttps://biblio.juridicas.unam.mx/bjvhttps://idic.mx/Librocompletoen: https://goo.gl/JggCz5. |
| [36] | WBG (2019) Belt and road economics: Opportunities and risks of transport corridors. Washington DC. https://doi.org/10.1596/978-1-4648-1392-4 |
| [37] | Pannier B (2019) Will massive project make central Asia the core of regional energy market? Radio Free Europe, Radio Liberty. Available from: https://www.rferl.org/a/will-massive-project-make-central-asia-the-core-of-regional-energy-market-/30227503.html. |
| [38] | LEUN (2019) Saudi crown prince signs pacts worth $20 billion in Pakistan. Time. Available from: https://time.com/5531657/saudi-crown-prince-mbs-pakistan-20-billion/. |
| [39] | Shahzad A (2020) Pakistan returns $1 bln of Saudi Arabia's soft loan. Reuters, Dec. 17, 2020. Available from: https://www.reuters.com/article/pakistan-china-saudi-arabia-idUSL8N2IW3N2. |
| [40] | Nicholson RL (2012) Central-Asia energy geoeconomics and geopolitics: Central Asia's pursuit of sovereignty and prosperity. The University of Texas at Austin. |
| [41] | ADB (2020) Overview: Regional cooperation and integration (RCI). Asian Development Bank, Aug. 2020. Available from: https://www.adb.org/what-we-do/themes/regional-cooperation/overview#carec. |
| [42] | ADB (2017) CAREC 2030: Connecting the region for shared and sustainable development. Manila, Oct. 2017. http://dx.doi.org/10.22617/TCS179132-2 |
| [43] | SAARC (2021) SAARC Secretariat. Available from: https://www.saarc-sec.org/index.php. |
| [44] | SAJ (2016) Does SAARC have a future? South Asia J Available from: http://southasiajournal.net/does-saarc-have-a-future/. |
| [45] | SAARC-SEC (2021) Learn, share, improve and grow together. Available from: https://www.saarcenergy.org/. |
| [46] | ECO (2021) Economic cooperation organization. Available from: http://www.eco.int/index.php. |
| [47] | ECO (2017) ECO vision 2025 & implementation framework. Tehran, Feb. 2017. |
| [48] | UNECE-SPECA (2020) Introduction. UNECE. Available from: https://unece.org/introduction. |
| [49] | UNECE-ESCAP (2020) United Nations special program for the economies of central Asia. (SPECA): Special Workplan for 2020–2021. Available from: https://unece.org/speca-work-plans. |
| [50] | ESCAP (2021) About ESCAP. United Nations Economic and Social Commission for Asia and the Pacific (UNESCAP). Available from: https://www.unescap.org/about. |
| [51] | SCO (2020) About SCO. SCO. Available from: http://eng.sectsco.org/about_sco/. |
| [52] | Dhaka A (2019) Future challenges and economic trends in Asia. Geopolitical report. |
| [53] | SCO (2019) Press release on the Shanghai Cooperation Organization heads of state council meeting. Bishkek. Available from: http://eng.sectsco.org/news/20190614/550955.html. |
| [54] | Ghiasy R, Jiayi Z (2017) The silk road economic belt. Solna. Available from: 10.1038/scientificamerican1195-109. |
| [55] | WBG (2018) Belt and road initiative. World Bank Group. Available from: https://www.worldbank.org/en/topic/regional-integration/brief/belt-and-road-initiative. |
| [56] | Shayan R (2017) China-Pakistan economic corridor. Encyclopedia Britannica. Available from: https://www.britannica.com/topic/China-Pakistan-Economic-Corridor. |
| [57] | ASEAN (2020) Overview—ASEAN: One vision, one identity, one community. Available from: https://asean.org/asean/about-asean/overview/. |
| [58] | RECCA (2018) Afghanistan-Centered regional cooperation: From planning to implementation. Ministry of Foriegn Affairs of the Islamic Republic of Afghanistan. |
| [59] | RECCA (2020) Afghanistan-Tajikistan gas pipeline. Ministry of Foriegn Affairs of the Islamic Republic of Afghanistan. |
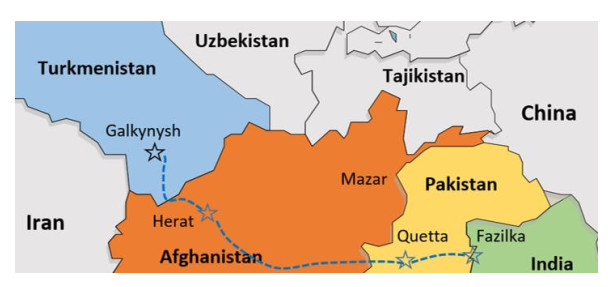
| [60] | MOMP (2020) TAPI Project. Ministry of Mines and Petroleum of the Islamic Republic of Afghanistan. Available from: https://momp.gov.af/tapi-project. |
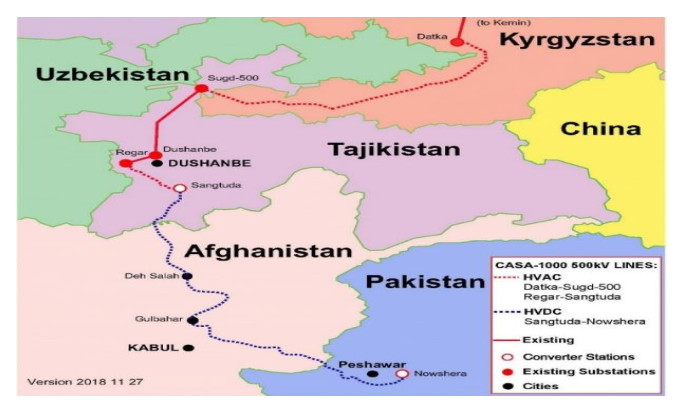
| [61] | CASA-1000 (2020) CASA-1000—Electricity. Available from: http://www.casa-1000.org/. |
Figures(14) / Tables(6)

Sabory Najib Rahman, Danish Mir Sayed Shah, Senjyu Tomonobo, Ahmadzai Mirwais. Afghanistan factor in regional energy security and trade: Existing and projected challenges and opportunities[J]. AIMS Energy, 2023, 11(2): 213-238. doi: 10.3934/energy.2023012


 DownLoad: