The power transmission system of Afghanistan is witnessing a significant shortage in terms of capacity, reliability, flexibility, and energy security. The goal of this paper was to identify and examine the associated issues, challenges, and opportunities for domestic transmission grid and power imports in the country. On these bases, proposals and recommendations were provided that can help the Afghan energy sector strategically enhance its transmission capacity and make the country's existing massive renewable energy potential exploitation feasible. The focus was on the expansion of high-voltage direct current transmission technology. The findings of the paper revealed that the utilization of high-voltage direct current, hybrid high-voltage alternating current, and high-voltage direct current transmission technologies can facilitate bulk power transmission and trade between south and central Asia, as well as regional energy sustainability, development, and security.
Citation: Gul Ahmad Ludin, Mohammad Amin Amin, Ahmad Shah Irshad, Soichiro Ueda, Zakirhussain Farhad, M. H. Elkholy, Tomonobu Senjyu. Power transmission in Afghanistan: Challenges, opportunities and proposals[J]. AIMS Energy, 2024, 12(4): 840-871. doi: 10.3934/energy.2024040
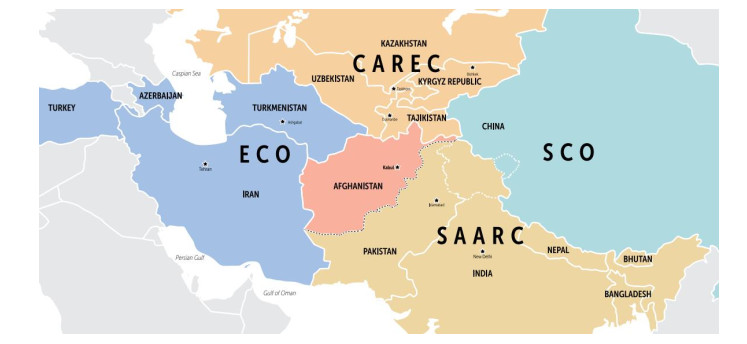
The power transmission system of Afghanistan is witnessing a significant shortage in terms of capacity, reliability, flexibility, and energy security. The goal of this paper was to identify and examine the associated issues, challenges, and opportunities for domestic transmission grid and power imports in the country. On these bases, proposals and recommendations were provided that can help the Afghan energy sector strategically enhance its transmission capacity and make the country's existing massive renewable energy potential exploitation feasible. The focus was on the expansion of high-voltage direct current transmission technology. The findings of the paper revealed that the utilization of high-voltage direct current, hybrid high-voltage alternating current, and high-voltage direct current transmission technologies can facilitate bulk power transmission and trade between south and central Asia, as well as regional energy sustainability, development, and security.

| [1] | Fujita D, Miyazaki T (2024) Techno-economic analysis on the balance of plant (BOP) equipment due to switching fuel from natural gas to hydrogen in gas turbine power plants. 12: 464–480. https://doi.org/10.3934/energy.2024021 |
| [2] |
Ludin GA, Amin MA, Aminzay A, et al. (2017) Theoretical potential and utilization of renewable energy in Afghanistan. AIMS Energy 5: 1–19. https://doi.org/10.3934/energy.2017.1.1 doi: 10.3934/energy.2017.1.1

|
| [3] |
Ludin GA, Nakadomari A, Yona A, et al. (2022) Technical and economic analysis of an HVDC transmission system for renewable energy connection in Afghanistan. Sustainable 14: 1468. https://doi.org/10.3390/su14031468 doi: 10.3390/su14031468
|
| [4] |
Mahdavi M, Schmitt K, Ramos RAV, et al. (2022) Role of hydrocarbons and renewable energies in Iran's energy matrix focusing on bioenergy: review. IET Renewable Power Gener 16: 3384–3405. https://doi.org/10.1049/rpg2.12540 doi: 10.1049/rpg2.12540
|
| [5] |
Mahdavi M, Vera D (2023) Importance of renewable energy sources and agricultural biomass in providing primary energy demand for Morocco. Int J Hydrogen Energy 48: 34575–34598. https://doi.org/10.1016/j.ijhydene.2023.05.246 doi: 10.1016/j.ijhydene.2023.05.246
|
| [6] |
Alassi A, Bañales S, Ellabban O, et al. (2019) HVDC Transmission: Technology review, market trends and future outlook. Renewable Sustainable Energy Rev 112: 530–554. https://doi.org/10.1016/j.rser.2019.04.062 doi: 10.1016/j.rser.2019.04.062
|
| [7] |
Mahdavi M, Kimiyaghalam A, Alhelou HH, et al. (2021) Transmission expansion planning considering power losses, expansion of substations and uncertainty in fuel price using discrete artificial bee colony algorithm. IEEE Access 9: 135983–135995. https://doi.org/10.1109/ACCESS.2021.3116802 doi: 10.1109/ACCESS.2021.3116802
|
| [8] |
Zhang H, Zhang S (2018) A new strategy of HVDC operation for maximizing renewable energy accommodation. 2017 IEEE Power & Energy Society General Meeting 2018: 1–6. https://doi.org/10.1109/PESGM.2017.8274477 doi: 10.1109/PESGM.2017.8274477
|
| [9] | World population review, 2023. Available from: https://worldpopulationreview.com/countries/afghanistan-population (accessed Sep. 05, 2023). |
| [10] | Fichtner, Power Sector Master Plan: Ministry of Energy and Water, Islamic Republic of Afghanistan. p. 451, 2013. Available from: https://www.adb.org/projects/43497-012/main. |
| [11] | Mekong G (2015) RRP Development Coordination. p. 2012–2014. Availabel from: https://www.adb.org/sites/default/files/linked-documents/41682-039-dc.pdf. |
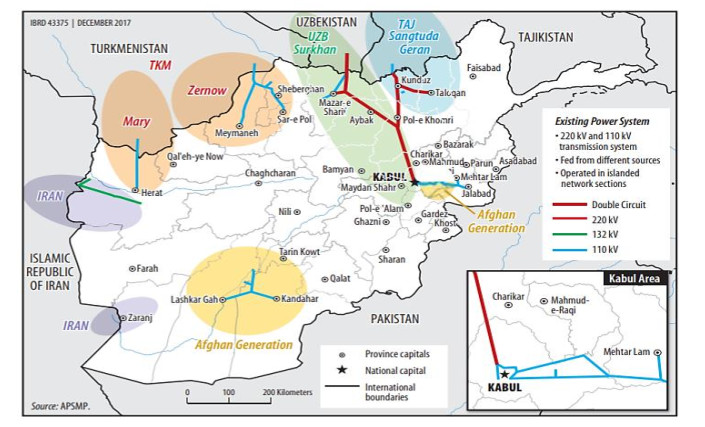
| [12] | WB Group, Afghanistan Renewable Energy Development Issues and Options. World Bank, 2018. https://doi.org/10.1596/30270 |
| [13] |
Ahady S, Dev N, Mandal A (2020) An overview of the opportunities and challenges in sustaining the energy industry in Afghanistan. E3S Web Conf., 173. https://doi.org/10.1051/e3sconf/202017303006 doi: 10.1051/e3sconf/202017303006
|
| [14] |
Wali M, Majidi H, Abdullah MA, et al. (2020) A study on sustainability of internal power generation compared with imported power in Afghanistan. J Sustainable Outreach 1: 1–9. https://doi.org/10.37357/1068/jso.1.1.01 doi: 10.37357/1068/jso.1.1.01
|
| [15] |
Sediqi MM, Ibrahimi AM, Danish MSS, et al. (2018) An optimization analysis of cross-border electricity trading between Afghanistan and its neighbor countries. IFAC-PapersOnLine 51: 25–30. https://doi.org/10.1016/j.ifacol.2018.11.672 doi: 10.1016/j.ifacol.2018.11.672
|
| [16] | Renewable energypolicy 2015. Available from: https://policy.asiapacificenergy.org/sites/default/files/Afghanistan-Renewable-Energy-Policy-English-and-Dari.pdf. |
| [17] |
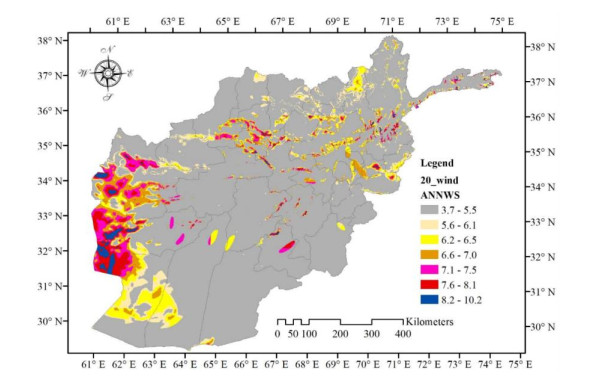
Anwarzai MA, Nagasaka K (2017) Utility-scale implementable potential of wind and solar energies for Afghanistan using GIS multi-criteria decision analysis. Renewable Sustainable Energy Rev 71: 150–160. https://doi.org/10.1016/j.rser.2016.12.048 doi: 10.1016/j.rser.2016.12.048
|
| [18] |
Nasery S, Matci DK, Avdan U (2021) GIS-based wind farm suitability assessment using fuzzy AHP multi-criteria approach: The case of Herat, Afghanistan. Arabian J Geosci 14: 12. https://doi.org/10.1007/s12517-021-07478-5 doi: 10.1007/s12517-021-07478-5
|
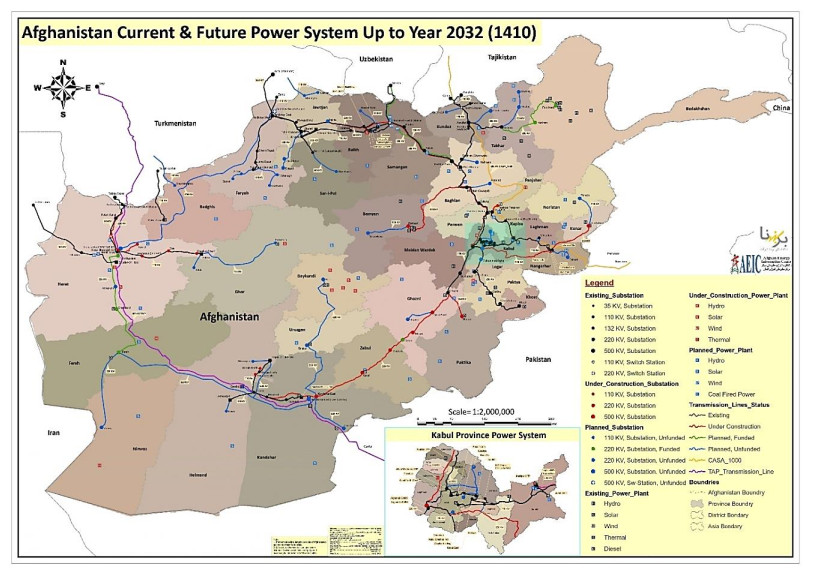
| [19] | Afghanistan Energy Information Center. Available from: https://aeic.af/en/gismaps/13. |
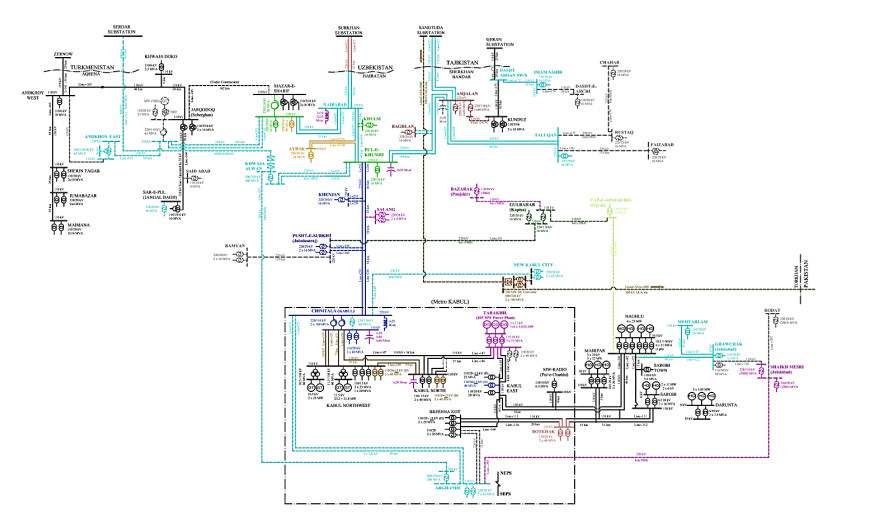
| [20] | NEPS-SLD-Updated Mar-01-2015.pdf. Available from: https://www.worldbank.org/content/dam/Worldbank/document/SAR/afghanistan-country-snapshot-spring--2014.pdf. |
| [21] |
Abbas Z, Kalim I, Malik MS (2019) Casa-1000: Its potential for regional trade and development. Global Polit Rev Ⅳ: 39–48. https://doi.org/10.31703/gpr.2019(iv-iii).05 doi: 10.31703/gpr.2019(iv-iii).05
|
| [22] | CASA-1000 Group, CASA-1000: Central Asia South Asia electricity transmission and trade project regional environmental assessment final (2014). Available from: https://www.casa-1000.org/Docs/0104/CASA-1000%20REA%20Main%20February-14%20Final.pdf. |
| [23] | Niefer R, Addendum to the Afghanistan Power Sector Master Plan. In Technical Assistance Consultant's Report, 2014. Available from: https://api.semanticscholar.org/CorpusID: 169336460. |
| [24] | S. O. Meeting, Energy Sector Progress Report and Work Plan (October 2012–September 2013), no. May, 2019. Available from: http://www.carecprogram.org/uploads/events/2013/SOM-Oct-KAZ/002_104_206_Energy-Sector-Progress-report-and-Work-Plan.pdf. |
| [25] |
Sabory NR, Ershad AM, Danish MSS (2022) Improving the criteria for transmission line routing beyond the techno-economics: The case of Afghanistan. Sustainable 14: 202. https://doi.org/10.3390/su142214933 doi: 10.3390/su142214933
|
| [26] | R. A. and P. for CXOs, Afghanistan's Power Sector Update: Outlook remains uncertain, Mega Trends & Analysis, 2022. Available from: https://reglobal.org/afghanistans-power-sector-update-outlook-remains-uncertain/ (accessed Sep. 03, 2023). |
| [27] |
Sediqi MM, Howlader HOR, Ibrahimi AM, et al. (2017) Development of renewable energy resources in Afghanistan for economically optimized cross-border electricity trading. AIMS Energy 5: 691–717. https://doi.org/10.3934/energy.2017.4.691 doi: 10.3934/energy.2017.4.691
|
| [28] |
Ahmadzai S, McKinna A (2018) Afghanistan electrical energy and trans-boundary water systems analyses: Challenges and opportunities. Energy Rep 4: 435–469. https://doi.org/10.1016/j.egyr.2018.06.003 doi: 10.1016/j.egyr.2018.06.003
|
| [29] |
Ludin GA, Amin MA, Matayoshi H, et al. (2021) Solid-state dc circuit breakers and their comparison in modular multilevel converter based-hvdc transmission system. Electronics 10: 1–22. https://doi.org/10.3390/electronics10101204 doi: 10.3390/electronics10101204
|
| [30] | Financing A, Transport S, Preparatory P, et al. (2012) Road rehibilitation project sector assessment (Summary): Transport. p. 1–6. Available from: https://www.adb.org/sites/default/files/linked-documents/47086-002-ssa.pdf. |
| [31] |
Sadiqi M, Pahwa A, Miller RD (2012) Basic design and cost optimization of a hybrid power system for rural communities in Afghanistan. North American Power Symposium (NAPS), 1–6, https://doi.org/10.1109/NAPS.2012.6336333 doi: 10.1109/NAPS.2012.6336333
|
| [32] | Safi R, Sharma MP (2019) Energy scenario of Afghanistan. IOSR J Eng 9: 50–59. Available from: www.iosrjen.org. |
| [33] |
Amin M, Bernell D (2018) Power sector reform in Afghanistan: Barriers to achieving universal access to electricity. Energy Policy 123: 72–82. https://doi.org/10.1016/j.enpol.2018.08.010 doi: 10.1016/j.enpol.2018.08.010
|
| [34] |
Upreti N, Sunder RG, Dalei NN, et al. (2018) Challenges of India's power transmission system. Util Policy 55: 129–141. https://doi.org/10.1016/j.jup.2018.10.002 doi: 10.1016/j.jup.2018.10.002
|
| [35] | ITP, Renewable Energy Roadmap for Afghanistan, Asian Dev Bank, p. 115, 2017. Available from: https://policy.asiapacificenergy.org/node/3453. |
| [36] | Frej W, Afghanistan Energy Supply Has Increased but An Updated Master Plan Is Needed and Delays and Sustainability Concerns Remain, 2010. Available from: https://www.sigar.mil/pdf/audits/2010-01-15audit-10-04.pdf. |
| [37] |
Imdadullah, Alamri B, Hossain MA, et al. (2021) Electric power network interconnection: A review on current status, future prospects and research direction. Electronics 10: 1–29. https://doi.org/10.3390/electronics10172179 doi: 10.3390/electronics10172179
|
| [38] | Ministry of foreign affairs of Afghanistan, RECCA Annual review, Deepening Connectivity & Expanding Trade Through Investment In & Improving Synergy, no. November, 2017. Available from: https://recca.mfa.gov.af/wp-content/uploads/2022/11/RECCA-Annual-Review-2017-FINAL-VERSION.pdf. |
| [39] |
Fahimi A, Upham P, Münch S (2022) Afghanistan's energy sociotechnical imaginaries: Alternative visions in a conflict zone. Polit Geogr 98: 102657. https://doi.org/10.1016/j.polgeo.2022.102657 doi: 10.1016/j.polgeo.2022.102657
|
| [40] |
Rahman SN, Danish MSS, Senjyu T, et al. (2023) Afghanistan factor in regional energy security and trade: Existing and projected challenges and opportunities. AIMS Energy 11: 213–238. https://doi.org/10.3934/energy.2023012 doi: 10.3934/energy.2023012
|
| [41] |
Rostami R, Khoshnava SM, Lamit H, et al. (2017) An overview of Afghanistan's trends toward renewable and sustainable energies. Renewable Sustainable Energy Rev 76: 1440–1464. https://doi.org/10.1016/j.rser.2016.11.172 doi: 10.1016/j.rser.2016.11.172
|
| [42] |
Irshad AS, Samadi WK, Fazli AM, et al. (2023) Resilience and reliable integration of PV-wind and hydropower based 100% hybrid renewable energy system without any energy storage system for inaccessible area electrification. Energy 282: 128823. https://doi.org/10.1016/j.energy.2023.128823 doi: 10.1016/j.energy.2023.128823
|
| [43] |
Ludin GA, Zeerak H, Tayyab Q, et al. (2023) Novel hybrid fault current limiter with hybrid resonant breaker in multi-terminal HVDC transmission system. Electr Power Syst Res 221: 109403. https://doi.org/10.1016/j.epsr.2023.109403 doi: 10.1016/j.epsr.2023.109403
|
| [44] |
Arcia-Garibaldi G, Cruz-Romero P, Gómez-Expósito A (2018) Future power transmission: Visions, technologies and challenges. Renewable Sustainable Energy Rev 94: 285–301. https://doi.org/10.1016/j.rser.2018.06.004 doi: 10.1016/j.rser.2018.06.004
|
| [45] |
Gul M, Tai N, Huang W, et al. (2019) Technical and economic assessment of VSC-HVDC transmission model: A case study of South-Western region in Pakistan. Electronics, 8. https://doi.org/10.3390/electronics8111305 doi: 10.3390/electronics8111305
|
| [46] | Font A, Ilhann S, Ismailoglu H, et al. (2018) Design and Technical Analysis of 500–600 kV HVDC Transmission System for Turkey. 10th International Conference on Electrical and Electronics Engineering (ELECO), Bursa, Turkey: IEEE Xplore. Available from: https://ieeexplore.ieee.org/document/8266278. |
| [47] |
Meah K, Ula S (2007) Comparative evaluation of HVDC and HVAC transmission systems. 2007 IEEE Power Engineering Society General Meeting, 1–5. https://doi.org/10.1109/PES.2007.385993 doi: 10.1109/PES.2007.385993
|
| [48] |
Hafeez K, Khan SA (2019) High voltage direct current (HVDC) transmission: Future expectations for Pakistan. CSEE J Power Energy Syst, 1–5. https://doi.org/10.17775/CSEEJPES.2017.00530 doi: 10.17775/CSEEJPES.2017.00530
|
| [49] | Novoa JP, Rios MA (2017) Conversion of HVAC Lines into HVDC in transmission expansion planning. Int J Energy Power Eng 11: 1088–7. Available from: https://core.ac.uk/download/pdf/144878228.pdf. |
| [50] |
Manickam R, Palaniappan SN (2018) Upgrading transmission line capability by AC-DC conversion. Comput Electr Eng 68: 616–628. https://doi.org/10.1016/j.compeleceng.2018.01.031 doi: 10.1016/j.compeleceng.2018.01.031
|
| [51] | Lundberg P, Jacobson B, Vinothkumar K (2018) Convert from AC to HVDC for higher power transmission. ABB Rev 4: 64–69. Available from: https://new.abb.com/news/detail/11828/convert-from-ac-to-hvdc-for-higher-power-transmission. |
| [52] |
Larruskain DM, Zamora I, Abarrategui O, et al. (2011) Conversion of AC distribution lines into DC lines to upgrade transmission capacity. Electr Power Syst Res 81: 1341–1348. https://doi.org/10.1016/j.epsr.2011.01.020 doi: 10.1016/j.epsr.2011.01.020
|
| [53] |
Nga Vu TT, Teyssedre G, Roy SL, et al. (2019) The challenges and opportunities for the power transmission grid of Vietnam. Eur J Electr Eng 21: 489–497. https://doi.org/10.18280/ejee.210602 doi: 10.18280/ejee.210602
|
| [54] |
Clerici A, Paris L, Danfors P (1991) HVDC conversion of HVAC lines to provide substantial power upgrading. IEEE Trans Power Delivery 6: 324–333. https://doi.org/10.1109/61.103755 doi: 10.1109/61.103755
|
| [55] |
Javed U, Mughees N, Jawad M, et al. (2021) A systematic review of key challenges in hybrid HVAC-HVDC grids. Energies 14: 1–27. https://doi.org/10.3390/en14175451 doi: 10.3390/en14175451
|
| [56] |
Stanojev O, Garrison J, Hedtke S, et al. (2019) Benefit analysis of a hybrid HVAC/HVDC transmission line: A Swiss case study. 2019 IEEE Milan PowerTech. https://doi.org/10.1109/PTC.2019.8810686 doi: 10.1109/PTC.2019.8810686
|
| [57] |
Javed U, Mughees N, Jawad M, et al. (2021) A systematic review of key challenges in hybrid hvac–hvdc grids. Energies 14: 5451. https://doi.org/10.3390/en14175451 doi: 10.3390/en14175451
|
| [58] |
Siregar Y, Pardede C (2022) Study of hybrid transmission HVAC/HVDC by particle swarm optimization (PSO). Energies 15: 20. https://doi.org/10.3390/en15207638 doi: 10.3390/en15207638
|
| [59] |
Sass F, Sennewald T, Linke F, et al. (2018) System security of hybrid AC-HVDC-systems challenges and new approaches for combined security assessment, preventive optimization and curative actions. Glob Energy Interconnect 1: 585–594. https://doi.org/10.14171/j.2096-5117.gei.2018.05.008 doi: 10.14171/j.2096-5117.gei.2018.05.008
|
| [60] | North Sea Link, 2023. Available from: https://www.northsealink.com/ (accessed Sep. 07, 2023). |
| [61] | National Grid/Energinet, Viking Link Interconnector Affordable, Secure and Green Energy. Available from: https://www.viking-link.com. |
| [62] | Macchione O and Siemens, Western Link HVDC Project, PES Transm Distrib Comm HVDC FACTS Subcomm Present, 1–18, 2018. Available from: http://site.ieee.org/pes-hvdcfacts/files/2019/02/2018WesternLink.pdf. |
| [63] |
Pipelzadeh Y, Chaudhuri B, Green TC, et al. (2015) Role of western HVDC link in stability of future Great Britain (Gb) transmission system. IEEE Power Energy Society General Meeting. https://doi.org/10.1109/PESGM.2015.7286089 doi: 10.1109/PESGM.2015.7286089
|
| [64] |
Rao H, Zhou Y (2019) Key technologies of ultra-high voltage hybrid LCC-VSC MTDC systems. CSEE J Power Energy Syst 5: 365–373. https://doi.org/10.17775/cseejpes.2019.01140 doi: 10.17775/cseejpes.2019.01140
|
| [65] | Iyer R, Rajendra Iyer Project Manager—HVDC Projects, 2006. https://doi.org/10.17775/CSEEJPES.2019.01140. |
| [66] | Englund L, Lagerkvist M, Dass R (2003) HVDC superhighways for China. ABB Rev 4: 14–20. Available from: https://library.e.abb.com/public/8e1e666b438c7dffc1256e46004609d8/ABB%20Special%20Report%2011_03.pdf. |
| [67] |
Wang W, Li G, Guo J (2022) Large-Scale renewable energy transmission by HVDC: Challenges and proposals. Engineering 19: 252–267. https://doi.org/10.1016/j.eng.2022.04.017 doi: 10.1016/j.eng.2022.04.017
|
| [68] | MEW and MRRD (2013) Afghanistan rural renewable energy policy. p. 20. Available from: https://www.lse.ac.uk/GranthamInstitute/wp-content/uploads/laws/4621.pdf. |
Figures(11)

Gul Ahmad Ludin, Mohammad Amin Amin, Ahmad Shah Irshad, Soichiro Ueda, Zakirhussain Farhad, M. H. Elkholy, Tomonobu Senjyu. Power transmission in Afghanistan: Challenges, opportunities and proposals[J]. AIMS Energy, 2024, 12(4): 840-871. doi: 10.3934/energy.2024040


 DownLoad: