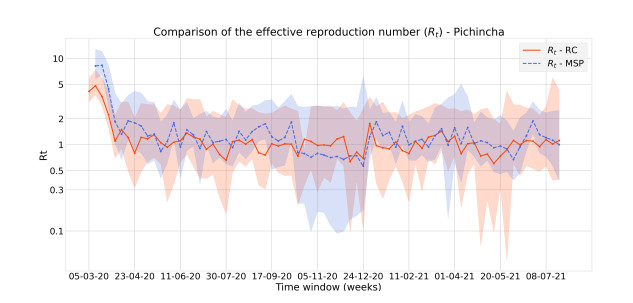
In this article, we considered a Bayesian approach to estimating the evolution of the COVID-19 pandemic in Ecuador, providing the first rigorous analysis of its progression in the country. Specifically, we applied variational data assimilation to estimate the parameters and initial conditions of a compartmental SARS-CoV-2 propagation model while accounting for structural data uncertainty through error covariance matrices. These optimized parameters correspond to maximum-a-posteriori (MAP) estimates, which, in a second stage, allow us to infer the posterior distribution of the parameters. We considered two different data sources: the official count of positive COVID-19 tests from the Ecuadorian Public Health Ministry (MSP) and an estimate of COVID-19-related deaths derived from excess mortality data recorded by the Ecuadorian Civil Registry (RC). We regard RC data as the closest approximation to the actual number of COVID-19 cases. The results highlight that, although there are differences between the estimates obtained using MSP data–generated in real time during the pandemic–and those based on positive cases inferred from excess mortality, the trends in the computed effective reproduction numbers coincide. This suggests that the methodology presented in this paper, and applied in real time during the pandemic, was able to accurately capture the evolution of the pandemic in Ecuador. Additionally, we conducted a comparative analysis of Ecuador's two most populous provinces, Pichincha and Guayas, which experienced the pandemic very differently, particularly in its initial stages. This study aimed to improve our understanding of the virus's spread in these provinces and provide insights into how epidemiological dynamics can vary within the same country.
Citation: Paula Castro, Juan Carlos De los Reyes. Autopsy of SARS-CoV-2 spread dynamics in Ecuador using data assimilation techniques: A tale of two provinces[J]. Mathematical Biosciences and Engineering, 2025, 22(10): 2686-2719. doi: 10.3934/mbe.2025099
In this article, we considered a Bayesian approach to estimating the evolution of the COVID-19 pandemic in Ecuador, providing the first rigorous analysis of its progression in the country. Specifically, we applied variational data assimilation to estimate the parameters and initial conditions of a compartmental SARS-CoV-2 propagation model while accounting for structural data uncertainty through error covariance matrices. These optimized parameters correspond to maximum-a-posteriori (MAP) estimates, which, in a second stage, allow us to infer the posterior distribution of the parameters. We considered two different data sources: the official count of positive COVID-19 tests from the Ecuadorian Public Health Ministry (MSP) and an estimate of COVID-19-related deaths derived from excess mortality data recorded by the Ecuadorian Civil Registry (RC). We regard RC data as the closest approximation to the actual number of COVID-19 cases. The results highlight that, although there are differences between the estimates obtained using MSP data–generated in real time during the pandemic–and those based on positive cases inferred from excess mortality, the trends in the computed effective reproduction numbers coincide. This suggests that the methodology presented in this paper, and applied in real time during the pandemic, was able to accurately capture the evolution of the pandemic in Ecuador. Additionally, we conducted a comparative analysis of Ecuador's two most populous provinces, Pichincha and Guayas, which experienced the pandemic very differently, particularly in its initial stages. This study aimed to improve our understanding of the virus's spread in these provinces and provide insights into how epidemiological dynamics can vary within the same country.

| [1] | World Health Organization, Situation Report 51, March 11, 2020. |
| [2] | S. Kung, M. Doppen, M. Black, I. Braithwaite, C. Kearns, M. Weatherall, et al., Underestimation of COVID-19 mortality during the pandemic, ERJ Open Res., 7 (2021). https://doi.org/10.1183/23120541.00766-2020 |
| [3] |
H. Cevallos-Valdiviezo, A. Vergara-Montesdeoca, G. Zambrano-Zambrano, Measuring the impact of the COVID-19 outbreak in Ecuador using preliminary estimates of excess mortality, March 17–October 22, 2020, Int. J. Infect. Dis., 104 (2021), 297–299. https://doi.org/10.1016/j.ijid.2020.12.045 doi: 10.1016/j.ijid.2020.12.045

|
| [4] |
P. Castro, J. C. De los Reyes, S. González-Andrade, P. Merino, Estimación de parámetros para un modelo del SARS-CoV-2 en Ecuador en presencia de incertidumbre, Rev. Politéc., 47 (2021), 7–16. https://doi.org/10.33333/rp.v47n1.01 doi: 10.33333/rp.v47n1.01
|
| [5] | F. S. Lu, A. T. Nguyen, N. B. Link, M. Lipsitch, M. Santillana, Estimating the early outbreak cumulative incidence of COVID-19 in the United States: Three complementary approaches, medRxiv, 2020. |
| [6] |
M. Roccetti, Excess mortality and COVID-19 deaths in Italy: A peak comparison study, Math. Biosci. Eng., 20 (2023), 7042–7055. https://doi.org/10.3934/mbe.2023304 doi: 10.3934/mbe.2023304
|
| [7] |
R. Li, S. Pei, B. Chen, Y. Song, T. Zhang, W. Yang, et al., Substantial undocumented infection facilitates the rapid dissemination of novel coronavirus (SARS-CoV-2), Science, 368 (2020), 489–493. https://doi.org/10.1126/science.abb3221 doi: 10.1126/science.abb3221
|
| [8] |
D. Wu, T. Wu, Q. Liu, Z. Yang, The SARS-CoV-2 outbreak: what we know, Int. J. Infect. Dis., 94 (2020), 44–48. https://doi.org/10.1016/j.ijid.2020.03.004 doi: 10.1016/j.ijid.2020.03.004
|
| [9] | R. Verity, L. C. Okell, I. Dorigatti, P. Winskill, C. Whittaker, N. Imai, et al., Estimates of the severity of coronavirus disease 2019: a model-based analysis, Lancet Infect. Dis., 20 (2020), 669–677. |
| [10] |
P. Nadler, S. Wang, R. Arcucci, X. Yang, Y. Guo, An epidemiological modelling approach for COVID-19 via data assimilation, Eur. J. Epidemiol., 35 (2020), 749–761. https://doi.org/10.1007/s10654-020-00676-7 doi: 10.1007/s10654-020-00676-7
|
| [11] | H. Biegel, J. Lega, EpiCovDA: a mechanistic COVID-19 forecasting model with data assimilation, preprint, arXiv: 2105.05471, 2021. |
| [12] |
M. Daza-Torres, M. Capistrán, A. Capella, J. Christen, Bayesian sequential data assimilation for COVID-19 forecasting, Epidemics, 39 (2022), 100564. https://doi.org/10.1016/j.epidem.2022.100564 doi: 10.1016/j.epidem.2022.100564
|
| [13] |
R. Fernández-Naranjo, E. Vásconez-González, K. Simbaã-Rivera, L. Gómez-Barreno, J. Izquierdo-Condoy, D. Cevallos-Robalino, et al., Statistical data driven approach of COVID-19 in Ecuador: $R_0$ and $R_t$ estimation via new method, Infect. Dis. Modell., 6 (2021), 232–243. https://doi.org/10.1016/j.idm.2020.12.012 doi: 10.1016/j.idm.2020.12.012
|
| [14] | Dirección General del Registro Civil, Identificación y Cedulación, Cifras Defunciones, 2021. Available from: https://www.registrocivil.gob.ec/cifras/. |
| [15] |
H. Booth, L. Tickle, Mortality modelling and forecasting: A review of methods, Ann. Actuarial Sci., 3 (2008), 3–43. https://doi.org/10.1017/S1748499500000440 doi: 10.1017/S1748499500000440
|
| [16] | Ministerio Salud Pública Ecuador, Actualización de Casos de Coronavirus en Ecuador, 2021. Available from: https://www.salud.gob.ec/actualizacion-de-casos-de-coronavirus-en-ecuador/. |
| [17] | Instituto Nacional de Estadísticas y Censos (INEC), Proyección Poblacional, 2021. Available from: https://www.ecuadorencifras.gob.ec/proyecciones-poblacionales/. |
| [18] | World Health Organization, Estimating Mortality from COVID-19, 2020. Available from: https://www.who.int/publications/i/item/WHO-2019-nCoV-Sci-Brief-Mortality-2020.1. |
| [19] |
J. Feng, H. Luo, Y. Wu, Q. Zhou, R. Qi, A new method for accurate calculation of case fatality rates during a pandemic: Mathematical deduction based on population-level big data, Infect. Med., 2 (2023), 96–104. https://doi.org/10.1016/j.imj.2023.03.002 doi: 10.1016/j.imj.2023.03.002
|
| [20] | MIDAS Coordination Center, Midas Online COVID-19 Portal, 2020. Available from: https://github.com/midas-network/COVID-19/. |
| [21] |
L. Nikolai, C. Meyer, P. Kremsner, T. Velavan, Asymptomatic SARS Coronavirus 2 infection: Invisible yet invincible, Int. J. Infect. Dis., 100 (2020), 112–116. https://doi.org/10.1016/j.ijid.2020.08.076 doi: 10.1016/j.ijid.2020.08.076
|
| [22] |
P. Sah, M. Fitzpatrick, C. Zimmer, E. Abdollahi, L. Juden-Kelly, S. Moghadas, et al., Asymptomatic SARS-CoV-2 infection: A systematic review and meta-analysis, Proc. Natl. Acad. Sci., 118 (2021), e2109229118. https://doi.org/10.1073/pnas.2109229118 doi: 10.1073/pnas.2109229118
|
| [23] |
G. Syangtan, S. Bista, P. Dawadi, B. Rayamajhee, L. Shrestha, R. Tuladhar, et al., Asymptomatic SARS-CoV-2 carriers: a systematic review and meta-analysis, Front. Public Health, 8 (2021), 587374. https://doi.org/10.3389/fpubh.2020.587374 doi: 10.3389/fpubh.2020.587374
|
| [24] | Ministerio de Salud Pública del Ecuador, Informe Epidemiológico de COVID-19, Ecuador 2021, December 07, 2021, 2021. Available from: https://www.salud.gob.ec/wp-content/uploads/2021/12/MSP_ecu_cvd19_datos_epi_20211207.pdf. |
| [25] |
R. Yang, X. Gui, Y. Xiong, Comparison of clinical characteristics of patients with asymptomatic vs symptomatic coronavirus disease 2019 in Wuhan, China, JAMA Network Open, 3 (2020), e2010182. https://doi.org/10.1001/jamanetworkopen.2020.10182 doi: 10.1001/jamanetworkopen.2020.10182
|
| [26] |
H. Wang, K. Paulson, S. Pease, S. Watson, H. Comfort, P. Zheng, et al., Estimating excess mortality due to the COVID-19 pandemic: A systematic analysis of COVID-19-related mortality, 2020–2021, Lancet, 399 (2022), 1513–1536. https://doi.org/10.1016/S0140-6736(21)02796-3 doi: 10.1016/S0140-6736(21)02796-3
|
| [27] |
M. Peirlinck, K. Linka, F. Costabal, J. Bhattacharya, E. Bendavid, J. Ioannidis, et al., Visualizing the invisible: The effect of asymptomatic transmission on the outbreak dynamics of COVID-19, Comput. Methods Appl. Mech. Eng., 372 (2020), 113410. https://doi.org/10.1016/j.cma.2020.113410 doi: 10.1016/j.cma.2020.113410
|
| [28] | V. Bitsouni, N. Gialelis, I. Stratis, A model for the outbreak of COVID-19: Vaccine effectiveness in a case study of italy, in International Scientific Conference (on) Modern Methods, Problems and Applications of Operator Theory and Harmonic Analysis, Springer, (2020), 91–107. |
| [29] | I. De Falco, A. Della Cioppa, U. Scafuri, E. Tarantino, Differential evolution to estimate the parameters of a seiar model with dynamic social distancing: the case of COVID-19 in Italy, in Data Science for COVID-19, Elsevier, (2021), 75–90. https://doi.org/10.1016/B978-0-12-824536-1.00005-8 |
| [30] | V. M. Alekseev, V. M. Tikhomirov, S. V. Fomin, Optimal Control, Springer Science and Business Media, 1987. |
| [31] | J. C. De los Reyes, Numerical PDE-Constrained Optimization, Springer Verlag, 2015. https://doi.org/10.1007/978-3-319-13395-9 |
| [32] | D. Kennedy, V. K. Vu, H. Ritchie, R. Bartlein, O. Rothschild, D. Bausch, et al., COVID-19: Identifying countries with indicators of success in responding to the outbreak, Gates Open Res., 4 (2021), 62. |
| [33] | Our World in Data, Daily COVID-19 Tests per 1000 People, 2024. Available from: https://ourworldindata.org/grapher/daily-tests-per-thousand-people-smoothed-7-day. |
| [34] |
J. Helton, F. Davis, Latin hypercube sampling and the propagation of uncertainty in analyses of complex systems, Reliab. Eng. Syst. Saf., 81 (2003), 23–69. https://doi.org/10.1016/S0951-8320(03)00058-9 doi: 10.1016/S0951-8320(03)00058-9
|
| [35] | C. T. Kelley, Iterative Methods for Optimization, SIAM, 1999. https://doi.org/10.1137/1.9781611970920 |
| [36] | El Universo, Positividad en Pruebas de Detección Para COVID-19, a Nivel Nacional, 2022. Available from: https://www.eluniverso.com/noticias/ecuador/la-positividad-en-pruebas-para-detectar-COVID-19-ha-ido-en-aumento-desde-noviembre-en-el-pais-nota/. |
| [37] | J. Machado, 38 de Cada 100 Pruebas Tomadas en Ecuador dan Positivo por Rebrote de COVID-19, 2022. Available from: https://www.primicias.ec/noticias/sociedad/pruebas-ecuador-COVID-positividad-omicron/. |
| [38] | S. España, Quito Enfrenta un Pico de Coronavirus sin Camas de Cuidados Intensivos Disponibles, 2020. Available from: https://elpais.com/sociedad/2020-07-14/quito-enfrenta-un-pico-de-coronavirus-sin-camas-de-cuidados-intensivos-disponibles.html. |
| [39] |
B. Ridenhour, J. M. Kowalik, D. K. Shay, El número reproductivo básico ($R_0$): Consideraciones para su aplicación en la salud pública, Am. J. Public Health, 104 (2014), e32–e41. https://doi.org/10.2105/AJPH.2013.301704 doi: 10.2105/AJPH.2013.301704
|
| [40] | R. Moore, R. Kearfott, M. Cloud, Introduction to Interval Analysis, SIAM, 2009. https://doi.org/10.1137/1.9780898717716 |
| [41] |
D. Sotiropoulos, K. Tserpes, Interval-based computation of the uncertainty in the mechanical properties and the failure analysis of unidirectional composite materials, Math. Comput. Appl., 27 (2022), 38. https://doi.org/10.3390/mca27030038 doi: 10.3390/mca27030038
|
| [42] |
Z. Qiu, Y. Ma, X. Wang, Comparison between non-probabilistic interval analysis method and probabilistic approach in static response problem of structures with uncertain-but-bounded parameters, Commun. Numer. Methods Eng., 20 (2004), 279–290. https://doi.org/10.1002/cnm.668 doi: 10.1002/cnm.668
|
| [43] |
A. Zemkoho, A basic time series forecasting course with Python, Oper. Res. Forum, 4 (2022), 2. https://doi.org/10.1007/s43069-022-00179-z doi: 10.1007/s43069-022-00179-z
|
| [44] | P. Brockwell, R. Davis, Introduction to Time Series and Forecasting, Springer, 2002. https://doi.org/10.1007/b97391 |
| [45] | A. Gelman, J. B. Carlin, H. S. Stern, D. B. Rubin, Bayesian Data Analysis, Chapman and Hall/CRC, 1995. |
Figures(11) / Tables(2)

Paula Castro, Juan Carlos De los Reyes. Autopsy of SARS-CoV-2 spread dynamics in Ecuador using data assimilation techniques: A tale of two provinces[J]. Mathematical Biosciences and Engineering, 2025, 22(10): 2686-2719. doi: 10.3934/mbe.2025099


 DownLoad: