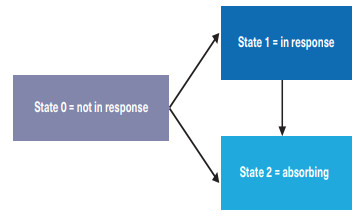
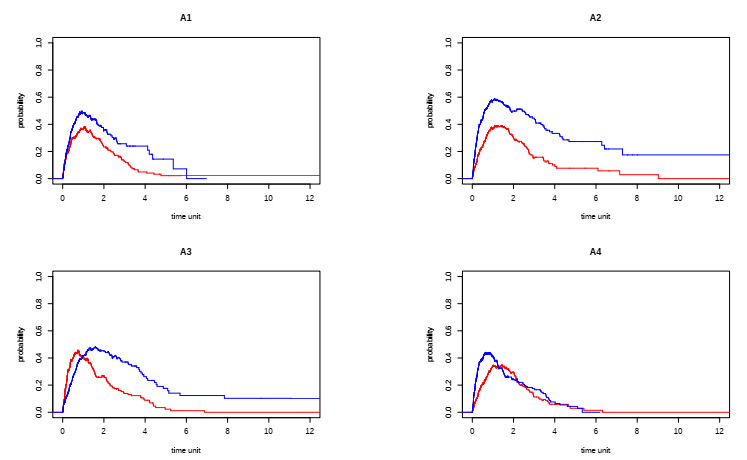
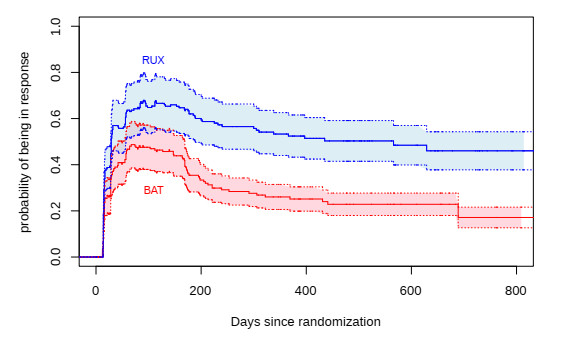
The probability-of-being-in-response (PBR) curve is a graphical method that combines two time-to-event endpoints, namely time from study start to first response and time from first response to subsequent failure considering all patients of a study. We generalize the logrank-test to a test that compares PBR curves. We focus on the global null hypothesis of no difference between the multistate stochastic processes underlying the two curves. The test is designed in such a way that it has high power when the PBR is consistently higher for one of the two groups at all times. Simulations and the application to clinical trial data show that the proposed tests are useful additions to the visual comparison of PBR curves.
Citation: Ekkehard Glimm, Norbert Hollaender. Testing probability of being in response[J]. AIMS Mathematics, 2026, 11(1): 66-84. doi: 10.3934/math.2026004
The probability-of-being-in-response (PBR) curve is a graphical method that combines two time-to-event endpoints, namely time from study start to first response and time from first response to subsequent failure considering all patients of a study. We generalize the logrank-test to a test that compares PBR curves. We focus on the global null hypothesis of no difference between the multistate stochastic processes underlying the two curves. The test is designed in such a way that it has high power when the PBR is consistently higher for one of the two groups at all times. Simulations and the application to clinical trial data show that the proposed tests are useful additions to the visual comparison of PBR curves.

| [1] | O. Aalen, O. Borgan, H. Gjessing, Survival and event hisftory analysis: A process point of view, New York: Springer, 2008. https://doi.org/10.1007/978-0-387-68560-1 |
| [2] | P. K. Andersen, O. Borgan, R. D. Gill, N. Keiding, Statistical models based on counting processes, New York: Springer, 1993. https://doi.org/10.1007/978-1-4612-4348-9 |
| [3] |
P. K. Andersen, S. Esbjerg, T. I. A. Sorensen, Multi-state models for bleeding episodes and mortality in liver cirrhosis, Stat. Med., 19 (2000), 587–599. https://doi.org/10.1002/(sici)1097-0258(20000229)19:4<587::aid-sim358>3.0.co;2-0 doi: 10.1002/(sici)1097-0258(20000229)19:4<587::aid-sim358>3.0.co;2-0

|
| [4] |
P. C. Austin, D. S. Lee, J. P. Fine, Introduction to the analysis of survival data in the presence of competing risks, Circulation, 133 (2016), 601–609. https://doi.org/10.1161/CIRCULATIONAHA.115.017719 doi: 10.1161/CIRCULATIONAHA.115.017719
|
| [5] |
C. B. Begg, M. Larson, A study of the use of the probability-of-being-in-response function as a summary of tumor response data, Biometrics, 38 (1982), 59–66. https://doi.org/10.2307/2530288 doi: 10.2307/2530288
|
| [6] |
Y. Cui, B. Huang, L. Mao, H. Uno, L. J. Wei, L. Tian, Inferences for the distribution of the duration of response in a comparative clinical study, Clin. Trials, 21 (2024), 541–552. https://doi.org/10.1177/17407745241264188 doi: 10.1177/17407745241264188
|
| [7] |
M. F. Danzer, A. Faldum, T. Simon, B. Hero, R. Schmidt, Confirmatory adaptive designs for clinical trials with multiple time-to-event outcomes in multi-state markov models, Biometrical J., 66 (2024), e202300181. https://doi.org/10.1002/bimj.202300181 doi: 10.1002/bimj.202300181
|
| [8] |
E. A. Eisenhauer, P. Therasse, J. Bogaerts, L. H. Schwartz, D. Sargent, R. Ford, et al., New response evaluation criteria in solid tumours: revised recist guideline (version 1.1), Eur. J. Cancer, 45 (2009), 228–247. https://doi.org/10.1016/j.ejca.2008.10.026 doi: 10.1016/j.ejca.2008.10.026
|
| [9] |
S. Ellis, K. J. Carroll, K. Pemberton, Analysis of duration of response in oncology trials, Contemp. Clin. Trials, 29 (2008), 456–465. https://doi.org/10.1016/j.cct.2007.10.008 doi: 10.1016/j.cct.2007.10.008
|
| [10] |
N. Hollaender, E. Glimm, J. Gauvin, T. Stefanelli, R. Zeiser, A novel approach to visualize clinical benefit of therapies for chronic graft versus host disease (cGvHD): The probability of being in response (PBR) applied to the REACH3 study, Bone Marrow Transpl., 59 (2024), 12–16. https://doi.org/10.1038/s41409-023-02128-8 doi: 10.1038/s41409-023-02128-8
|
| [11] |
B. Huang, L. Tian, Utilizing restricted mean duration of response for efficacy evaluation of cancer treatments, Pharm. Stat., 21 (2022), 865–878. https://doi.org/10.1002/pst.2198 doi: 10.1002/pst.2198
|
| [12] |
B. Huang, L. Tian, Z. McCaw, X. Luo, E. Talukder, M. Rothenberg, et al., Analysis of response data for assessing treatment effects in comparative clinical studies, Ann. Intern. Med., 173 (2020), 368–374. https://doi.org/10.7326/M20-0104 doi: 10.7326/M20-0104
|
| [13] |
B. Huang, L. Tian, E. Talukder, M. Rothenberg, D. Kim, L. Wei, Evaluating treatment effect based on duration of response for a comparative oncology study, JAMA Oncol., 4 (2018), 874–876. https://doi.org/10.1001/jamaoncol.2018.0275 doi: 10.1001/jamaoncol.2018.0275
|
| [14] |
E. Kaplan, P. Meier, Nonparametric estimation from incomplete observations, J. Am. Stat. Assoc., 53 (1958), 457–481. https://doi.org/10.1080/01621459.1958.10501452 doi: 10.1080/01621459.1958.10501452
|
| [15] |
A. Nießl, A. Allignol, J. Beyersmann, C. Mueller, Statistical inference for state occupation and transition probabilities in non-markov multi-state models subject to both random left-truncation and right-censoring, Economet. Stat., 25 (2023), 110–124. https://doi.org/10.1016/j.ecosta.2021.09.008 doi: 10.1016/j.ecosta.2021.09.008
|
| [16] | R Core Team, R: A language and environment for statistical computing, R Foundation for Statistical Computing, Vienna, Austria, 2021. |
| [17] | P. J. Smith, Analysis of failure and survival data, New York: Chapman & Hall/CRC, 2002. https://doi.org/10.1201/9781315273150 |
| [18] |
N. Temkin, An analysis for transient states with application to tumor shrinkage, Biometrics, 34 (1978), 571–580. https://doi.org/10.2307/2530376 doi: 10.2307/2530376
|
| [19] | T. M. Therneau, P. M. Grambsch, Modeling survival data: Extending the Cox model, Statistics, 2000. |
| [20] | W. Y. Tsai, X. Luo, J. Crowley, The probability of being in response function and its applications, In: Frontiers of biostatistical methods and applications in clinical oncology, Singapore: Springer, 2017. https://doi.org/10.1007/978-981-10-0126-0_10 |
| [21] |
A. A. Tsiatis, The asymptotic joint distribution of the efficient scores test for the proportional hazards model calculated over time, Biometrika, 68 (1981), 311–315. https://doi.org/10.2307/2335832 doi: 10.2307/2335832
|
| [22] |
R. Zeiser, N. Polverelli, R. Ram, S. Hashmi, R. Chakraverty, J. Middeke, et al., Ruxolitinib for glucocorticoid-refractory chronic graft-versus-host disease, N. Engl. J. Med., 385 (2021), 228–238. https://doi.org/10.1056/NEJMoa2033122 doi: 10.1056/NEJMoa2033122
|
Figures(3) / Tables(5)

Ekkehard Glimm, Norbert Hollaender. Testing probability of being in response[J]. AIMS Mathematics, 2026, 11(1): 66-84. doi: 10.3934/math.2026004


 DownLoad: