Loading [Contrib]/a11y/accessibility-menu.js
Research article Topical Sections

Non-contact reflectometric readout of disposable microfluidic devices by near infra-red low-coherence interferometry

  • We are here demonstrating the functionality of infra-red low-coherence reflectometry for the spot optical readout of solution concentrations in commercially available microfluidic devices. Disposable polymeric microfluidic devices composed by 100-µm-deep channels were connected to an external fluidic path that allowed flow-through of water-glucose solutions at different concentrations. Measurements were performed with near-infrared low-power sources, namely a tungsten lamp and a Superluminescent Light Emitting Diode (SLED), allowing the read-out in a wavelength region of minimum invasiveness for biological fluids. The selected optical scheme based on an all-fiber Michelson configuration is well suited for non-contact, remote investigations of the fluids flowing in plastic microfluidic devices, with arbitrary layout and thickness. For the first time, using the SLED, we exploited the double round trip of light in the fluid channel for doubling the sensitivity with respect to the standard single pass set-up, previously demonstrated.

    Citation: Giulia Rigamonti, Marco Guardamagna, Sabina Merlo. Non-contact reflectometric readout of disposable microfluidic devices by near infra-red low-coherence interferometry[J]. AIMS Biophysics, 2016, 3(4): 585-595. doi: 10.3934/biophy.2016.4.585

    Related Papers:

    [1] Zhe Mei, Zhiwen Liu, Zhiguo Zhou . A compact and low cost microfluidic cell impedance detection system. AIMS Biophysics, 2016, 3(4): 596-608. doi: 10.3934/biophy.2016.4.596
    [2] Zubaidah Ningsih, James W.M. Chon, Andrew H.A. Clayton . A Microfluidic Device for Spatiotemporal Delivery of Stimuli to Cells. AIMS Biophysics, 2015, 2(2): 58-72. doi: 10.3934/biophy.2015.2.58
    [3] Stefania Torino, Mario Iodice, Ivo Rendina, Giuseppe Coppola . Microfluidic technology for cell hydrodynamic manipulation. AIMS Biophysics, 2017, 4(2): 178-191. doi: 10.3934/biophy.2017.2.178
    [4] Reza Hadjiaghaie Vafaie, Aysan Madanpasandi . In-situ AC electroosmotic and thermal perturbation effects for wide range of ionic strength. AIMS Biophysics, 2017, 4(3): 451-464. doi: 10.3934/biophy.2017.3.451
    [5] Jaouhra Cherif, Anis Raddaoui, Ghofrane Ben Fraj, Asma Laabidi, Nada Souissi . Escherichia coli's response to low-dose ionizing radiation stress. AIMS Biophysics, 2024, 11(2): 130-141. doi: 10.3934/biophy.2024009
    [6] Michael Worcester, Shayan Nejad, Pratyasha Mishra, Quintin Meyers, Melissa Gomez, Thomas Kuhlman . A low-cost stage-top incubation device for live human cell imaging using rapid prototyping methods. AIMS Biophysics, 2025, 12(2): 164-173. doi: 10.3934/biophy.2025010
    [7] Hanieh Hadady, Doug Redelman, Sage R. Hiibel, Emil J. Geiger . Continuous-flow sorting of microalgae cells based on lipid content by high frequency dielectrophoresis. AIMS Biophysics, 2016, 3(3): 398-414. doi: 10.3934/biophy.2016.3.398
    [8] Nikolay Kalaydzhiev, Elena Zlatareva, Dessislava Bogdanova, Svetozar Stoichev, Avgustina Danailova . Changes in biophysical properties and behavior of aging human erythrocytes treated with natural polyelectrolytes. AIMS Biophysics, 2025, 12(1): 14-28. doi: 10.3934/biophy.2025002
    [9] Michael R Hamblin . Mechanisms and applications of the anti-inflammatory effects of photobiomodulation. AIMS Biophysics, 2017, 4(3): 337-361. doi: 10.3934/biophy.2017.3.337
    [10] Dinesh Bhatia, Tania Acharjee, Monika Bhatia . Advancements in nanosensors for cancer detection. AIMS Biophysics, 2024, 11(4): 527-583. doi: 10.3934/biophy.2024028
  • We are here demonstrating the functionality of infra-red low-coherence reflectometry for the spot optical readout of solution concentrations in commercially available microfluidic devices. Disposable polymeric microfluidic devices composed by 100-µm-deep channels were connected to an external fluidic path that allowed flow-through of water-glucose solutions at different concentrations. Measurements were performed with near-infrared low-power sources, namely a tungsten lamp and a Superluminescent Light Emitting Diode (SLED), allowing the read-out in a wavelength region of minimum invasiveness for biological fluids. The selected optical scheme based on an all-fiber Michelson configuration is well suited for non-contact, remote investigations of the fluids flowing in plastic microfluidic devices, with arbitrary layout and thickness. For the first time, using the SLED, we exploited the double round trip of light in the fluid channel for doubling the sensitivity with respect to the standard single pass set-up, previously demonstrated.


    1. Introduction

    In recent years, the integration of optics and microfluidics for the realization of micro-opto-fluidic sensors has been object of an increasing interest, especially in the biological and biomedical field. In fact, this kind of devices offers multiple advantages: the optical measurement is an intrinsically low-invasive read-out method that can be performed without any contact with the sample, while the integration of a fluidic system allows rapid sample processing and precise control of fluids, furthermore requiring very small amounts of material, allowing to reduce the response time and realize portable system [1,2,3,4,5]. Moreover, optical read-out allows label free sensing, which is safer, less invasive and has lower cost, since no exogenous markers are required [3,6,7]. In this field a great interest has been addressed to miniaturized devices realized in glass or polymeric materials that can be mass-produced and easily integrated into the fluidic system [6,8,9,10,11]. As label-free optical read-out method, optical low-coherence reflectometry (OLCR) is a very powerful technique that allows a noninvasive characterization of optical components, and can thus be an interesting diagnostic tool [12,13,14,15,16]. OLCR enables the detection of relative distances of optical interfaces as well as their variations due to refractive index changes occurring inside the device under test. In a simple time-domain OLCR setup based on a Michelson interferometer configuration, the length of the reference arm is swept by translating a reference mirror in parallel with the measuring arm that ends with the multiple interface device under test. Briefly, as the reference mirror is displaced, when the time delay on the reference arm matches the delay to an interface of the tested device, interferometric fringes are detected. The functionality of the proposed technique has been already demonstrated for microfluidic applications on glass rectangular micro-capillaries [17,18] and for in-depth device characterization on silicon hybrid, high-order photonic crystals [19] that are not transparent in the visible spectrum. Here we report for the first time the application of the technique for testing a polymeric commercial microfluidic device, namely the IBIDI® VI0.1 µ-Slide, incorporating six parallel channels, for detection of solution concentrations flowing in a channel [20]. The µ-Slide exhibits good optical properties, easy interconnection capabilities with the fluidic pumping system and internal volumes of the order of microliters. We used two different broadband light sources in the near-infrared region, a tungsten lamp and a SLED source emitting at 1.35 µm, shone orthogonally to the device coverslip, to detect the optical path distance between its inner interfaces. Solutions of glucose in water were easily inserted into the slide by means of a simple fluidic system and the induced optical path length changes were directly related to the solution concentration. Using the SLED and monitoring the double round trip of light into the channel we achieved double sensitivity with respect to the single pass set-up, previously demonstrated.


    2. Materials and Method

    Figure 1a shows a picture of the IBIDI® VI0.1 µ-Slide that was kindly provided by IBIDI as a free sample. The VI0.1 µ-Slide is a disposable device incorporating six parallel channels with depth of 100 µm, length of 17 mm and width equal to 1 mm (Figure 1a). The geometrical thickness of the front coverslip is nominally equal to 180 µm, thus suitable for microscopy analyses. Each channel has a total internal volume of approximately 1.7 µl, thus allowing to work with small samples, an important feature in the field of biological analyses [3]. The µ-Slide is realized with a polymeric material with optical properties comparable to that of glass [20] and offers Luer female connections at both ends of each channel for an easy interconnection with the fluidic system by means of tubing with male Luer connectors. In our setup, one end of the channel was linked to a peristaltic pump whereas the tube on the other side was dipped in a vial containing the fluid to be tested. Actuating the peristaltic pump, the fluid was aspirated into the channel. After flowing through the channel, the fluid was discarded. Figure 1b shows the µ-Slide fixed on a custom-designed L-shaped mounting, securely fastened to an aluminum holder placed on x-y-x precision micropositioner, and connected to the fluidic system.

    Figure 1. IBIDI® VI0.1 µ-Slide with six 100-µm-deep channels and Luer terminations for fluidic interconnection: (a) photo of the device; (b) photo of the µ-Slide integrated in the experimental setup and interfaced with the fluidic system.

    Figure 2 shows the instrumental configuration for performing optical low-coherence reflectometry (OLCR) that was already discussed in detail in our previous works [17,18] where it was applied for testing glass micro-capillaries. In the present work, read-out radiation was provided by two different broadband light sources emitting in the near infrared. In addition to the previously applied tungsten lamp, with an ultra-wide emission spectrum in the wavelength range from 1.2 µm to 1.7 µm and a spectral density of about -60 dBm/10 nm, we here employed also a fiber-coupled super luminescent light emitting diode (SLED, Covega Thorlabs SLD1021) with Gaussian emission spectrum: central wavelength was λc = 1.35 µm and total emitted power was approximately 100 µW, when pumped with a 20 mA current at T = 25 °C. Thanks to higher SLED power, a better signal-to-noise ratio was obtained with this source compared to the lamp. The SLED was protected from back-reflections with a fiber pig-tailed optical isolator (OI). Briefly, the light coupled in the fiber was, through a pair of 2 × 2 couplers with 50:50 splitting-ratio, redirected on two different paths, i.e. the reference path, leading to a reference mirror, and the measuring path, heading to the device under test. Both paths ended with a pigtail-style focuser with aspheric lens (by OzOptics), shining a 50-µm-diameter spot at a working distance of 23.5 mm. The reference mirror was mounted on a motorized computer-controlled translational stage, allowing to change the length of the reference path with 50 nm step. All fiber paths were based on standard telecommunication optical fibers (9/125 µm core/cladding diameter Single Mode Fiber, SMF). Radiation reflected by the mirror and the multiple interfaces composing the device under test was coupled back in fiber and redirected to the InGaAs photodiodes PhD1 and PhD2 incorporated in a balanced receiver that removed the DC component of the signal and other common mode signals [21], allowing an efficient detection of the interferometric fringes. With an analog-to-digital (A/D) converter, the signals were acquired with a personal computer (PC).

    Figure 2. Instrumental and optical configuration for infrared low-coherence reflectometry. PhD: InGaAs photodiode. A/D: analog-to-digital conversion board. PC: personal computer. FO: fiber optic. C: bidirectional 2 × 2 FO couplers with 50:50 splitting ratio and flat spectral response.

    3. Results and Discussion

    Aim of the measurements was detecting the concentration of the solution flowing inside the micro-channel of the polymeric device. The output signals provided by our setup and measuring technique consisted in groups of interferometric fringes that were developed whenever the optical path along the reference arm matched the optical path relative to the various refractive index discontinuities on the measuring arm.

    Low-coherence light sources allow to separate the contributions to the interferometric signal that come from spatially separated interfaces perfectly aligned in-depth and inside the device. In this way, it is possible to correlate a detected group of fringes to the interface that is causing the reflected signal, which is coherently interfering on the photodetector with the signal from the reference mirror. The lower the coherence length of the source, the better the in-depth resolution. Moreover, without optical path length matching between the reference mirror and sample discontinuities, no interferometric signal is generated, thus vibrations do not affect the signal when scanning between interfaces.

    Photodetected signals were acquired in the time domain t and converted in the optical path (OP) domain through the relation OP = v·t, where v is the reference mirror traveling speed, set to 10 µm/s. It is well known that in case of dispersive media and broadband light sources, the optical path length depends on the geometrical thickness d and the group refractive index ng of the medium crossed by light with the following relationship, OP = ng·d [3].

    Figure 3 shows the collected interferometric signal over an empty channel of the µ-Slide using the tungsten lamp as read-out source. Four group of fringes are easily recognized, corresponding to the four polymer-air interfaces encountered by the light when shone orthogonally to the slide surfaces. In particular, taking the distance between the peaks of the first two groups of fringes, we estimated the optical path length OP1 ≈ 289 µm that corresponds to the optical thickness of the IBIDI polymer coverslip, with a nominal geometrical thickness of 180 µm. We also estimated the optical path length of the empty channel as OP2 = 100 µm, in agreement with the size declared by IBIDI, being the refractive index of air nair ≈ 1 RIU (Refractive Index Unit). Finally, by taking the distance between the peaks of the last two groups of fringes, we attained the optical path length OP3 ≈ 1902 µm, corresponding to the optical thickness of the back layer. OLCR employs a quite simple setup for characterizing multilayer microfluidic devices yielding information on the geometrical structure and on the optical thickness, useful for example in view of further microscopy analyses.

    Figure 3. Interferometric signal as a function of the optical path obtained in a position of the IBIDI VI0.1 µ-Slide corresponding to the empty channel using the tungsten lamp as readout source. OP1, OP2, OP3: optical paths relative to the single trip of light across the front layer facing the read-out fiber, the channel, and the back layer, respectively. Note the presence of small amplitude fringe groups due to multiple round trips, yielding SP1 = 2·OP2, SP2 = OP1, SP3 = OP1 + OP2, SP4 = OP1 + (2·OP2). Inset: zoom of the third group of fringes.

    On the graph in Figure 3, four groups of fringes with much lower amplitude can also be observed between the 3rd and 4rd high-amplitude fringe groups. They correspond to multiple round-trips of the readout light through the device; in particular, the optical path-length indicated as SP1 is due to a double round trip in the channel, thus SP1 = 2·OP2, whereas the optical path length indicated as SP2 is due to a second round trip in the polymer coverslip, thus SP2 = OP1. We also verified that SP3 = OP1 + OP2, whereas the last low-amplitude fringe group is due to a double round trip into the channel followed by an additional round trip into the coverslip, yielding SP4 = OP1+ (2·OP2).

    We then performed interferometric measurements with fluids in the channel in static conditions. The peristaltic pump was actuated just for filling the channel, and then operated again to discard the fluid after the optical measurement was performed.

    Figure 4 shows three traces corresponding to three interferometric signals (in absolute value and with normalized amplitude to the maximum peak value) in the optical path range relative to the channel and its limiting interfaces. The black trace refers to the signal obtained on the empty channel; the green dotted trace is relative to the signal acquired on the channel filled with water whereas the red dotted trace refers to the signal relative to the channel filled with a solution of glucose in water with C = 10% [Weight/Volume]. It can be clearly noticed as the optical distance between the main fringe groups (thus, OP2) increases as fluids with higher refractive indices are flowed through the channel. We also observed that when a fluid different form air was present in the channel, the low-amplitude group of fringes due to multiple trips were buried into the noise, as the field reflectivity relative to these further virtual interfaces was much lower due to the lower refractive index step between fluids and polymer. In view of the application of our technique for concentration monitoring, we performed optical path-length measurements with water solutions of glucose at different concentrations in the range from 0% to 33%, by acquiring the signals relative to three scans of the translating mirror for each fluid sample. From the acquired interferometric signals, we then extracted the optical path lengths OP2 relative to the channel only. Average and standard deviation of OP2 data given as a function of the glucose concentration in water are shown in Figure 5.

    Figure 4. Absolute and normalized interferometric signals as a function of the optical path. The graph shows the groups of interferometric fringes relative to the channel interfaces, obtained using the lamp as read-out source. Black trace: signal obtained on empty channel; green dotted trace: signal obtained on the channel filled by water; pink dotted trace: signal obtained on the channel filled by water-glucose solution with 10% concentration [Weight/Volume].
    Figure 5. Optical path length of the filled fluidic channel as a function of the glucose concentration. The blue line represents the best linear fitting of the data.

    By means of a linear fitting, the sensitivity for solution concentrations, defined as S = dOP2/dC, turned out to be S = 0.139 µm/C%. Being the sensitivity of the device proportional to the optical path length, monitoring the shift of group of fringes corresponding to a double round trip of light in the fluidic channel should lead to a double sensitivity. This feature was actually exploited using the SLED as read-out source, since it provides higher optical power on a narrower emission window and allows to obtain a better signal to noise ratio also for fringes related to multiple round trips. As the emission bandwidth of the SLED is narrower than that of the lamp, its coherence length is higher, though still suitable for carefully testing the IBIDI µ-Slide.

    Figure 6 shows the interferometric signal (in absolute value and normalized to the peak amplitude) acquired over a channel filled with water, when using the SLED source for optical read-out. The optical path lengths SP1H2O and SP2H2O were not distinguishable, whereas SP3H2O and SP4H2O were clearly separated. We then repeated the glucose sensing experiments and monitored the change of the optical path length OP2 relative to the channel and of the optical path length SP4, which is proportional to 2·OP2.

    Figure 6. Interferometric signal as a function of the optical path obtained on a channel of the IBIDI® VI0.1 µ-Slide filled with water using the SLED as read-out source. OP2H2O: optical path relative to the water filled channel. SP3H2O = OP1 + OP2H2O, SP4 = OP1 + (2·OP2H2O).

    Figure 7 reports the experimental values (average and standard deviations) of the optical path lengths OP2 (blue markers and trace) and SP4 (green markers and trace) as functions of the glucose concentration in water. The sensitivity calculated by linear fitting data relative to the optical path length SP4 was found SSP4 = 0.26 µm/C% thus, as expected, twice as large as the sensitivity SOP2 = 0.13 µm/C% calculated by fitting OP2 data. The small difference between the absolute value of optical path lengths measured with the lamp and SLED is due to the different central emission wavelength, which affects the value of the group refractive index ng. The best achieved limits of detection were 0.2% and 0.8% Glucose concentration with SLED source, exploiting single and double round trip method, respectively, and 0.64% with the lamp.

    Figure 7. Optical path lengths relative to the channel (blue markers) and to the double round trip (green markers) as a function of glucose concentration in water. Straight lines: best linear fitting of the data.

    We also demonstrated that fluid flow in the channel does not affect the optical measurement. Figure 8 compares the interferometric signals acquired when the channel was filled with water or glucose solution in static condition (a) with the signals obtained with flowing fluid (b). No significant differences were observed between the signal acquired in these two different experimental conditions and the OP2 values were found in agreement, with less than 0.1% difference.

    Figure 8. Interferometric signals acquired on the channel filled with fluids in static condition (a) and with fluids in motion (b). Red trace: water, blue dotted trace: glucose 33% [Weight/Volume].

    4. Conclusion

    We demonstrated the functionality of an all-fiber setup for infra-red low-coherence reflectometry applied to a commercial plastic device, the IBIDI® VI0.1 µ-Slide, inserted in a simple microfluidic system for solution concentration detection. Using a SLED source in the read-out system we were for the first time able to monitor the double round trip of light into the fluidic channel, leading to a double sensitivity with respect to traditional single-path measurements.

    Increasing the optical path length (due to a larger channel thickness or to multiple round trips) improve sensitivity. The thickness however is limited in our current setup by the maximum traveling distance of the reference mirror (from the fiber output) that can still ensure a sufficient level of intensity coupled back to the detector to obtain a reasonable signal to noise ratio. As a matter of fact, the pigtail-style focusers with aspheric lens allow to obtain a 50-µm diameter spot with low divergence at a working distance of 23 mm but this feature is maintained on a working depth of a few millimeters. Our current setup was designed for in-depth testing of a variety of devices, characterized by a transversal section with one side as small as 50 µm. The optical setup could be modified by incorporating other kinds of fiber pigtailed collimators; however, optical path-length and dispersion matching on both reference and measuring arms must be ensured, particularly when using ultra-broadband light sources such as the lamp. Mismatch would broaden the envelope of the groups of fringes and thus limit longitudinal resolution.

    Our setup incorporates active and passive optical components suitable for the near infrared spectral region that are commercially available and already well developed for optical communications. The reported experiments were performed at room temperature, with no specific temperature control, but since source and detector are on the same side, thermal control could be easily achieved on the opposite side of the device. The proposed system offers indeed an interesting solution in the field of micro-opto-fluidic sensor: the use of near infrared light sources allows to work in a range of minimum invasiveness for biological samples, while the polymeric device offers good biocompatibility and easy interconnection with the fluidic system through standard Luer connections. Moreover, the read-out is performed in a remote and non-invasive way, with no contact with the sample under test. Changes in the optical path seen by light travelling through the channel of the slide when shone orthogonally to the device coverslip were linearly proportional to solution concentrations. Additionally, being the refractive index of solutions usually proportional to their concentration, the proposed technique could be easily applied for refractive index detection. IBIDI® µ-Slides are currently used as core elements for cell culture and drug discovery. Lancrin et al. applied IBIDI® µ-Slides to discover transcriptional targets at the endothelial to hematopoietic transition stage [22]. In [23] another IBIDI®chamber was used to study cells chemotaxis, while in [24]µ-Slides were applied to the investigation of alterations of the cytoskeleton in human cells. We previously demonstrated the applicability of the proposed OLCR system for the detection of group refractive index of cells inserted in glass micro-capillaries [17]. As µ-Slides can be used as flow-through device, the proposed system could be also applied in the field of drug discovery, to detect in a real-time manner the response of a group of cells confined in the slide channel in response to external stimuli [25]. In fact cell damages, such apoptosis, results in changes in cell shape, morphology and size [26], which implicates variations of RI. Further improvements, such as sample thermal control and more accurate displacement monitoring, are under investigations.


    Acknowledgments

    The authors would like to thank D. Savoia (Sales Agent) for providing IBIDI µ-Slide free samples as well as Dr. G. Mazzini and Dr. F. Carpignano for useful discussions. This work was partially supported by CARIPLO Foundation Grant no. 2011-0308.


    Conflict of Interest

    All authors declare no conflicts of interest in this paper.


    [1] Sackmann EK, Fulton AL, Beebe DJ (2014) The present and future role of microfluidics in biomedical research. Nature 507: 181–189. doi: 10.1038/nature13118
    [2] Whitesides GM (2006) The origins and the future of microfluidics. Nature 442: 368–373. doi: 10.1038/nature05058
    [3] Pires NMM, Dong T, Hanke U, et al. (2014) Recent developments in optical detection technologies in lab-on-a-chip devices for biosensing applications. Sensors 14: 15458–15479. doi: 10.3390/s140815458
    [4] Nunes PS, Mortensen NA, Kutter JP, et al. (2008) Photonic crystal resonator integrated in a microfluidic system. Opt Lett 33: 1623–1625.
    [5] Duncombe TA, Tentori AM, Herr AE (2015) Microfluidics: reframing biological enquiry. Nat Rev Mol Cell Biol 16: 554–567. doi: 10.1038/nrm4041
    [6] Hunt K, Armani AM (2010) Label-free biological and chemical sensors. Nanoscale 2: 1544–1559. doi: 10.1039/c0nr00201a
    [7] Fang Y (2014) Label-free drug discovery. Front Pharmacol 5: 1–8.
    [8] Tsuda T, Sweedler JV, Zare RN (1990) Rectangular capillaries for capillary zone electrophoresis. Anal Chem 62: 2149–2152. doi: 10.1021/ac00218a020
    [9] Evander M, Tenje M (2014) Microfluidic PMMA interfaces for rectangular glass capillaries. J Micromech Microeng 24: 1–5.
    [10] Hammarström B, Evander M, Barbeau H, et al. (2010) Non-contact acoustic cell trapping in disposable glass capillaries. Lab Chip 10: 2251–2257. doi: 10.1039/c004504g
    [11] Geckeler KE, Müller B (1993) Polymer materials in biosensors. Naturwissenschaften 80: 18–24.
    [12] Sorin WV, Gray DF (1992) Simultaneous thickness and group index measurement using optical low-coherence reflectometry. IEEE Photon Technol Lett 4: 105–107. doi: 10.1109/68.124892
    [13] Lee BH, Min EJ, Kim YH (2013) Fiber-based optical coherence tomography for biomedical imaging, sensing, and precision measurements. Opt Fiber Technol 19: 729–740. doi: 10.1016/j.yofte.2013.07.011
    [14] Izatt JA, Choma MA (2008) Theory of optical choerence thomography, In: W. Drexler and J. G. Fujimoto, Optical Coherence Tomography: Technology and Applications, Springer Berlin Heidelberg, 47–72.
    [15] Youngquist RC, Carr S, Davies DEN (1987) Optical coherence-domain reflectometry: a new optical evaluation technique. Opt Lett 12: 158–160. doi: 10.1364/OL.12.000158
    [16] Vabre L, Dubois A, Boccara AC (2002) Thermal-light full-field optical coherence tomography. Opt Lett 27: 530–532. doi: 10.1364/OL.27.000530
    [17] Carpignano F, Rigamonti G, Mazzini G, et al. (2016) Low-coherence reflectometry for refractive index measurements of cells in micro-capillaries. Sensors 16: 1670. doi: 10.3390/s16101670
    [18] Carpignano F, Rigamonti G, Merlo S (2015) Characterization of rectangular glass microcapillaries by low-coherence reflectometry. IEEE Photon Technol Lett 27: 1064–1067.
    [19] Carpignano F, Surdo S, Barillaro G, et al. (2015) Silicon micromachined device testing by infrared low-coherence reflectometry. J Microelectromech Syst 24: 1960–1964. doi: 10.1109/JMEMS.2015.2453367
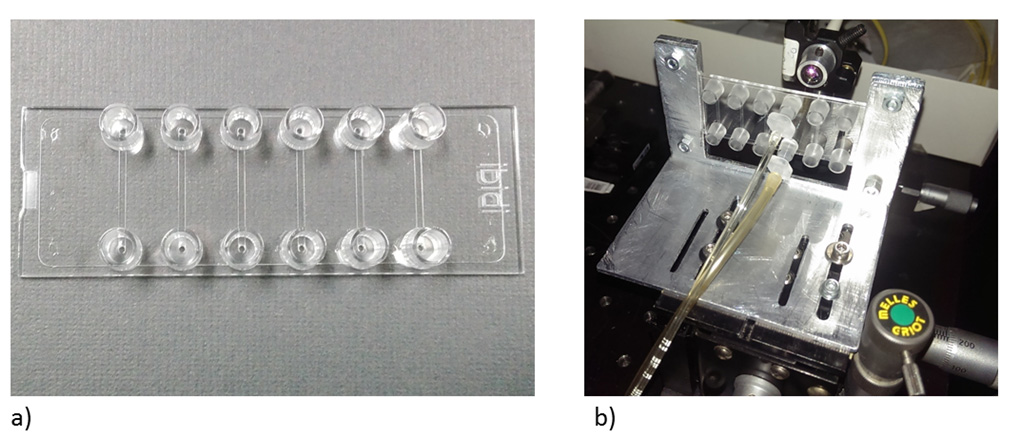
    [20] Ibidi®, µ–Slide VI0.1, 2014. Available from: http://ibidi.com/xtproducts/en/ibidi-Labware/ Channel-Slides/ m-Slide-VI-0.4.
    [21] Rollins AM, Izatt JA (1999) Optimal interferometer designs for optical coherence tomography. Opt Lett 24: 1484–1486. doi: 10.1364/OL.24.001484
    [22] Lancrin C, Mazan M, Stefanska M, et al. (2012) GFI1 and GFI1B control the loss of endothelial identity of hemogenic endothelium during hematopoietic commitment. Blood 120: 314–322. doi: 10.1182/blood-2011-10-386094
    [23] Zengel P, Nguyen-Hoang A, Schildhammer C, et al. (2011) μ-Slide Chemotaxis: a new chamber for long-term chemotaxis studies. BMC Cell Biol 12: 2–14.
    [24] Corydon TJ, Kopp S, Wehland M, et al. (2016) Alterations of the cytoskeleton in human cells in space proved by life-cell imaging. Sci Rep 6: 1–14.
    [25] Aredia F, Carpignano F, Surdo S, et al. (2016) An innovative cell micro-incubator for drug-discovery based on 3D silicon structures. J Nanomater, 2016: 1–10.
    [26] Elmore S (2007) Apoptosis: a review of programmed cell death. Toxicol Pathol 35: 495–516.
  • This article has been cited by:

    1. Giulia Rigamonti, Sabina Merlo, 2017, A novel microfluidic sensing platform based on miniature rectangular glass capillaries and optical readout, 978-1-5386-3974-0, 1, 10.1109/ECCTD.2017.8093311
    2. Taeyeong Kim, Minwoo Choi, Bong Jae Lee, Jungchul Lee, Liquid refractive index measurements using cavity in silicon via near-infrared interferometry, 2025, 381, 09244247, 116078, 10.1016/j.sna.2024.116078
  • Reader Comments
  • © 2016 the Author(s), licensee AIMS Press. This is an open access article distributed under the terms of the Creative Commons Attribution License (http://creativecommons.org/licenses/by/4.0)
通讯作者: 陈斌, bchen63@163.com
  • 1. 

    沈阳化工大学材料科学与工程学院 沈阳 110142

  1. 本站搜索
  2. 百度学术搜索
  3. 万方数据库搜索
  4. CNKI搜索

Metrics

Article views(6074) PDF downloads(925) Cited by(2)

Article outline

Figures and Tables

Figures(8)

/

DownLoad:  Full-Size Img  PowerPoint
Return
Return

Catalog